| Param | Original file | Final file |
|---|---|---|
| Filename | modeM0/AS1A07_148T05_9000003346_22555cztM0_level2.evt | modeM0/AS1A07_148T05_9000003346_22555cztM0_level2_quad_clean.evt |
| Size (bytes) | 532,566,720 | 97,680,960 |
| Size | 507.9 MB | 93.2 MB |
| Events in quadrant A | 3,733,620 | 609,217 |
| Events in quadrant B | 3,903,194 | 620,888 |
| Events in quadrant C | 3,951,724 | 601,558 |
| Events in quadrant D | 4,018,522 | 592,174 |
| Mode M9 | |||
|---|---|---|---|
| Quadrant | BADHDUFLAG | Total packets | Discarded packets |
| A | 0 | 14 | 0 |
| B | 0 | 14 | 0 |
| C | 0 | 14 | 0 |
| D | 0 | 14 | 0 |
| Mode M0 | |||
|---|---|---|---|
| Quadrant | BADHDUFLAG | Total packets | Discarded packets |
| A | 0 | 16085 | 2 |
| B | 0 | 16633 | 2 |
| C | 0 | 16622 | 2 |
| D | 0 | 17311 | 2 |
| Mode SS | |||
|---|---|---|---|
| Quadrant | BADHDUFLAG | Total packets | Discarded packets |
| A | 0 | 156 | 0 |
| B | 0 | 156 | 0 |
| C | 0 | 156 | 0 |
| D | 0 | 156 | 0 |
| Quadrant | Total seconds | Saturated seconds | Saturation percentage |
|---|---|---|---|
| A | 7688 | 73 | 0.949532% |
| B | 7688 | 152 | 1.977107% |
| C | 7688 | 181 | 2.354318% |
| D | 7688 | 147 | 1.912071% |
Noise dominated data is calculated using 1-second bins in cleaned event files. If a bin has >2000 counts, and if more than 50% of those come from <1% of pixels, then it is considered to be noise-dominated and hence unusable.
| Quadrant | # 1 sec bins | Bins with >0 counts | Bins with >2000 counts | High rate bins dominated by noise | Noise dominated (total time) | Noise dominated (detector-on time) | Marked lightcurve |
|---|---|---|---|---|---|---|---|
| A | 9003 | 7690 | 0 | 0 | 0.00% | 0.00% | 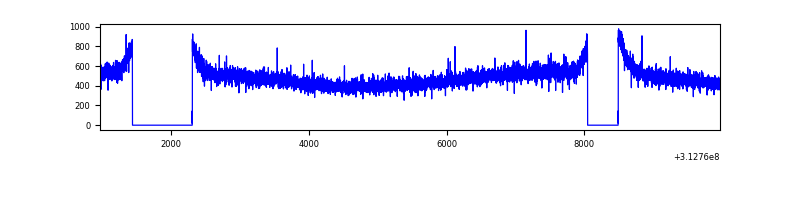 |
| B | 9003 | 7690 | 5 | 5 | 0.06% | 0.07% | 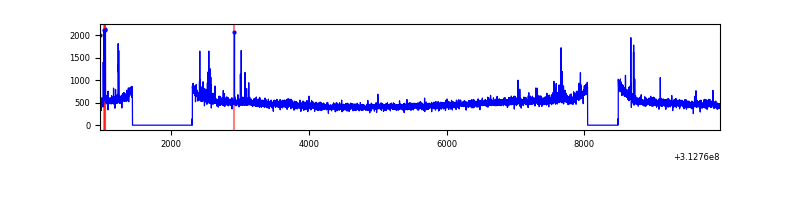 |
| C | 9003 | 7690 | 1 | 1 | 0.01% | 0.01% | 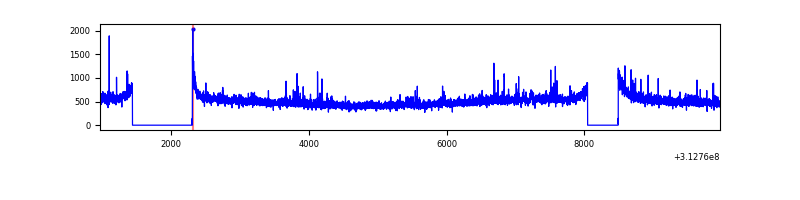 |
| D | 9003 | 7690 | 57 | 57 | 0.63% | 0.74% | 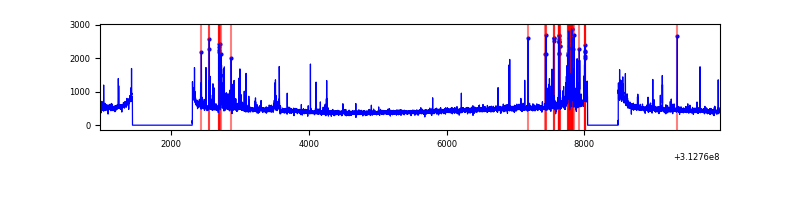 |
Top three noisy pixels from each quadrant. If the there are fewer than three noisy pixels in the level2.evt file, extra rows are filled as -1
| Pixel properties | Quadrant properties | ||||||
|---|---|---|---|---|---|---|---|
| Quadrant | DetID | PixID | Counts | Sigma | Mean | Median | Sigma |
| A | 13 | 254 | 13157 | 62.2 | 968 | 946 | 196.3 |
| A | 0 | 226 | 8427 | 38.11 | 968 | 946 | 196.3 |
| A | 3 | 137 | 8382 | 37.88 | 968 | 946 | 196.3 |
| B | 15 | 33 | 74194 | 392.64 | 965 | 937 | 186.6 |
| B | 0 | 228 | 26446 | 136.72 | 965 | 937 | 186.6 |
| B | 12 | 111 | 22284 | 114.41 | 965 | 937 | 186.6 |
| C | 14 | 238 | 146172 | 665.21 | 932 | 937 | 218.3 |
| C | 0 | 207 | 138712 | 631.04 | 932 | 937 | 218.3 |
| C | 0 | 10 | 19849 | 86.62 | 932 | 937 | 218.3 |
| D | 13 | 172 | 173473 | 749.55 | 941 | 912 | 230.2 |
| D | 13 | 249 | 169871 | 733.9 | 941 | 912 | 230.2 |
| D | 1 | 52 | 45795 | 194.96 | 941 | 912 | 230.2 |
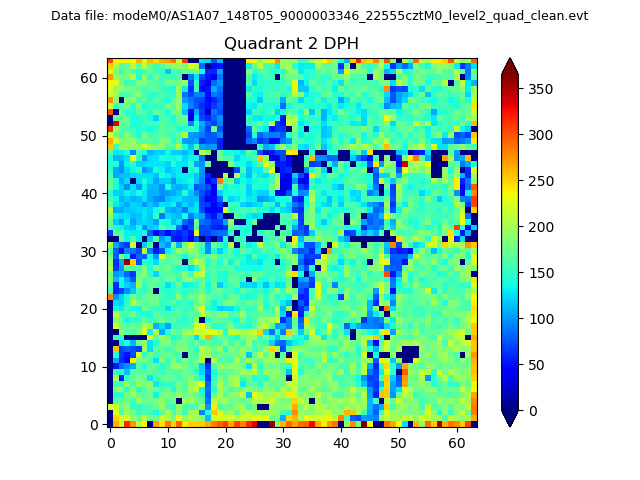
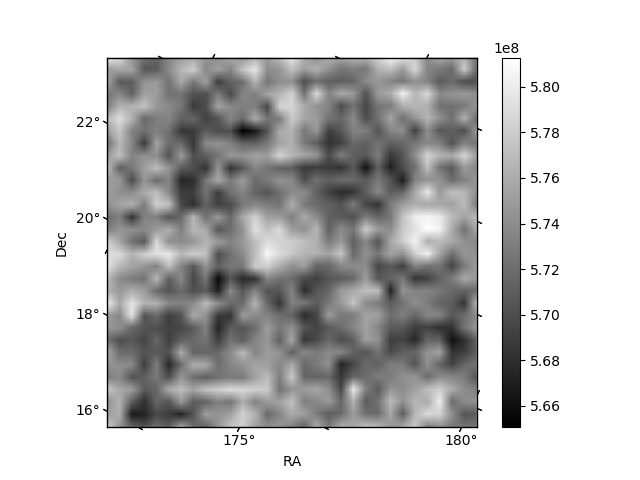
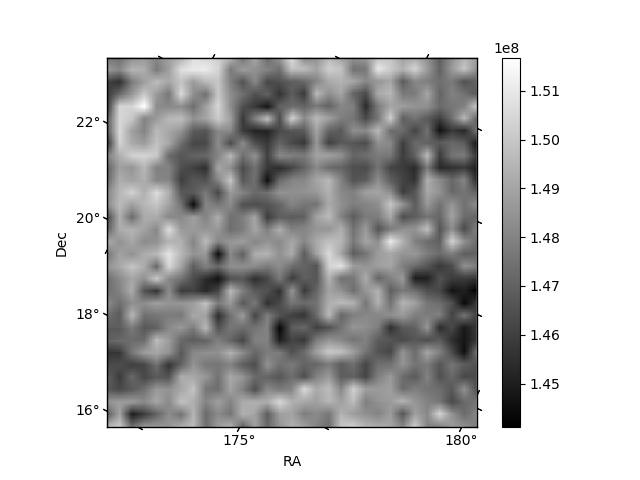
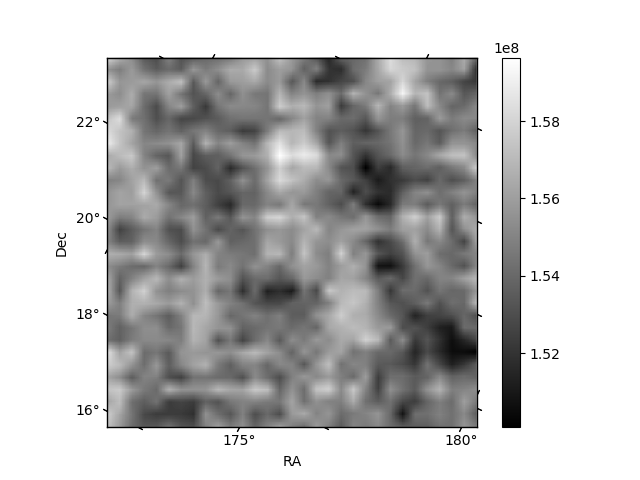
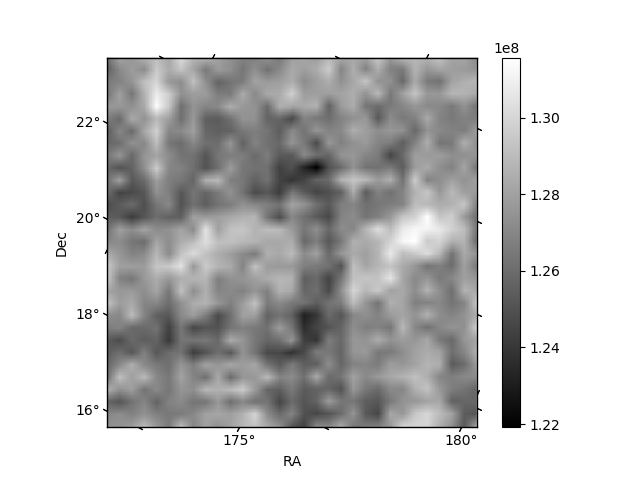
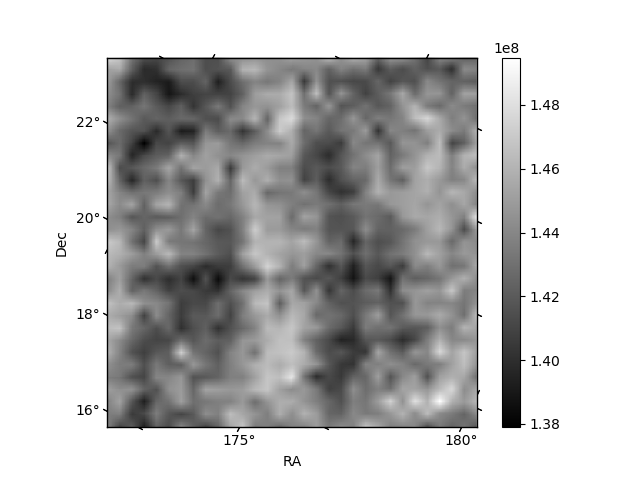
Histogram calculated using DETX and DETY for each event in the final _common_clean file
| Quadrant A | 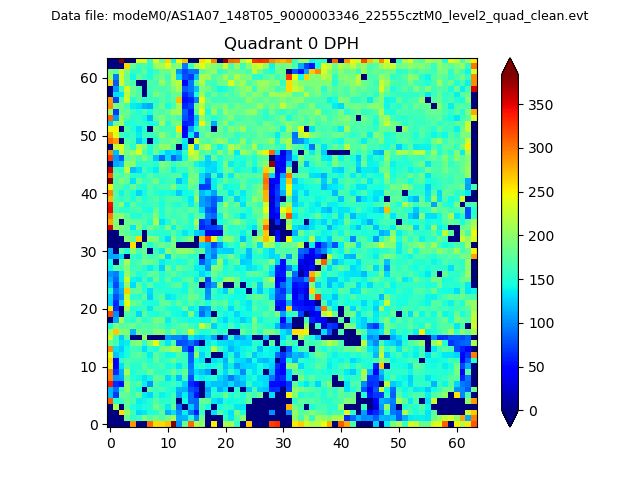 |
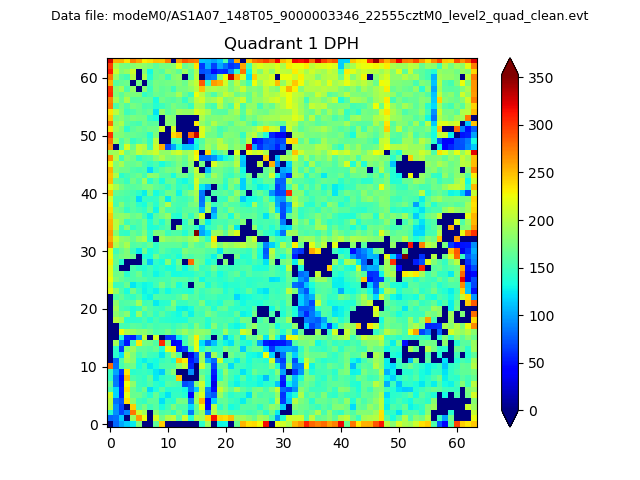 |
Quadrant B |
|---|---|---|---|
| Quadrant D | 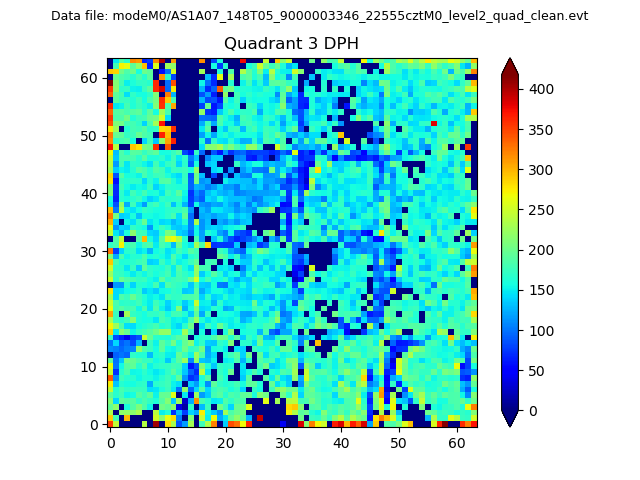 |
 |
Quadrant C |
| Plot type | Count rate plots | Images |
|---|---|---|
| Comparison with Poisson distribution Blue bars denote a histogram of data divided into 1 sec bins. Red curve is a Poisson curve with rate = median count rate of data. |
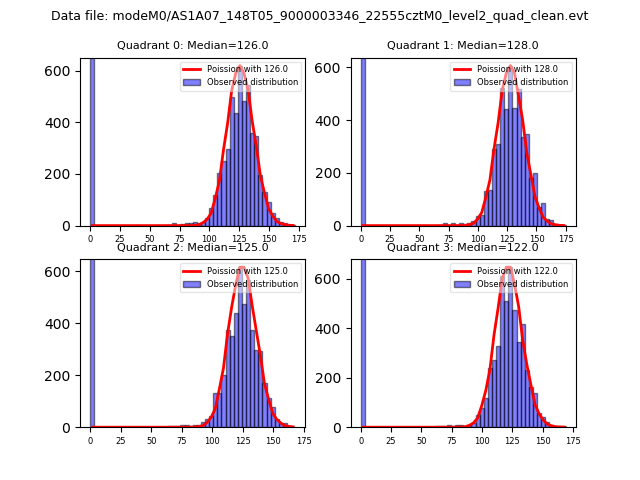 |
 |
| Quadrant-wise count rates Data is divided into 100 sec bins |
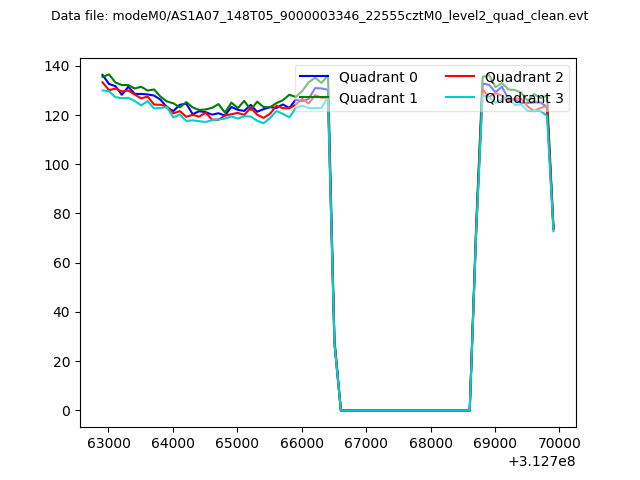 |
|
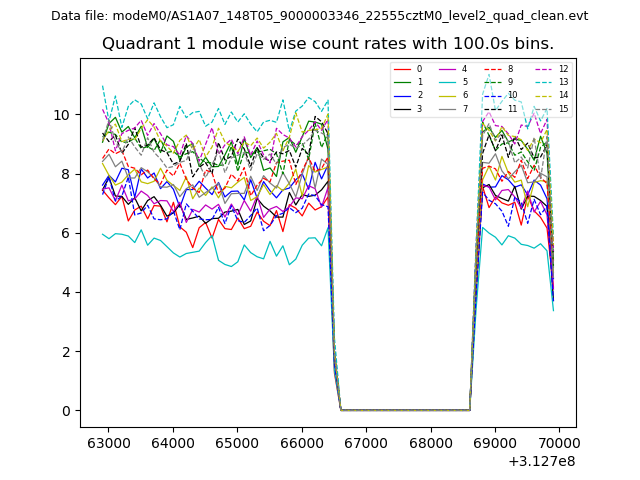
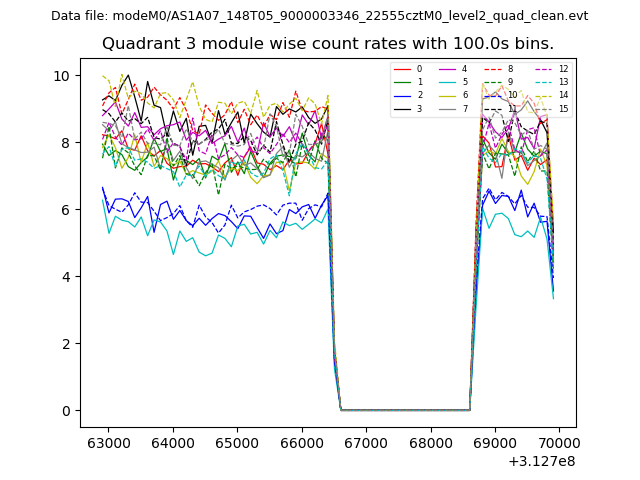
| Module-wise count rates for Quadrant A Data is divided into 100 sec bins |
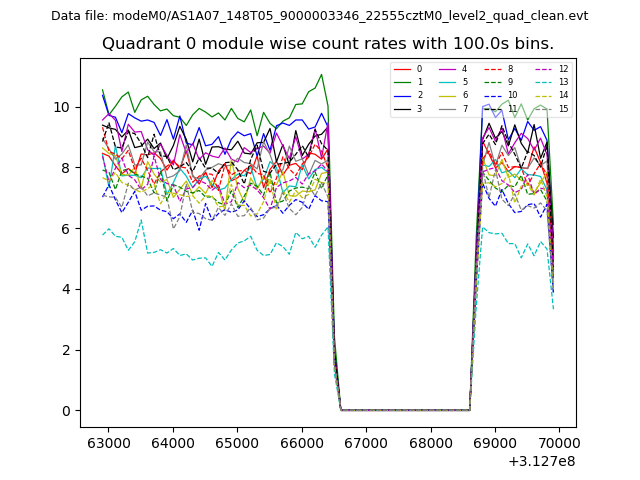 |
 |
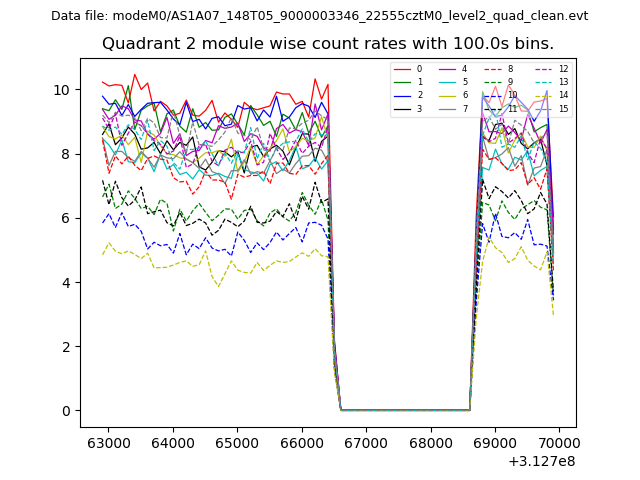
| Module-wise count rates for Quadrant B Data is divided into 100 sec bins |
 |
 |
| Module-wise count rates for Quadrant C Data is divided into 100 sec bins |
 |
 |
| Module-wise count rates for Quadrant D Data is divided into 100 sec bins |
 |
 |
| Parameter | Plot |
|---|---|
| CZT HV Monitor | 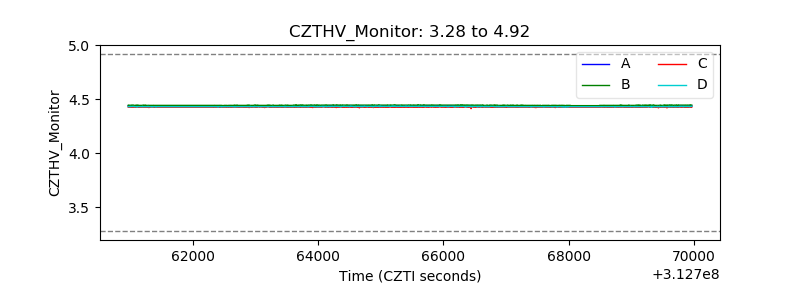 |
| D_VDD | 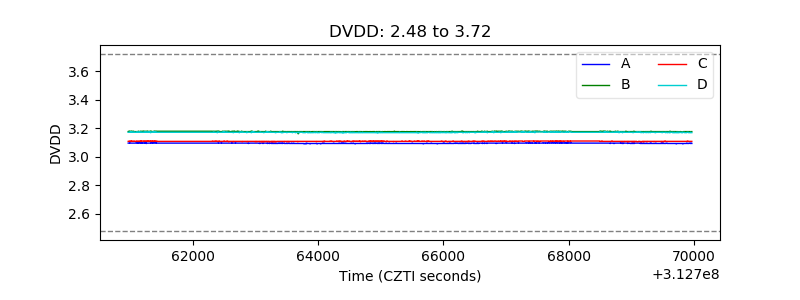 |
| Temperature 1 | 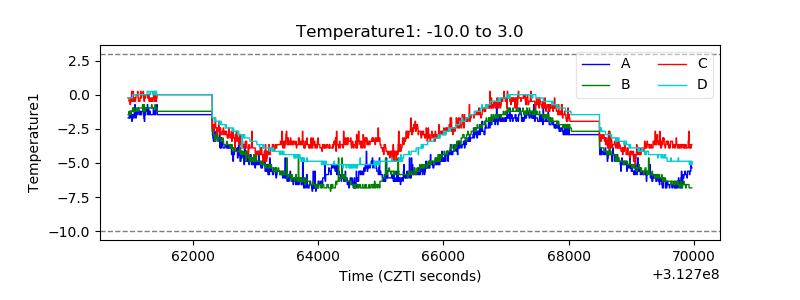 |
| Veto HV Monitor | 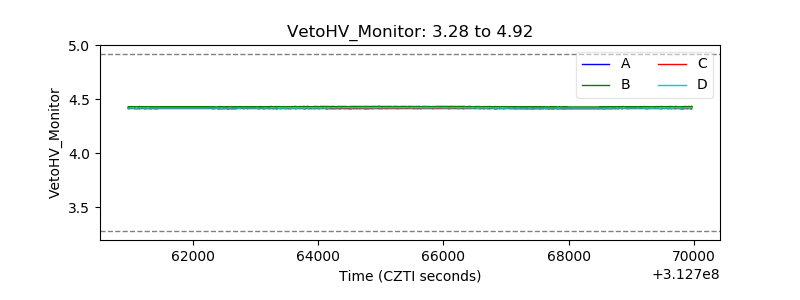 |
| Veto LLD | 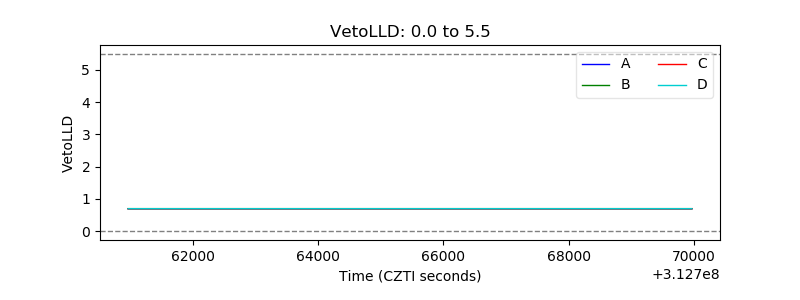 |
| Alpha Counter | 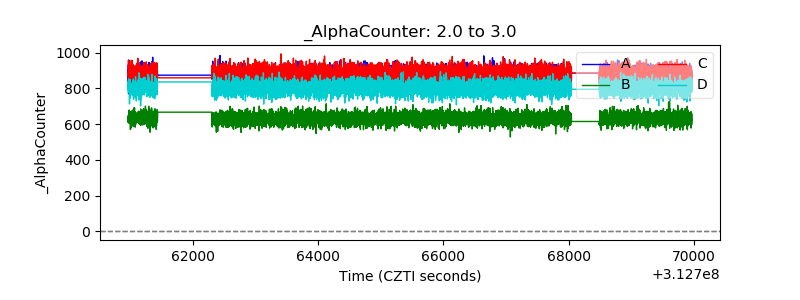 |
| _CPM_Rate | 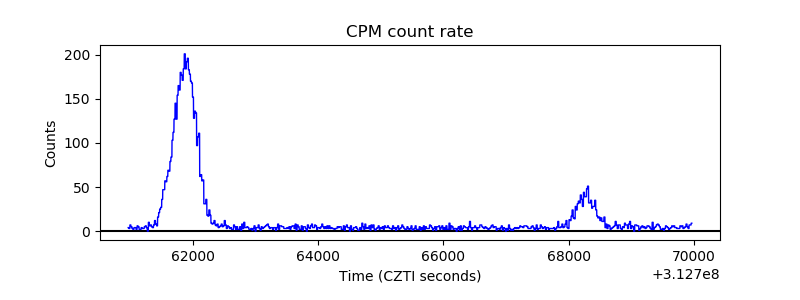 |
| CZT Counter | 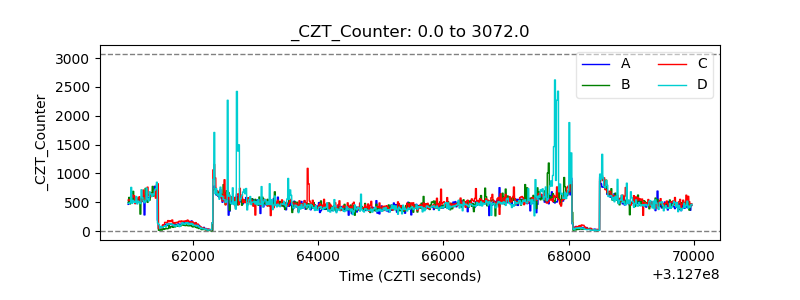 |
| +2.5 Volts monitor |  |
| +5 Volts monitor |  |
| _ROLL_ROT | 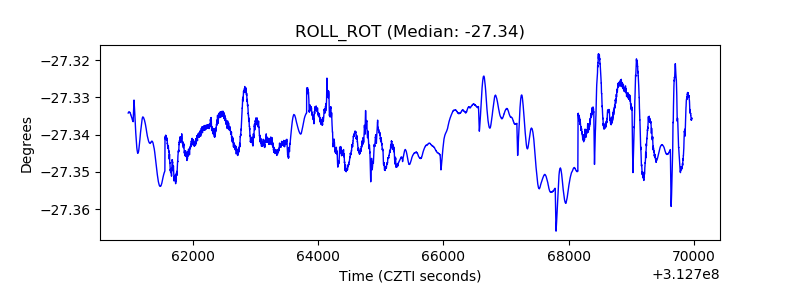 |
| _Roll_DEC | 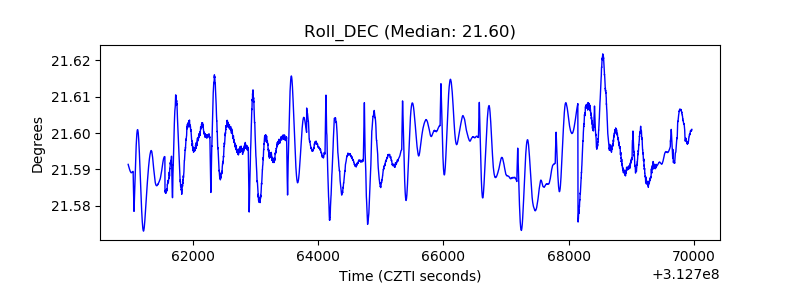 |
| _Roll_RA | 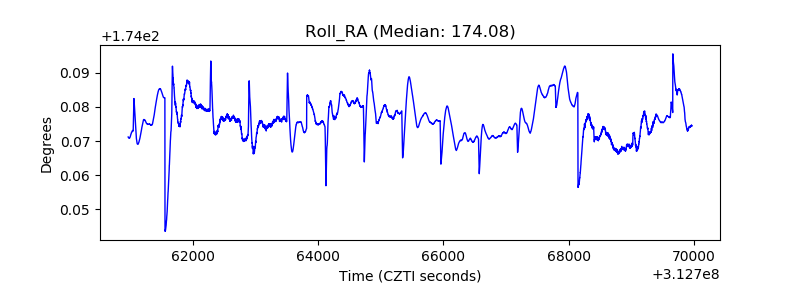 |
| Veto Counter | 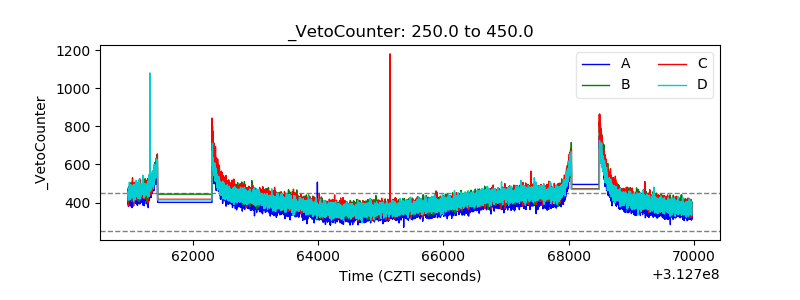 |