| Param | Original file | Final file |
|---|---|---|
| Filename | modeM0/AS1A07_148T05_9000003346_22556cztM0_level2.evt | modeM0/AS1A07_148T05_9000003346_22556cztM0_level2_quad_clean.evt |
| Size (bytes) | 604,632,960 | 108,843,840 |
| Size | 576.6 MB | 103.8 MB |
| Events in quadrant A | 4,245,958 | 677,311 |
| Events in quadrant B | 4,454,933 | 688,583 |
| Events in quadrant C | 4,454,354 | 666,563 |
| Events in quadrant D | 4,559,877 | 653,795 |
| Mode M9 | |||
|---|---|---|---|
| Quadrant | BADHDUFLAG | Total packets | Discarded packets |
| A | 0 | 7 | 0 |
| B | 0 | 7 | 0 |
| C | 0 | 7 | 0 |
| D | 0 | 7 | 0 |
| Mode M0 | |||
|---|---|---|---|
| Quadrant | BADHDUFLAG | Total packets | Discarded packets |
| A | 0 | 18432 | 2 |
| B | 0 | 19037 | 2 |
| C | 0 | 18896 | 2 |
| D | 0 | 19798 | 2 |
| Mode SS | |||
|---|---|---|---|
| Quadrant | BADHDUFLAG | Total packets | Discarded packets |
| A | 0 | 180 | 0 |
| B | 0 | 180 | 0 |
| C | 0 | 180 | 0 |
| D | 0 | 180 | 0 |
| Quadrant | Total seconds | Saturated seconds | Saturation percentage |
|---|---|---|---|
| A | 8787 | 86 | 0.978719% |
| B | 8787 | 162 | 1.843633% |
| C | 8787 | 211 | 2.401275% |
| D | 8787 | 173 | 1.968818% |
Noise dominated data is calculated using 1-second bins in cleaned event files. If a bin has >2000 counts, and if more than 50% of those come from <1% of pixels, then it is considered to be noise-dominated and hence unusable.
| Quadrant | # 1 sec bins | Bins with >0 counts | Bins with >2000 counts | High rate bins dominated by noise | Noise dominated (total time) | Noise dominated (detector-on time) | Marked lightcurve |
|---|---|---|---|---|---|---|---|
| A | 9497 | 8789 | 0 | 0 | 0.00% | 0.00% | 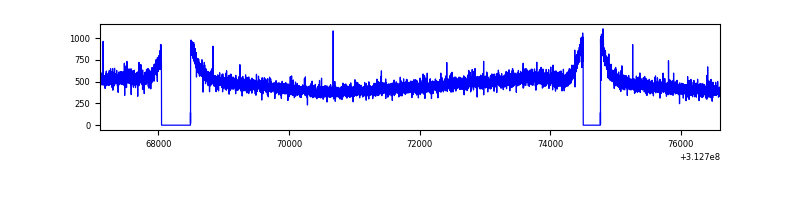 |
| B | 9497 | 8789 | 4 | 4 | 0.04% | 0.05% | 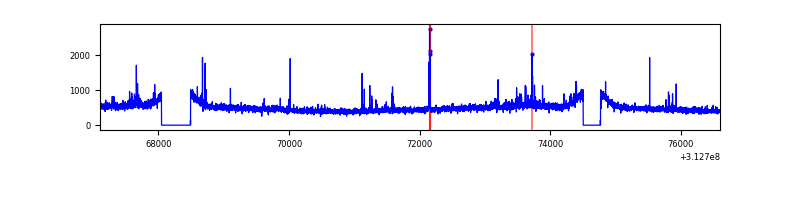 |
| C | 9497 | 8789 | 0 | 0 | 0.00% | 0.00% | 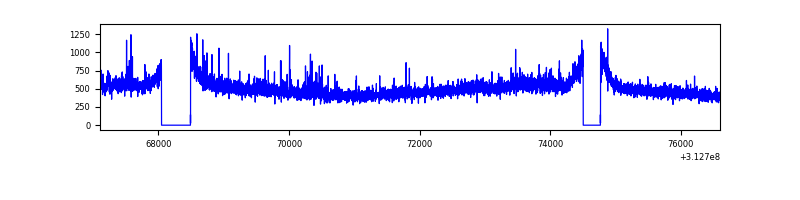 |
| D | 9497 | 8789 | 65 | 65 | 0.68% | 0.74% | 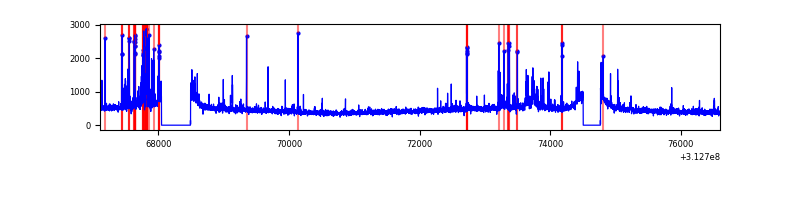 |
Top three noisy pixels from each quadrant. If the there are fewer than three noisy pixels in the level2.evt file, extra rows are filled as -1
| Pixel properties | Quadrant properties | ||||||
|---|---|---|---|---|---|---|---|
| Quadrant | DetID | PixID | Counts | Sigma | Mean | Median | Sigma |
| A | 13 | 254 | 15496 | 64.61 | 1101 | 1078 | 223.2 |
| A | 3 | 137 | 9702 | 38.64 | 1101 | 1078 | 223.2 |
| A | 0 | 226 | 9460 | 37.56 | 1101 | 1078 | 223.2 |
| B | 15 | 33 | 40743 | 186.39 | 1101 | 1073 | 212.8 |
| B | 5 | 172 | 27095 | 122.26 | 1101 | 1073 | 212.8 |
| B | 12 | 111 | 25763 | 116.0 | 1101 | 1073 | 212.8 |
| C | 14 | 238 | 164548 | 653.67 | 1061 | 1067 | 250.1 |
| C | 0 | 207 | 140732 | 558.44 | 1061 | 1067 | 250.1 |
| C | 10 | 22 | 10824 | 39.01 | 1061 | 1067 | 250.1 |
| D | 13 | 249 | 126877 | 476.89 | 1068 | 1035 | 263.9 |
| D | 13 | 172 | 118330 | 444.5 | 1068 | 1035 | 263.9 |
| D | 13 | 174 | 103117 | 386.85 | 1068 | 1035 | 263.9 |
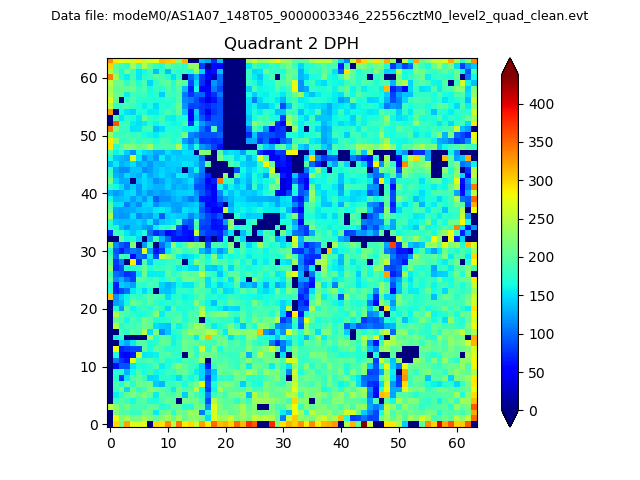
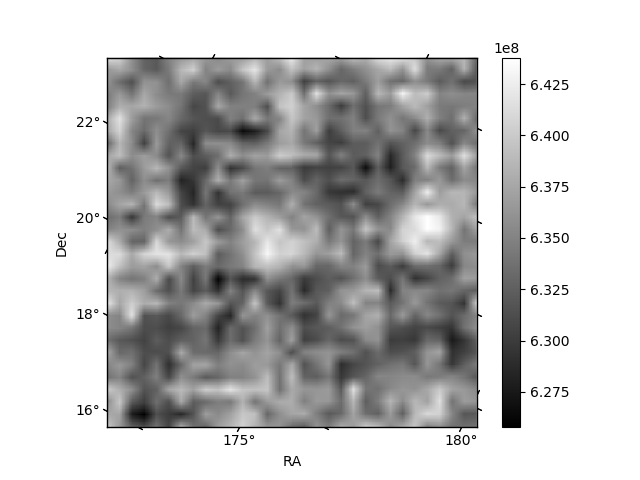
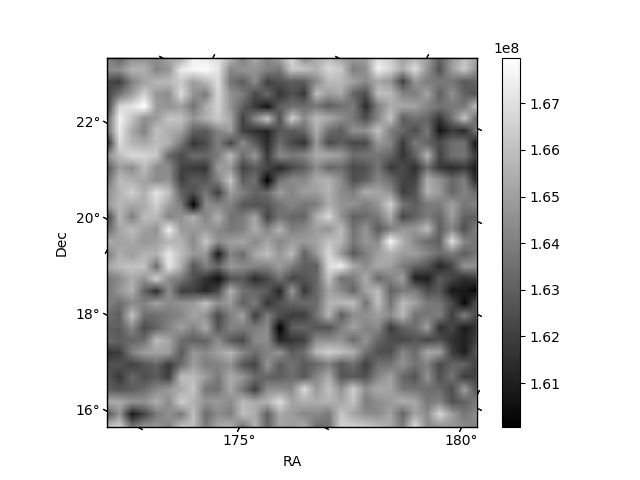
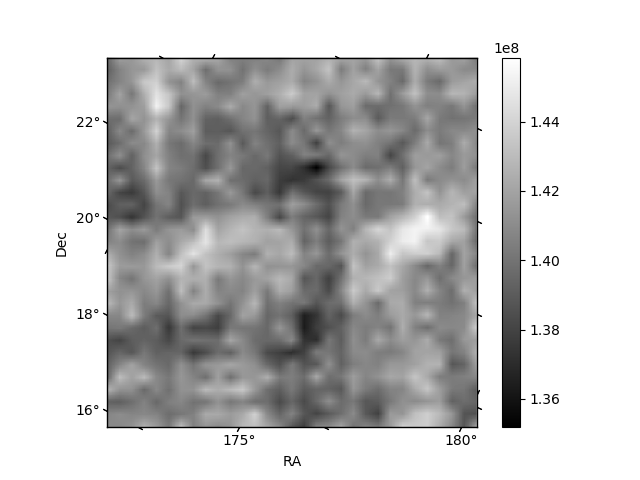
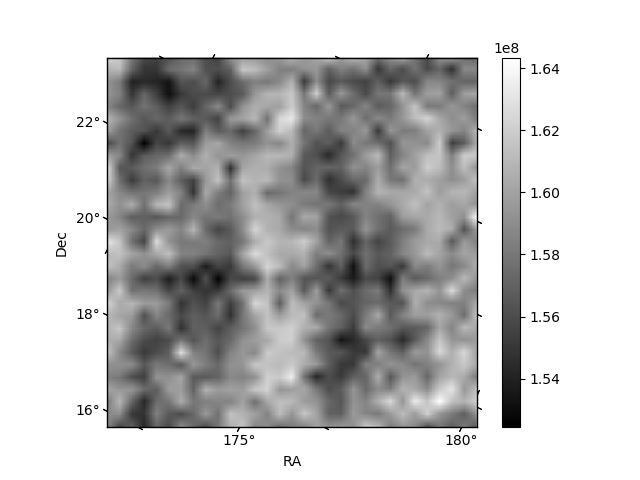
Histogram calculated using DETX and DETY for each event in the final _common_clean file
| Quadrant A | 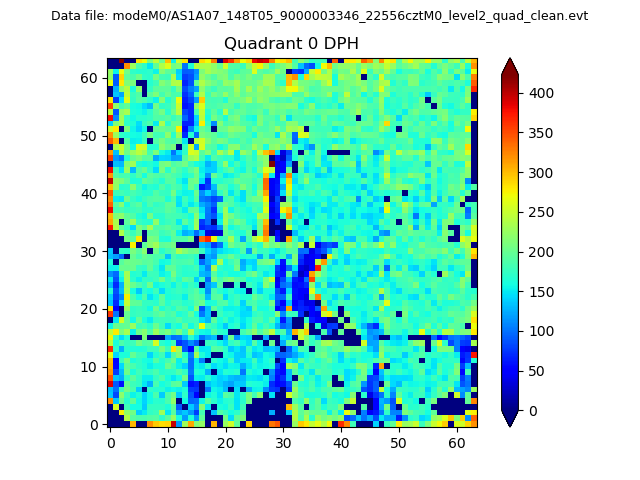 |
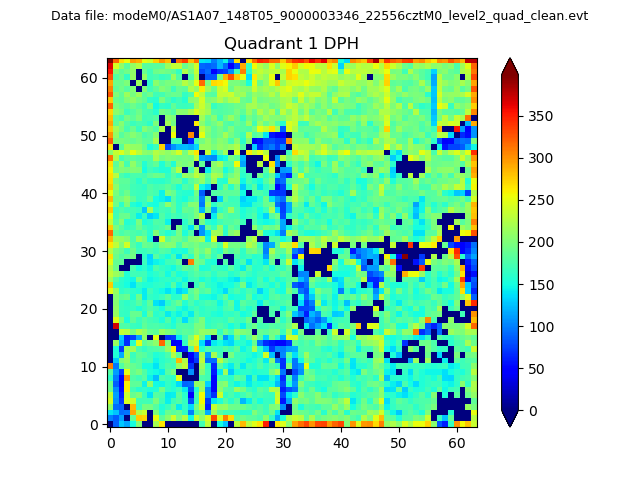 |
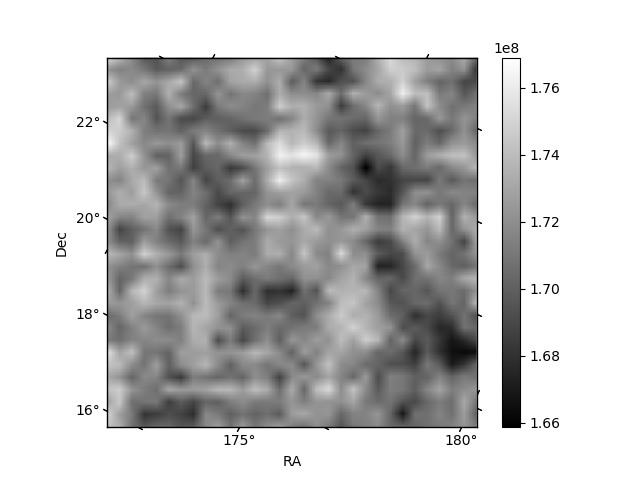
Quadrant B |
|---|---|---|---|
| Quadrant D | 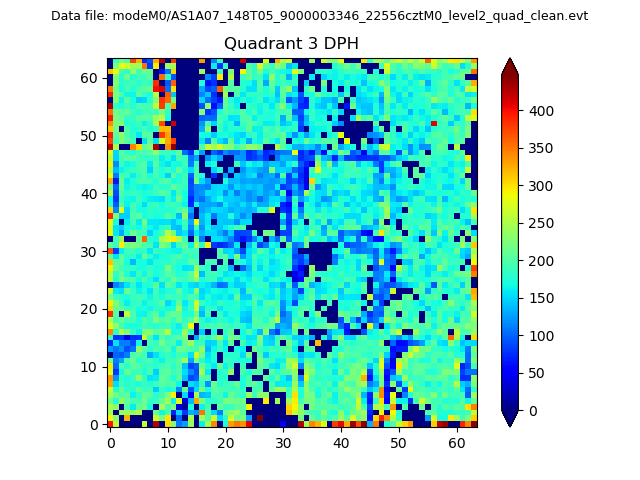 |
 |
Quadrant C |
| Plot type | Count rate plots | Images |
|---|---|---|
| Comparison with Poisson distribution Blue bars denote a histogram of data divided into 1 sec bins. Red curve is a Poisson curve with rate = median count rate of data. |
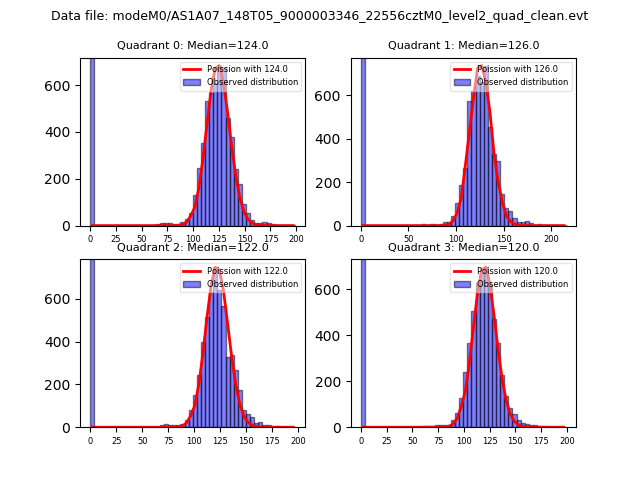 |
 |
| Quadrant-wise count rates Data is divided into 100 sec bins |
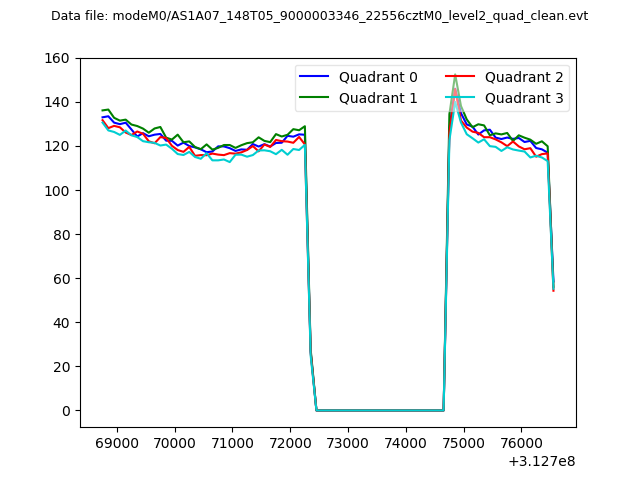 |
|
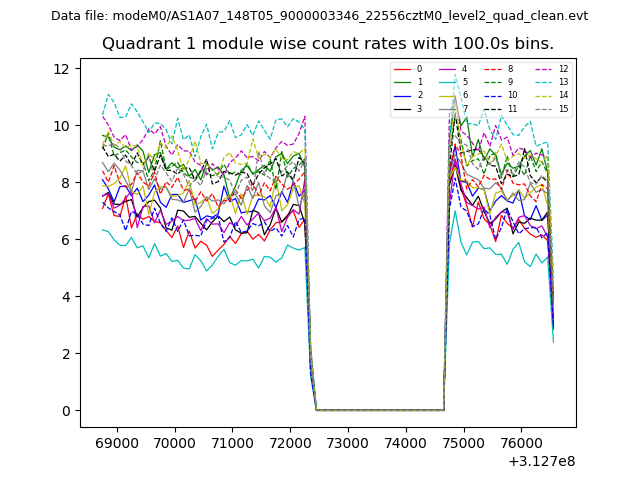
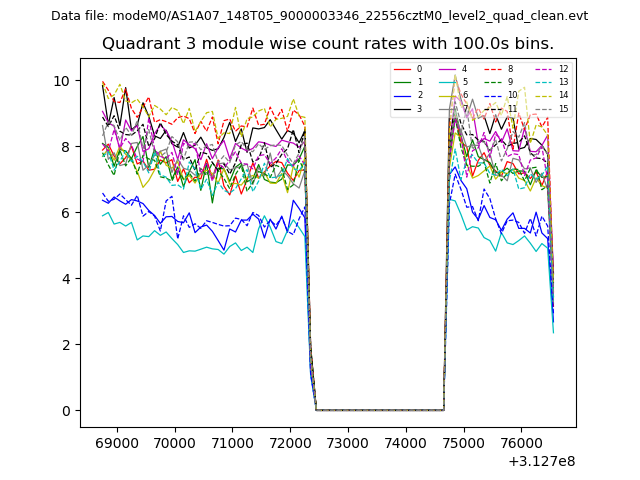
| Module-wise count rates for Quadrant A Data is divided into 100 sec bins |
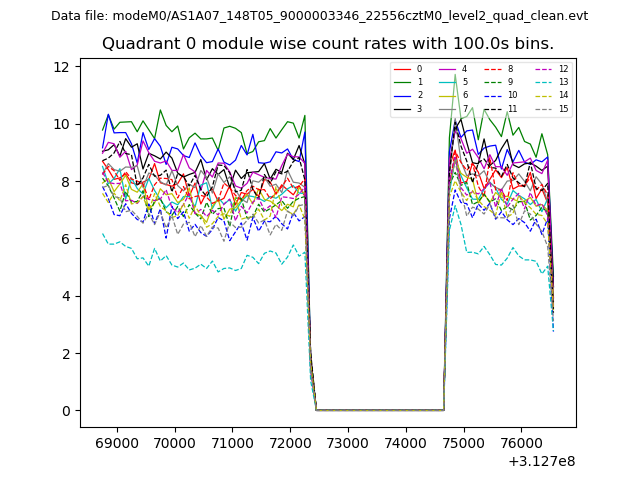 |
 |
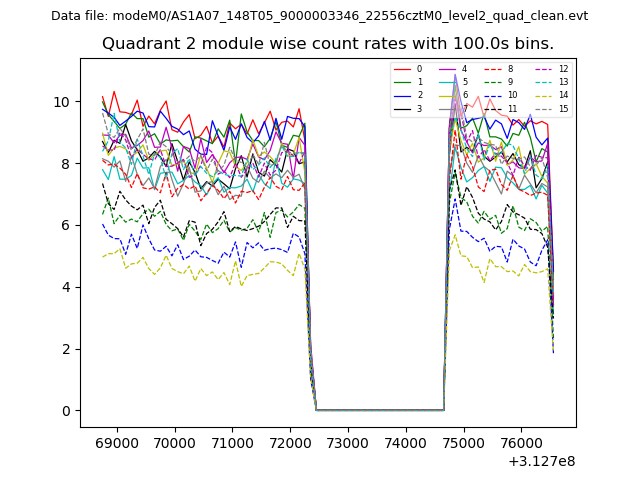
| Module-wise count rates for Quadrant B Data is divided into 100 sec bins |
 |
 |
| Module-wise count rates for Quadrant C Data is divided into 100 sec bins |
 |
 |
| Module-wise count rates for Quadrant D Data is divided into 100 sec bins |
 |
 |
| Parameter | Plot |
|---|---|
| CZT HV Monitor | 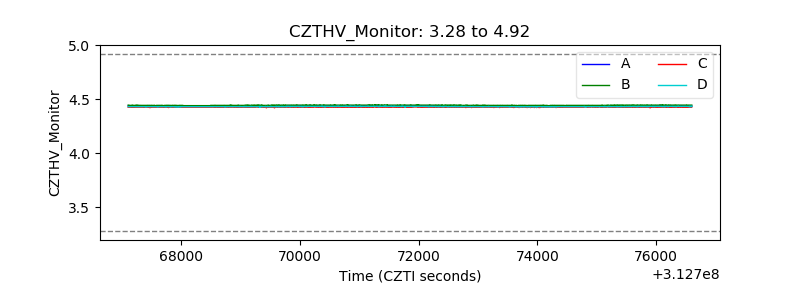 |
| D_VDD | 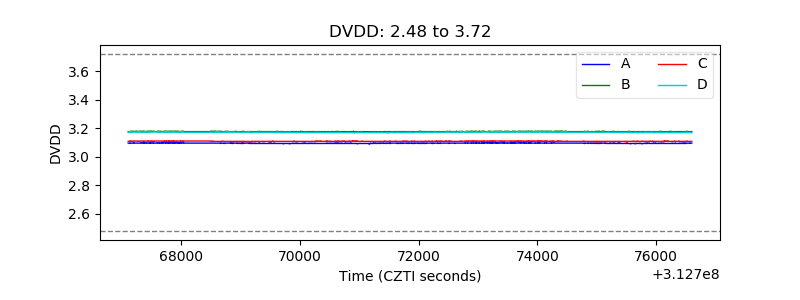 |
| Temperature 1 | 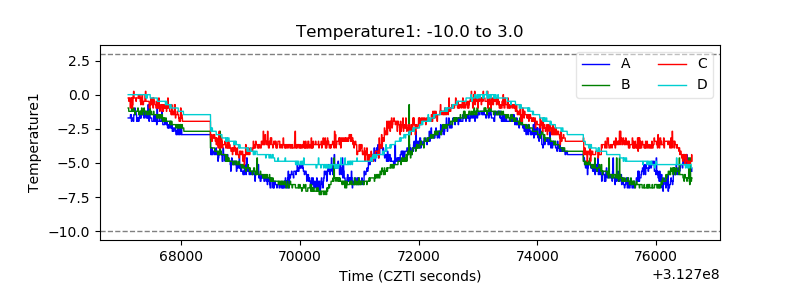 |
| Veto HV Monitor | 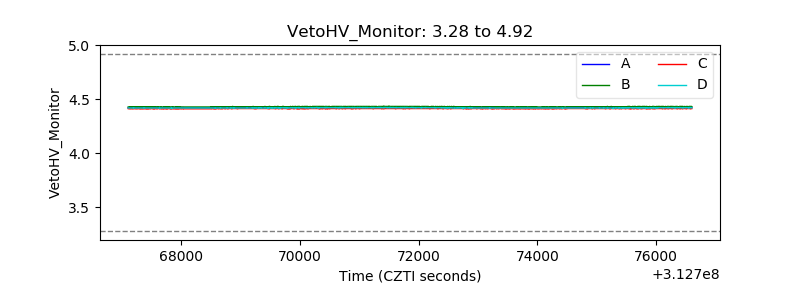 |
| Veto LLD | 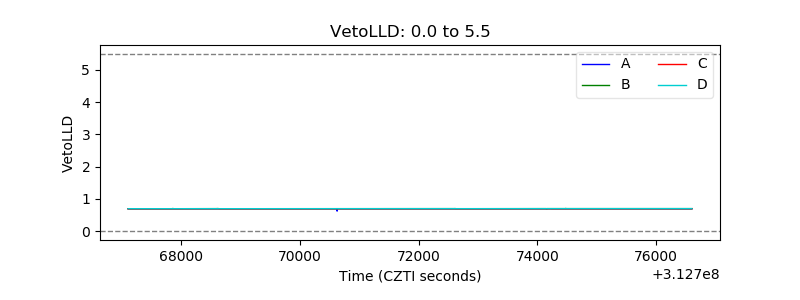 |
| Alpha Counter | 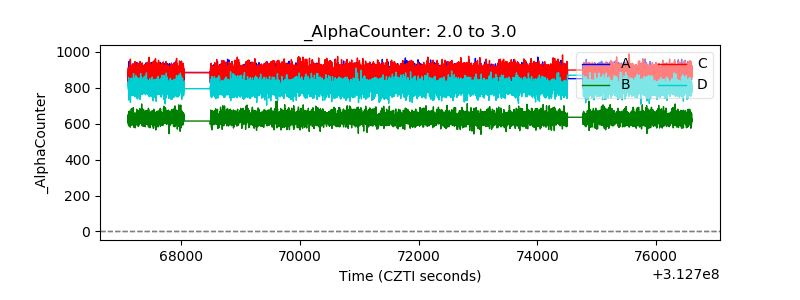 |
| _CPM_Rate | 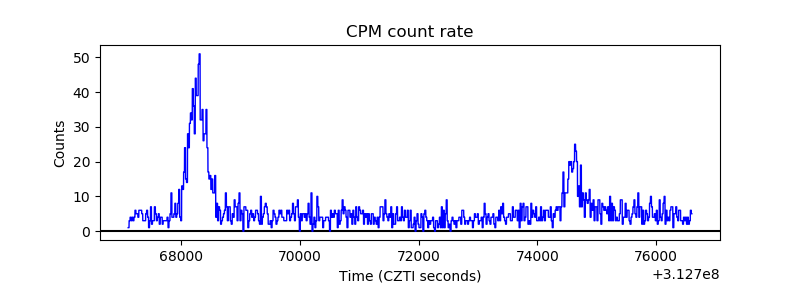 |
| CZT Counter | 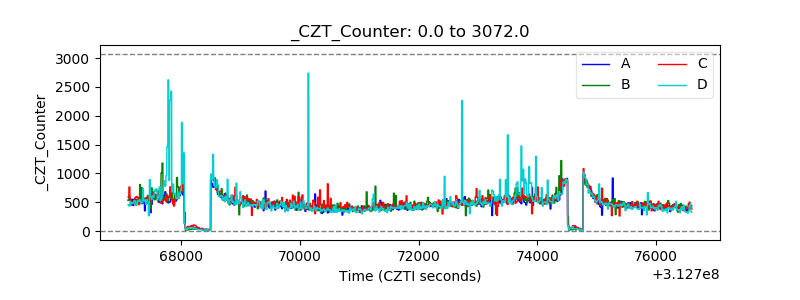 |
| +2.5 Volts monitor |  |
| +5 Volts monitor | 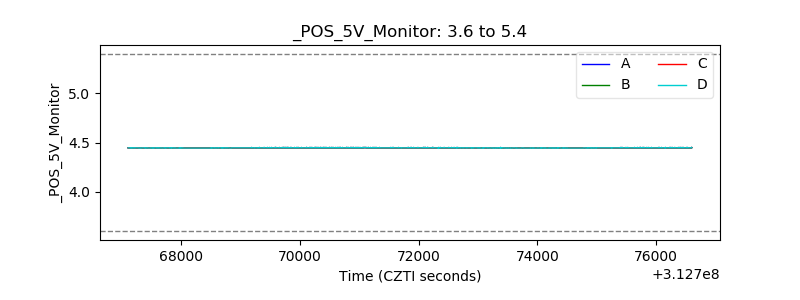 |
| _ROLL_ROT | 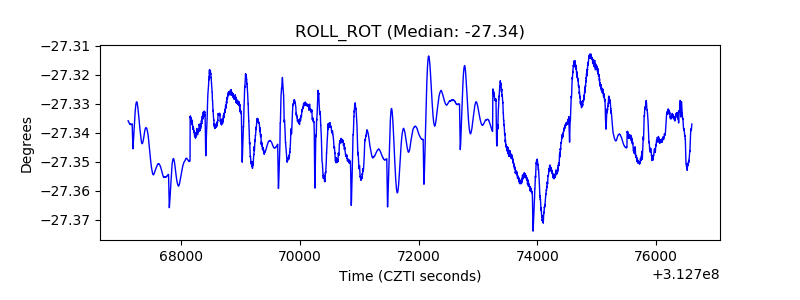 |
| _Roll_DEC | 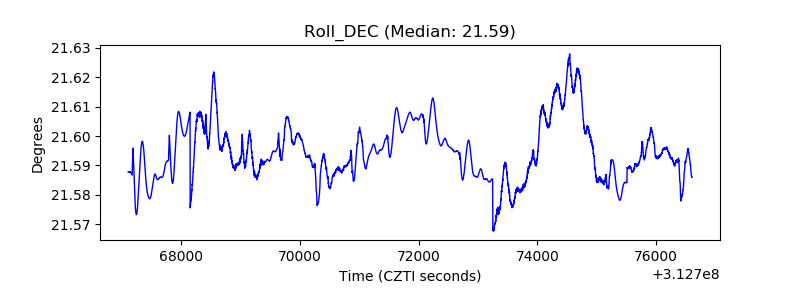 |
| _Roll_RA | 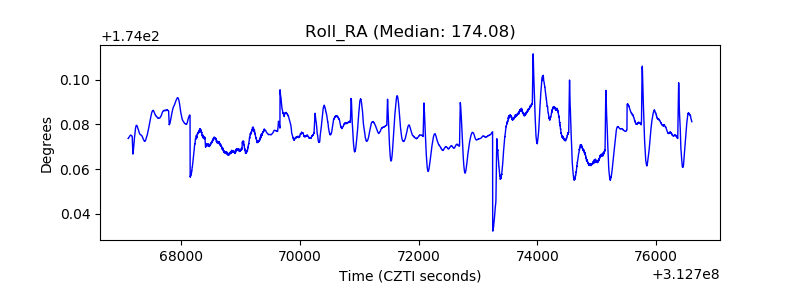 |
| Veto Counter | 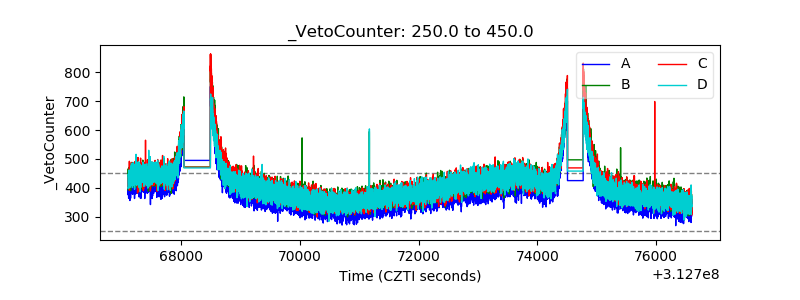 |