| Param | Original file | Final file |
|---|---|---|
| Filename | modeM0/AS1A07_148T05_9000003346_22557cztM0_level2.evt | modeM0/AS1A07_148T05_9000003346_22557cztM0_level2_quad_clean.evt |
| Size (bytes) | 539,032,320 | 105,865,920 |
| Size | 514.1 MB | 101.0 MB |
| Events in quadrant A | 3,792,145 | 669,263 |
| Events in quadrant B | 3,975,193 | 681,297 |
| Events in quadrant C | 3,872,547 | 656,717 |
| Events in quadrant D | 4,141,510 | 642,889 |
| Mode M9 | |||
|---|---|---|---|
| Quadrant | BADHDUFLAG | Total packets | Discarded packets |
| A | 0 | 6 | 0 |
| B | 0 | 6 | 0 |
| C | 0 | 6 | 0 |
| D | 0 | 6 | 0 |
| Mode M0 | |||
|---|---|---|---|
| Quadrant | BADHDUFLAG | Total packets | Discarded packets |
| A | 0 | 16704 | 2 |
| B | 0 | 17127 | 2 |
| C | 0 | 16847 | 2 |
| D | 0 | 18047 | 2 |
| Mode SS | |||
|---|---|---|---|
| Quadrant | BADHDUFLAG | Total packets | Discarded packets |
| A | 0 | 164 | 0 |
| B | 0 | 164 | 0 |
| C | 0 | 164 | 0 |
| D | 0 | 164 | 0 |
| Quadrant | Total seconds | Saturated seconds | Saturation percentage |
|---|---|---|---|
| A | 7999 | 81 | 1.012627% |
| B | 7999 | 147 | 1.837730% |
| C | 8000 | 164 | 2.050000% |
| D | 8000 | 117 | 1.462500% |
Noise dominated data is calculated using 1-second bins in cleaned event files. If a bin has >2000 counts, and if more than 50% of those come from <1% of pixels, then it is considered to be noise-dominated and hence unusable.
| Quadrant | # 1 sec bins | Bins with >0 counts | Bins with >2000 counts | High rate bins dominated by noise | Noise dominated (total time) | Noise dominated (detector-on time) | Marked lightcurve |
|---|---|---|---|---|---|---|---|
| A | 8634 | 8001 | 0 | 0 | 0.00% | 0.00% | 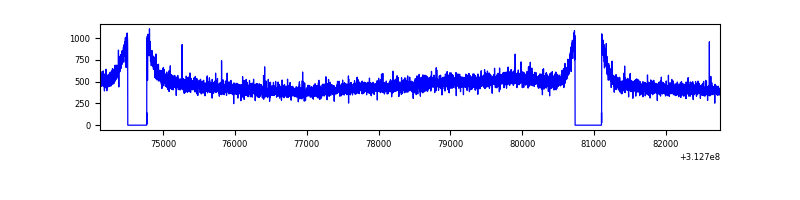 |
| B | 8634 | 8001 | 5 | 5 | 0.06% | 0.06% | 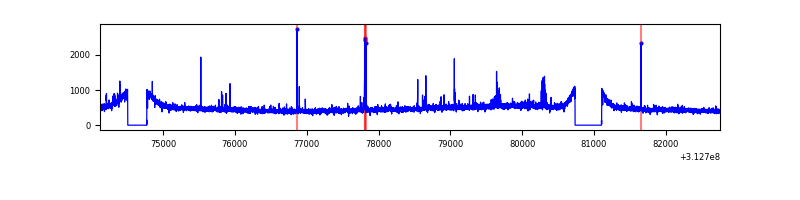 |
| C | 8635 | 8002 | 0 | 0 | 0.00% | 0.00% | 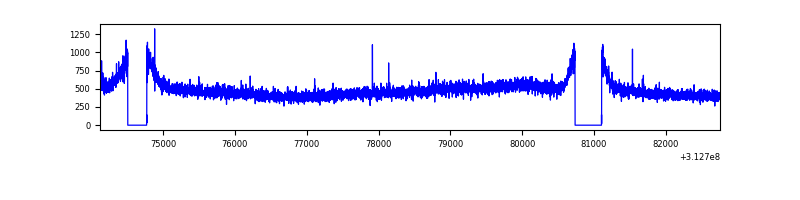 |
| D | 8635 | 8002 | 53 | 53 | 0.61% | 0.66% | 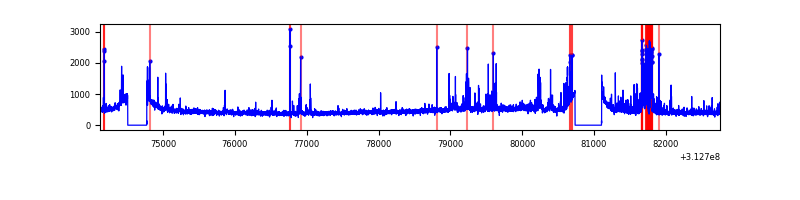 |
Top three noisy pixels from each quadrant. If the there are fewer than three noisy pixels in the level2.evt file, extra rows are filled as -1
| Pixel properties | Quadrant properties | ||||||
|---|---|---|---|---|---|---|---|
| Quadrant | DetID | PixID | Counts | Sigma | Mean | Median | Sigma |
| A | 13 | 254 | 12944 | 59.84 | 983 | 963 | 200.2 |
| A | 3 | 137 | 8682 | 38.55 | 983 | 963 | 200.2 |
| A | 0 | 226 | 8380 | 37.05 | 983 | 963 | 200.2 |
| B | 15 | 33 | 28986 | 146.25 | 987 | 963 | 191.6 |
| B | 5 | 172 | 27670 | 139.38 | 987 | 963 | 191.6 |
| B | 12 | 111 | 23403 | 117.11 | 987 | 963 | 191.6 |
| C | 14 | 238 | 145175 | 639.47 | 948 | 953 | 225.5 |
| C | 0 | 207 | 25177 | 107.41 | 948 | 953 | 225.5 |
| C | 10 | 22 | 7531 | 29.17 | 948 | 953 | 225.5 |
| D | 13 | 174 | 290495 | 1237.61 | 954 | 927 | 234.0 |
| D | 13 | 172 | 103733 | 439.39 | 954 | 927 | 234.0 |
| D | 7 | 223 | 99672 | 422.04 | 954 | 927 | 234.0 |
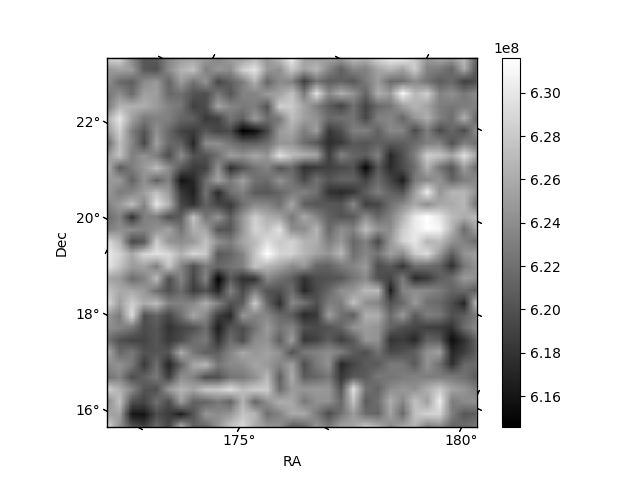
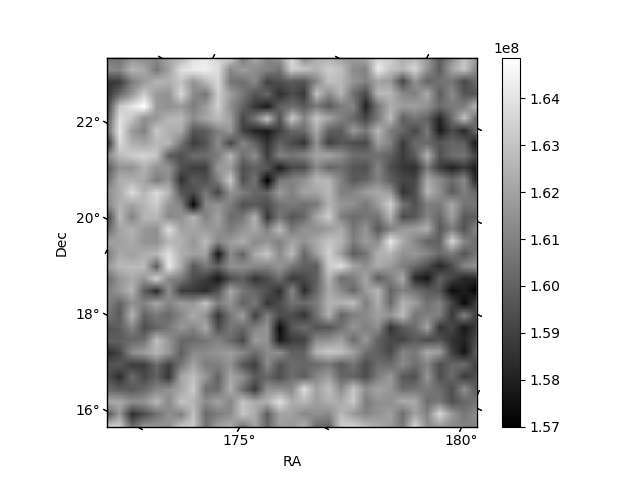
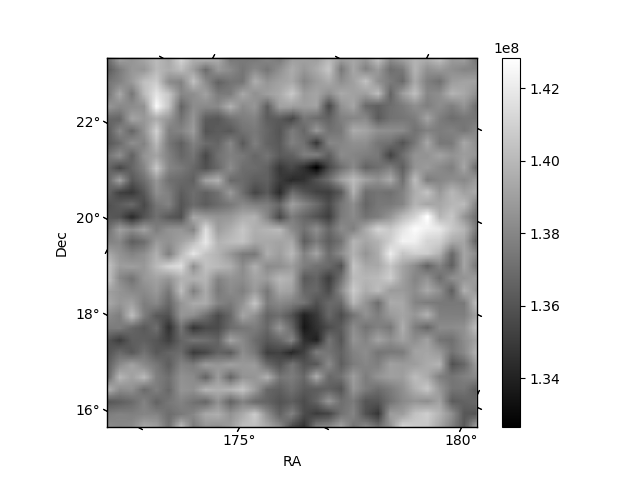
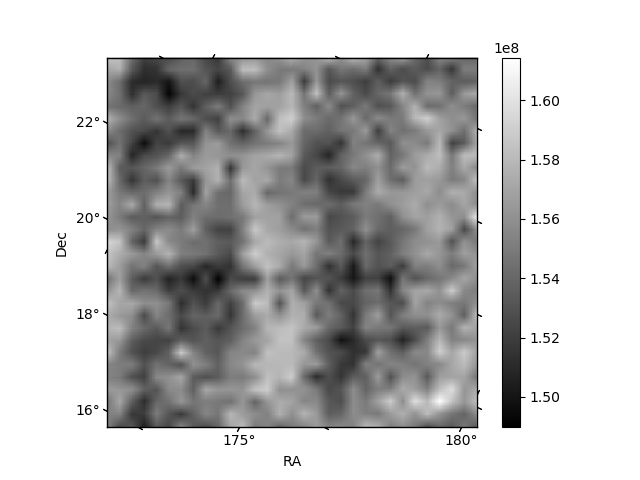
Histogram calculated using DETX and DETY for each event in the final _common_clean file
| Quadrant A | 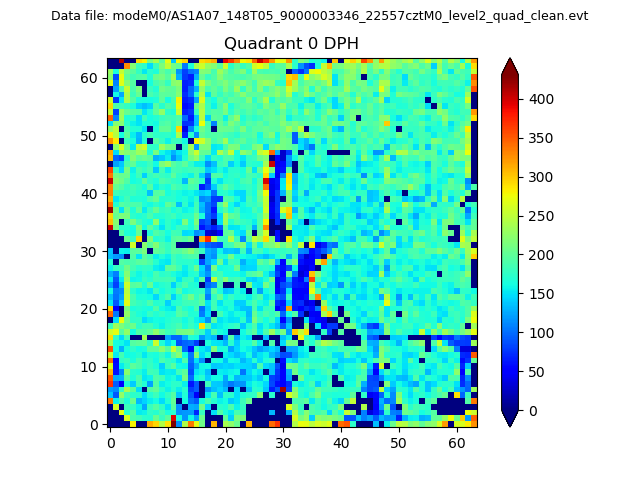 |
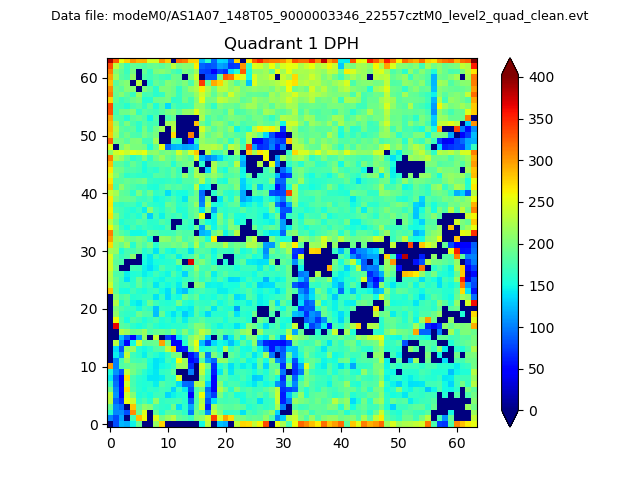 |
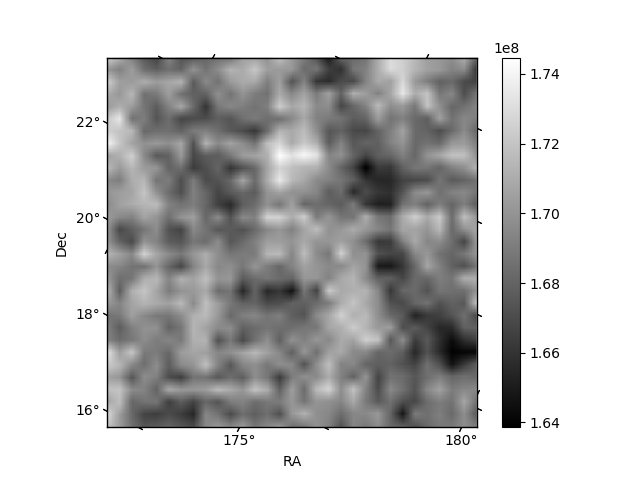
Quadrant B |
|---|---|---|---|
| Quadrant D | 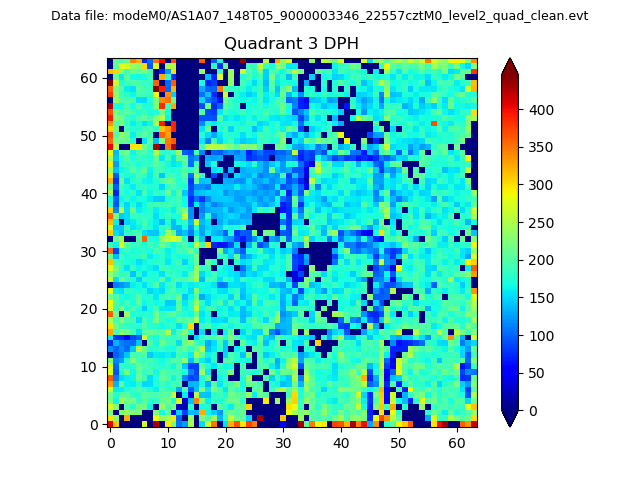 |
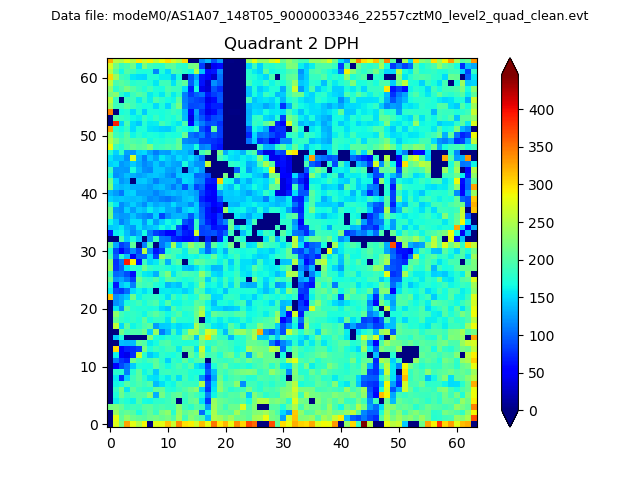 |
Quadrant C |
| Plot type | Count rate plots | Images |
|---|---|---|
| Comparison with Poisson distribution Blue bars denote a histogram of data divided into 1 sec bins. Red curve is a Poisson curve with rate = median count rate of data. |
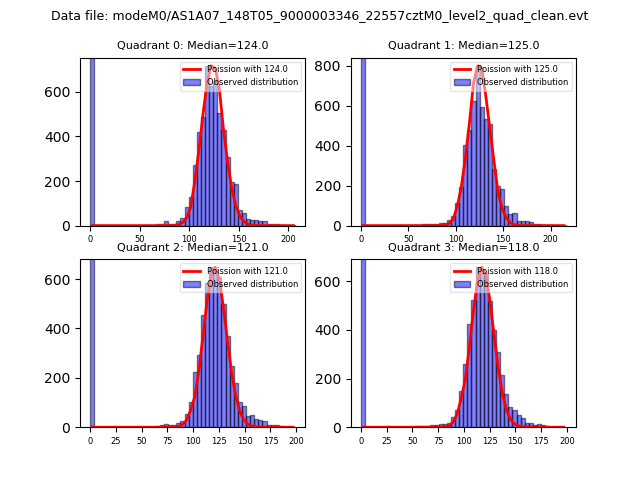 |
 |
| Quadrant-wise count rates Data is divided into 100 sec bins |
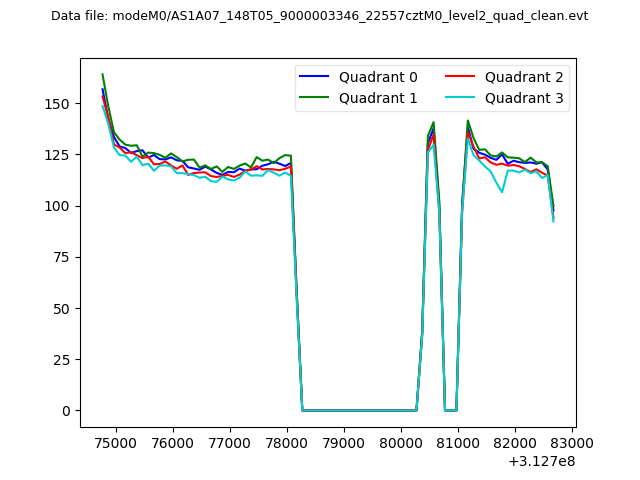 |
|
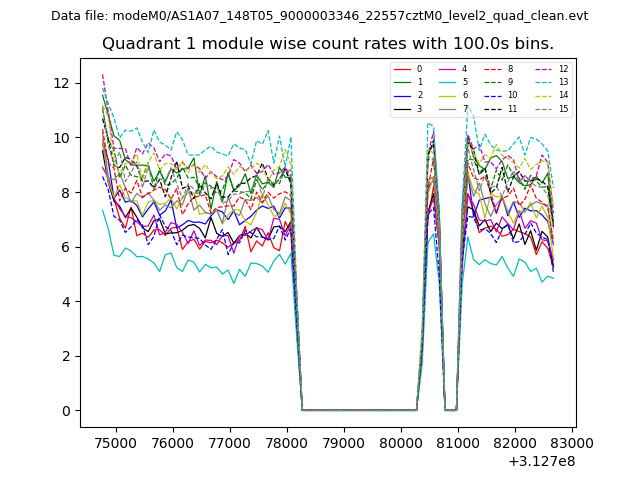
| Module-wise count rates for Quadrant A Data is divided into 100 sec bins |
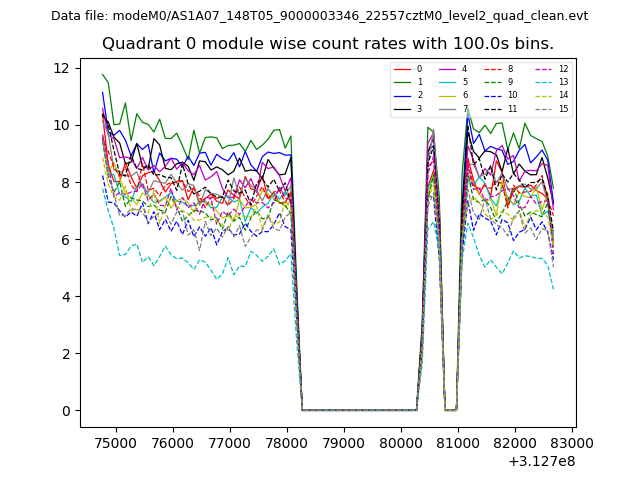 |
 |
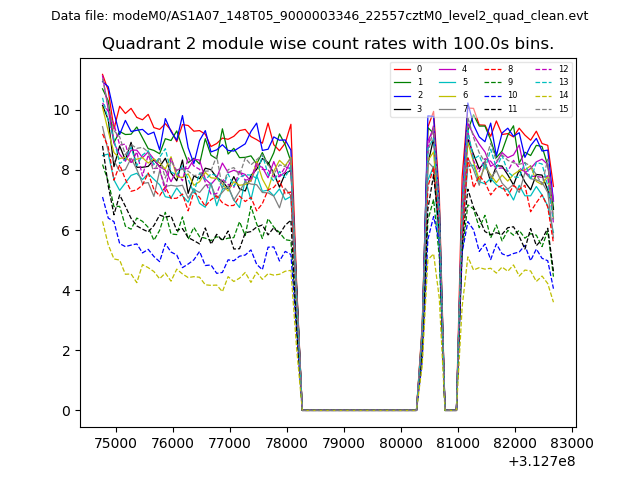
| Module-wise count rates for Quadrant B Data is divided into 100 sec bins |
 |
 |
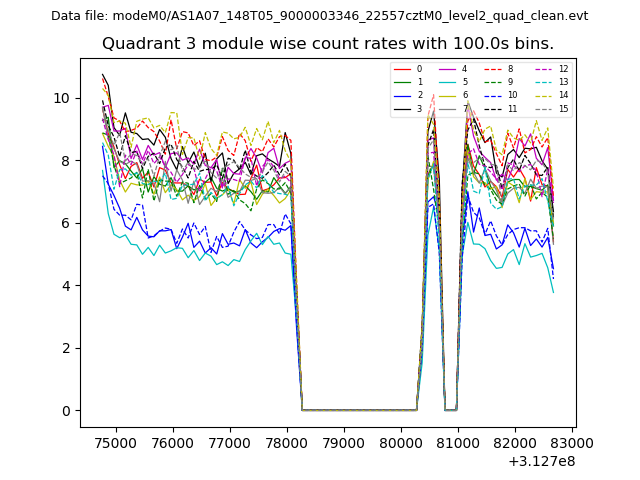
| Module-wise count rates for Quadrant C Data is divided into 100 sec bins |
 |
 |
| Module-wise count rates for Quadrant D Data is divided into 100 sec bins |
 |
 |
| Parameter | Plot |
|---|---|
| CZT HV Monitor | 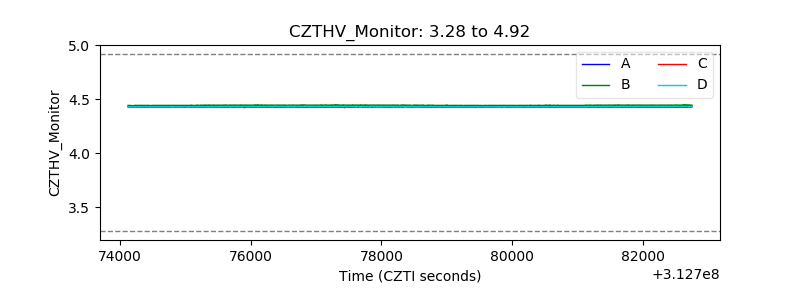 |
| D_VDD | 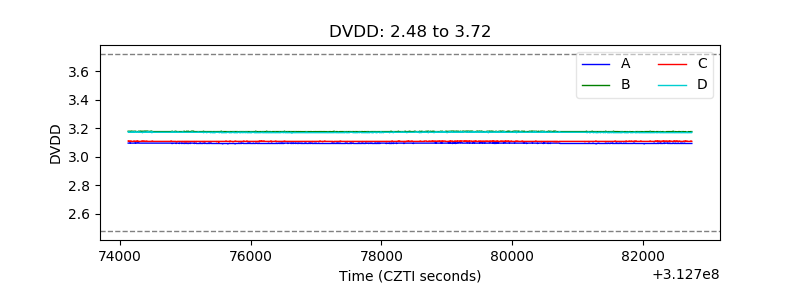 |
| Temperature 1 | 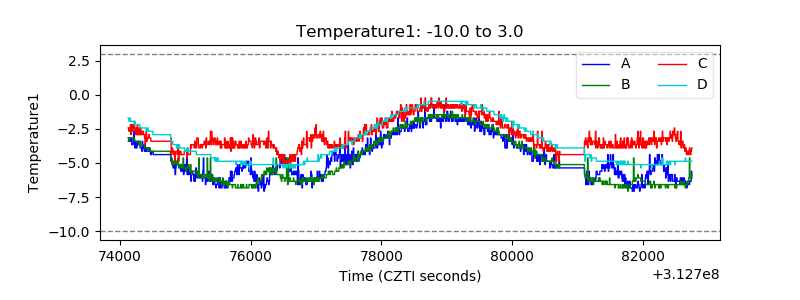 |
| Veto HV Monitor | 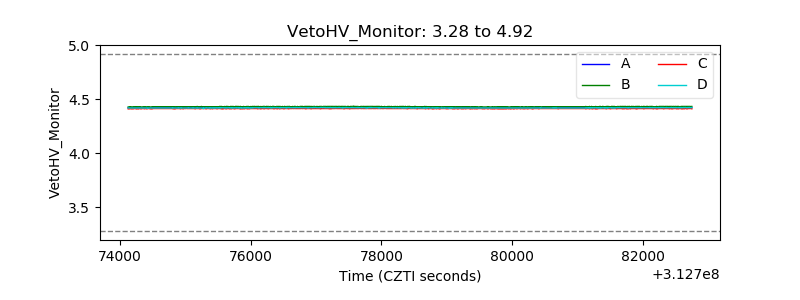 |
| Veto LLD | 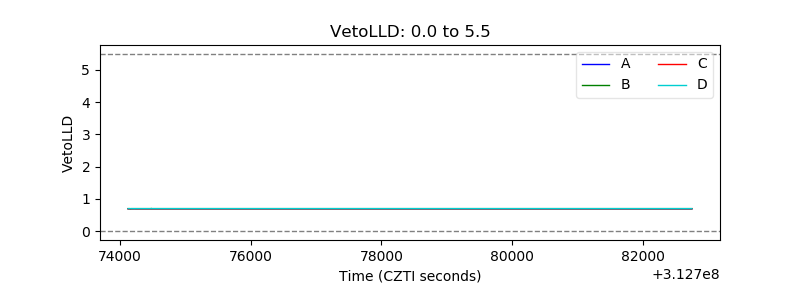 |
| Alpha Counter | 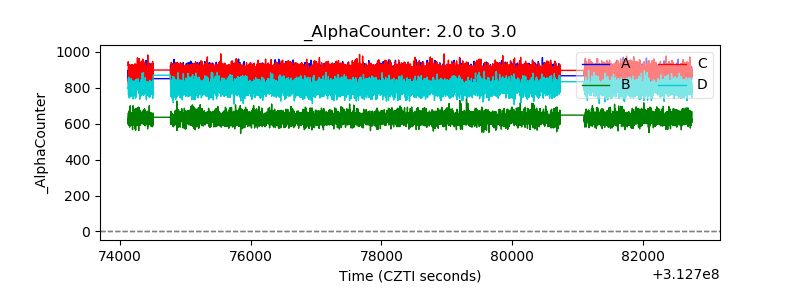 |
| _CPM_Rate | 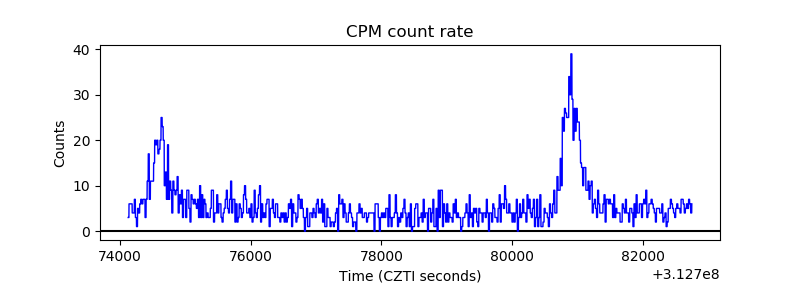 |
| CZT Counter | 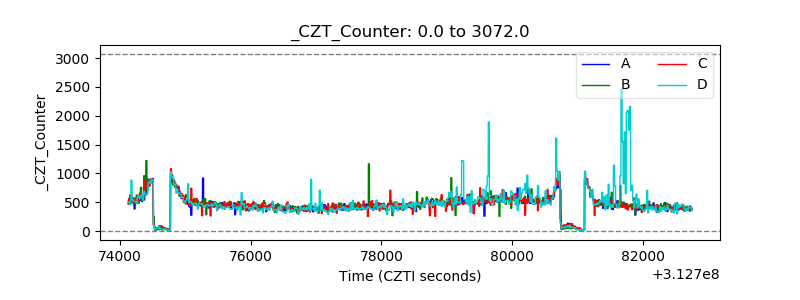 |
| +2.5 Volts monitor | 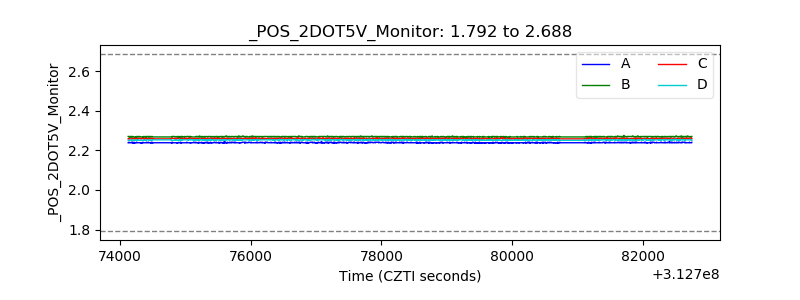 |
| +5 Volts monitor | 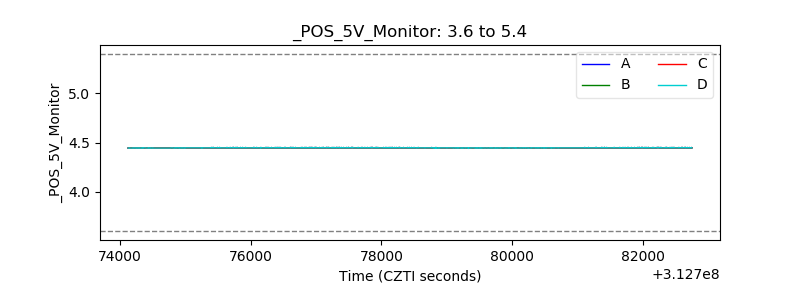 |
| _ROLL_ROT |  |
| _Roll_DEC | 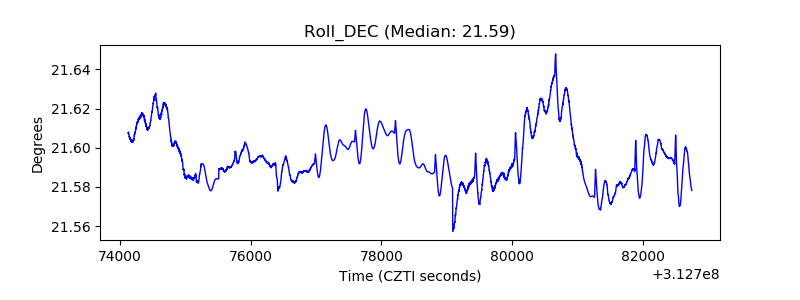 |
| _Roll_RA | 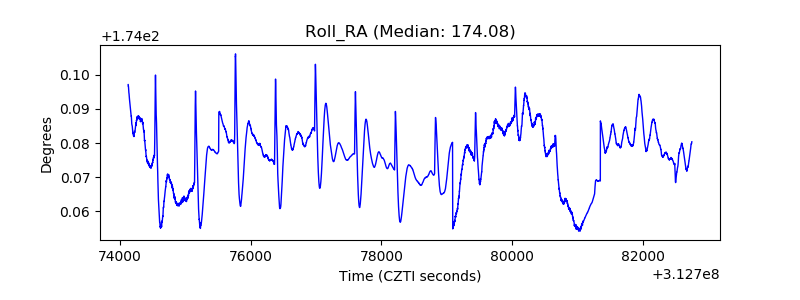 |
| Veto Counter | 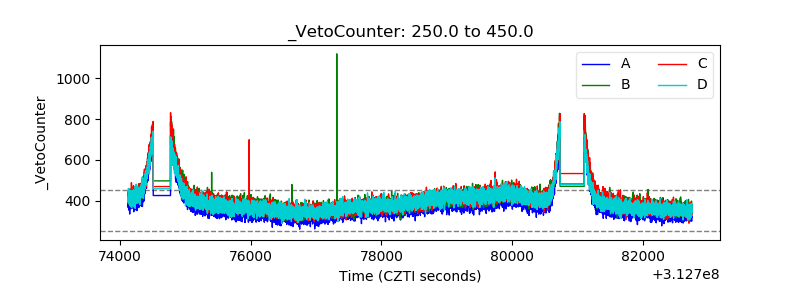 |