| Param | Original file | Final file |
|---|---|---|
| Filename | modeM0/AS1A07_148T05_9000003346_22560cztM0_level2.evt | modeM0/AS1A07_148T05_9000003346_22560cztM0_level2_quad_clean.evt |
| Size (bytes) | 1,189,998,720 | 222,287,040 |
| Size | 1.1 GB | 212.0 MB |
| Events in quadrant A | 8,263,143 | 1,392,458 |
| Events in quadrant B | 8,501,036 | 1,419,392 |
| Events in quadrant C | 8,407,203 | 1,365,284 |
| Events in quadrant D | 9,663,368 | 1,328,060 |
| Mode M9 | |||
|---|---|---|---|
| Quadrant | BADHDUFLAG | Total packets | Discarded packets |
| A | 0 | 21 | 0 |
| B | 0 | 21 | 0 |
| C | 0 | 21 | 0 |
| D | 0 | 21 | 0 |
| Mode M0 | |||
|---|---|---|---|
| Quadrant | BADHDUFLAG | Total packets | Discarded packets |
| A | 0 | 36211 | 3 |
| B | 0 | 36730 | 3 |
| C | 0 | 36499 | 3 |
| D | 0 | 40854 | 3 |
| Mode SS | |||
|---|---|---|---|
| Quadrant | BADHDUFLAG | Total packets | Discarded packets |
| A | 0 | 362 | 0 |
| B | 0 | 362 | 0 |
| C | 0 | 362 | 0 |
| D | 0 | 362 | 0 |
| Quadrant | Total seconds | Saturated seconds | Saturation percentage |
|---|---|---|---|
| A | 17802 | 140 | 0.786428% |
| B | 17803 | 155 | 0.870640% |
| C | 17803 | 246 | 1.381790% |
| D | 17803 | 360 | 2.022131% |
Noise dominated data is calculated using 1-second bins in cleaned event files. If a bin has >2000 counts, and if more than 50% of those come from <1% of pixels, then it is considered to be noise-dominated and hence unusable.
| Quadrant | # 1 sec bins | Bins with >0 counts | Bins with >2000 counts | High rate bins dominated by noise | Noise dominated (total time) | Noise dominated (detector-on time) | Marked lightcurve |
|---|---|---|---|---|---|---|---|
| A | 19832 | 17805 | 0 | 0 | 0.00% | 0.00% | 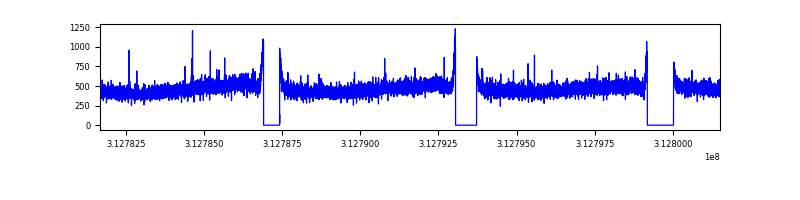 |
| B | 19833 | 17806 | 4 | 4 | 0.02% | 0.02% | 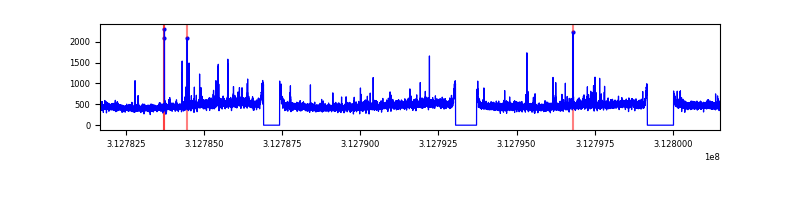 |
| C | 19833 | 17806 | 2 | 2 | 0.01% | 0.01% | 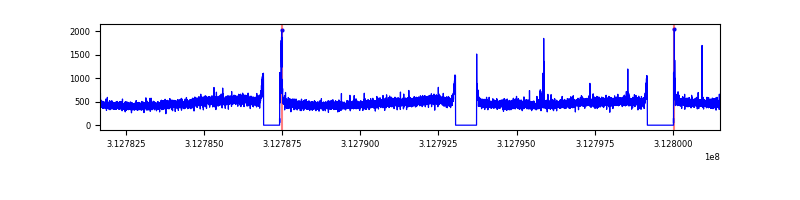 |
| D | 19833 | 17806 | 255 | 255 | 1.29% | 1.43% | 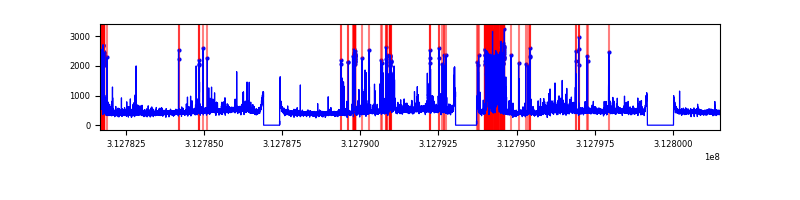 |
Top three noisy pixels from each quadrant. If the there are fewer than three noisy pixels in the level2.evt file, extra rows are filled as -1
| Pixel properties | Quadrant properties | ||||||
|---|---|---|---|---|---|---|---|
| Quadrant | DetID | PixID | Counts | Sigma | Mean | Median | Sigma |
| A | 13 | 254 | 28279 | 61.04 | 2138 | 2091 | 429.0 |
| A | 13 | 34 | 21472 | 45.17 | 2138 | 2091 | 429.0 |
| A | 3 | 137 | 18699 | 38.71 | 2138 | 2091 | 429.0 |
| B | 15 | 33 | 60735 | 144.74 | 2128 | 2080 | 405.2 |
| B | 12 | 111 | 50253 | 118.87 | 2128 | 2080 | 405.2 |
| B | 11 | 111 | 44443 | 104.54 | 2128 | 2080 | 405.2 |
| C | 14 | 238 | 320599 | 663.64 | 2051 | 2063 | 480.0 |
| C | 10 | 22 | 76107 | 154.26 | 2051 | 2063 | 480.0 |
| C | 13 | 61 | 14356 | 25.61 | 2051 | 2063 | 480.0 |
| D | 1 | 52 | 1266696 | 2488.91 | 2075 | 2012 | 508.1 |
| D | 13 | 172 | 209173 | 407.69 | 2075 | 2012 | 508.1 |
| D | 13 | 174 | 160925 | 312.74 | 2075 | 2012 | 508.1 |
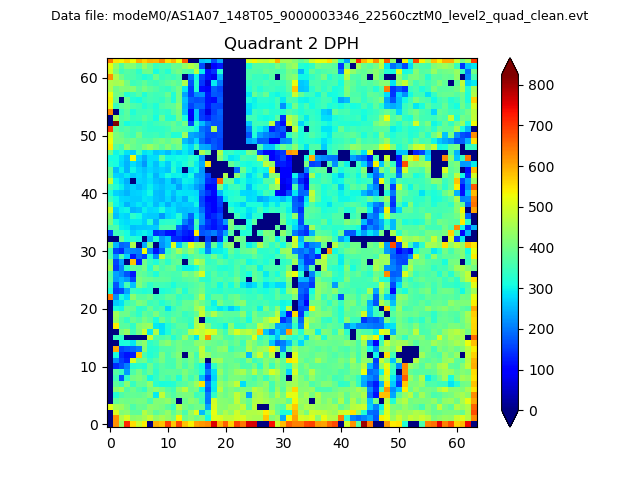
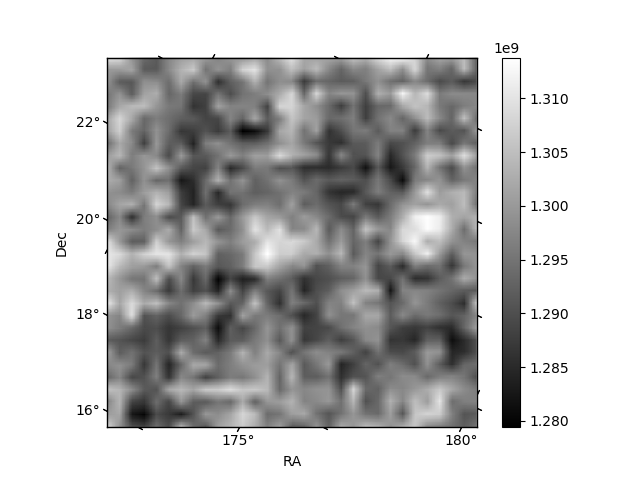
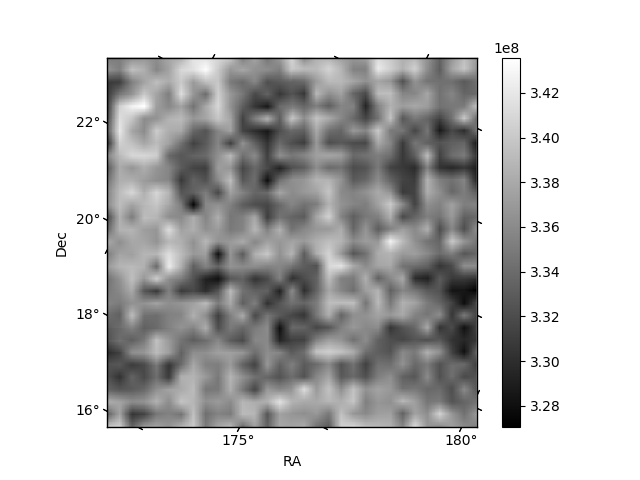
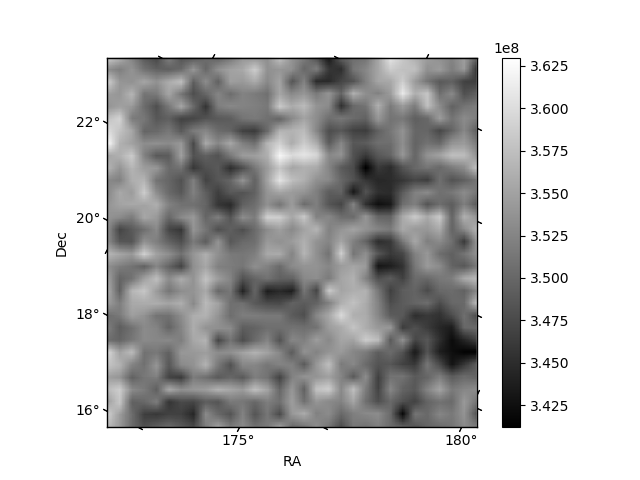
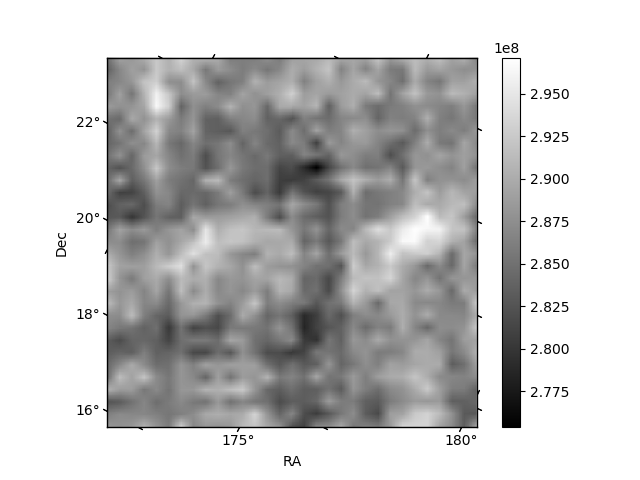
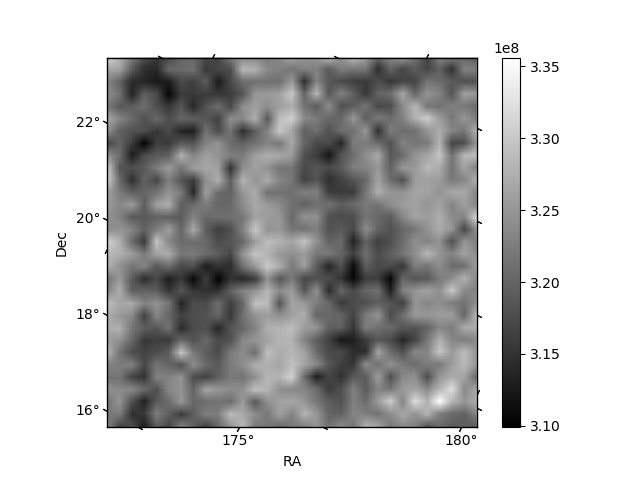
Histogram calculated using DETX and DETY for each event in the final _common_clean file
| Quadrant A | 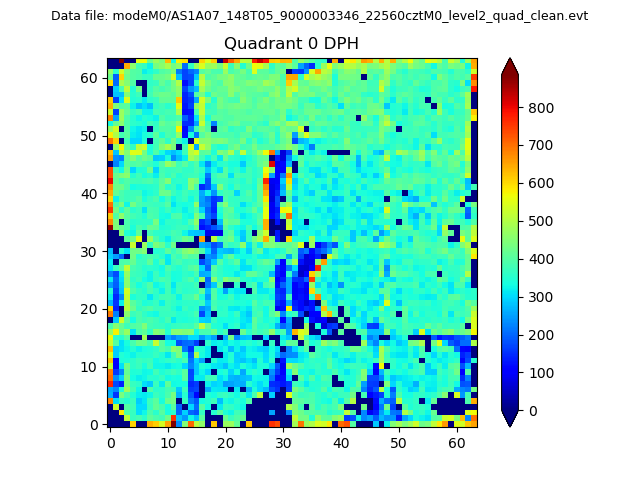 |
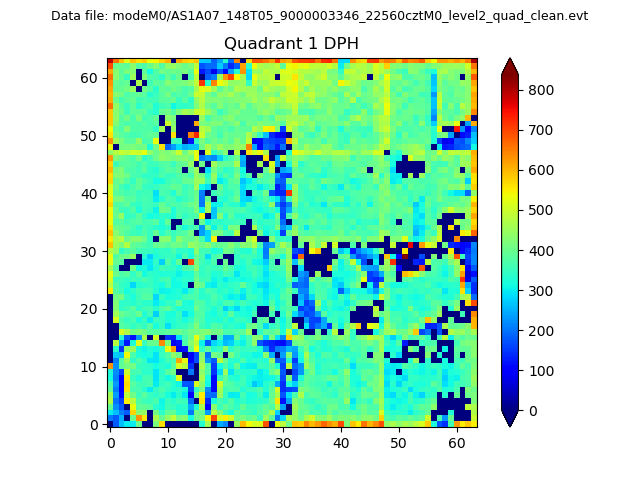 |
Quadrant B |
|---|---|---|---|
| Quadrant D | 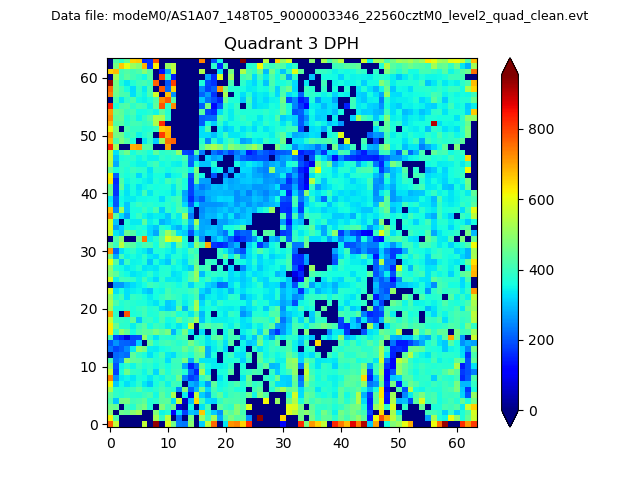 |
 |
Quadrant C |
| Plot type | Count rate plots | Images |
|---|---|---|
| Comparison with Poisson distribution Blue bars denote a histogram of data divided into 1 sec bins. Red curve is a Poisson curve with rate = median count rate of data. |
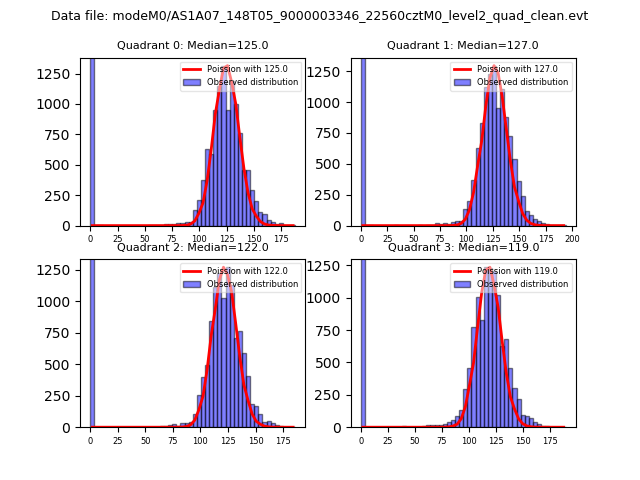 |
 |
| Quadrant-wise count rates Data is divided into 100 sec bins |
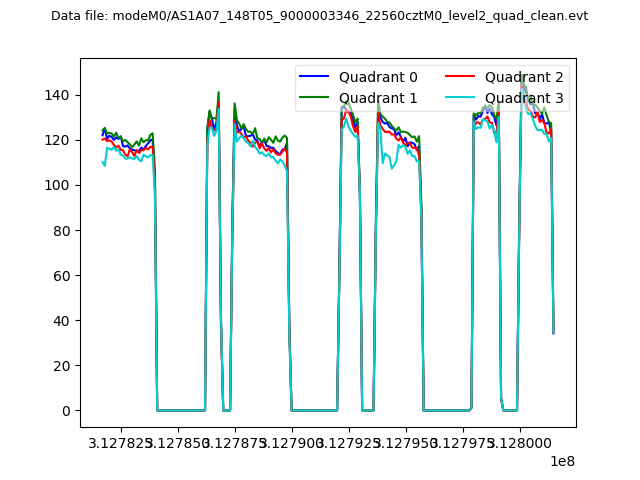 |
|
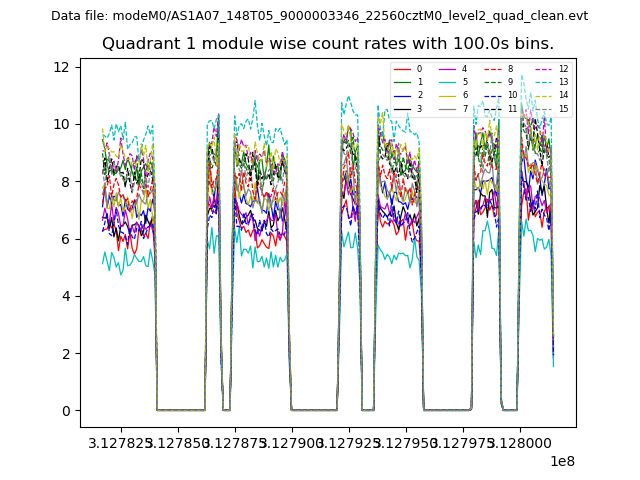
| Module-wise count rates for Quadrant A Data is divided into 100 sec bins |
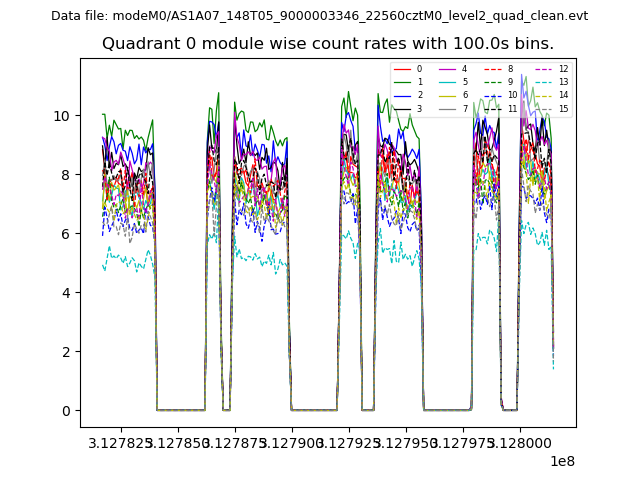 |
 |
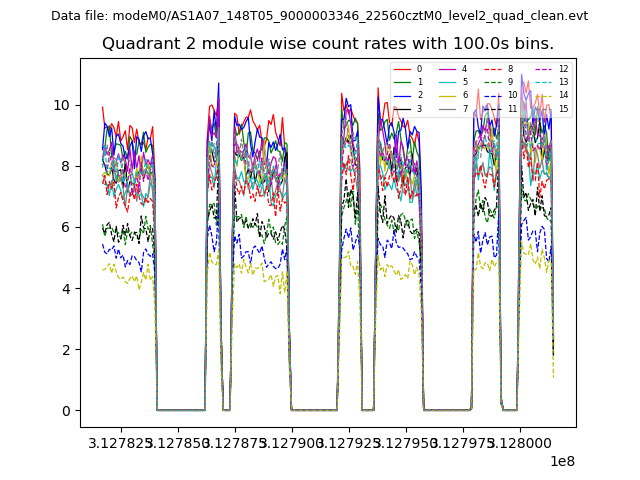
| Module-wise count rates for Quadrant B Data is divided into 100 sec bins |
 |
 |
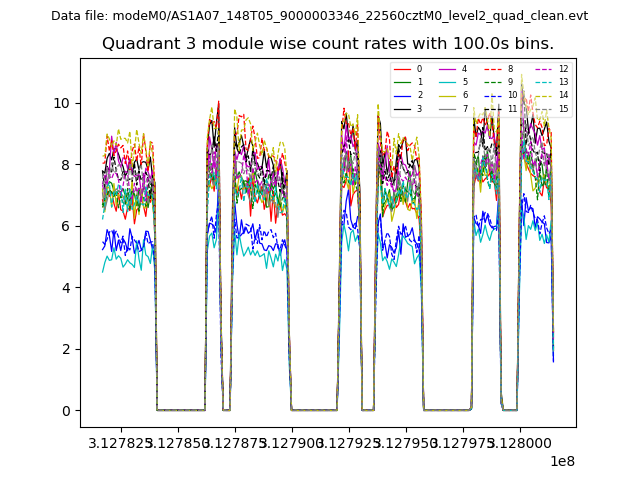
| Module-wise count rates for Quadrant C Data is divided into 100 sec bins |
 |
 |
| Module-wise count rates for Quadrant D Data is divided into 100 sec bins |
 |
 |
| Parameter | Plot |
|---|---|
| CZT HV Monitor | 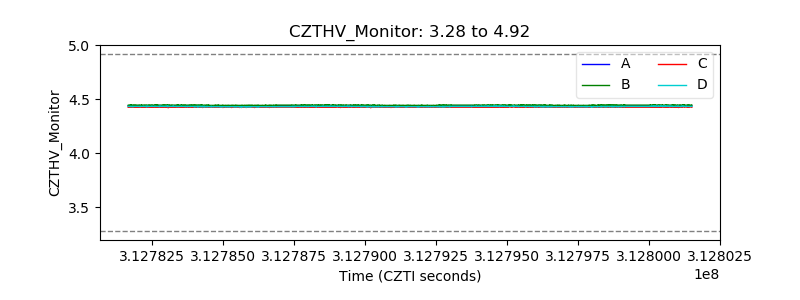 |
| D_VDD | 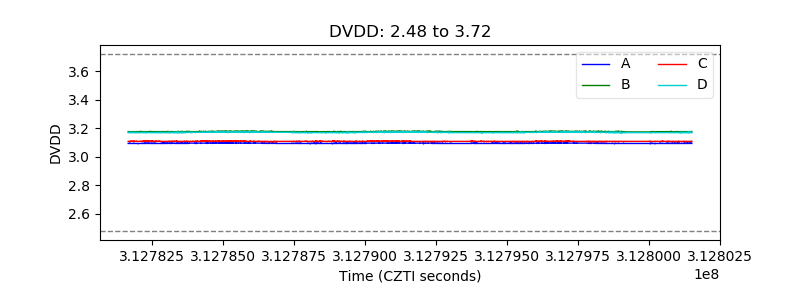 |
| Temperature 1 | 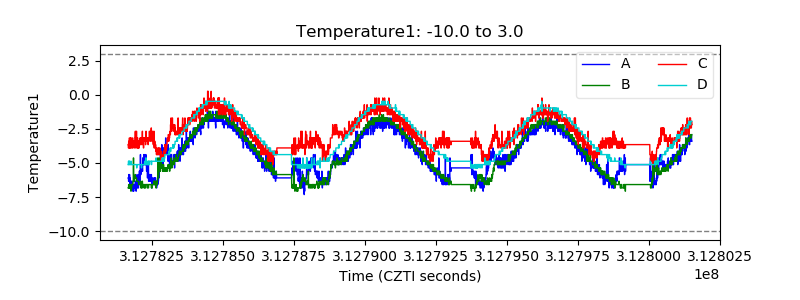 |
| Veto HV Monitor | 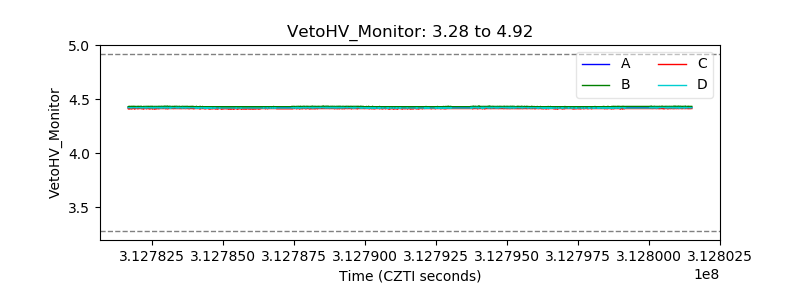 |
| Veto LLD | 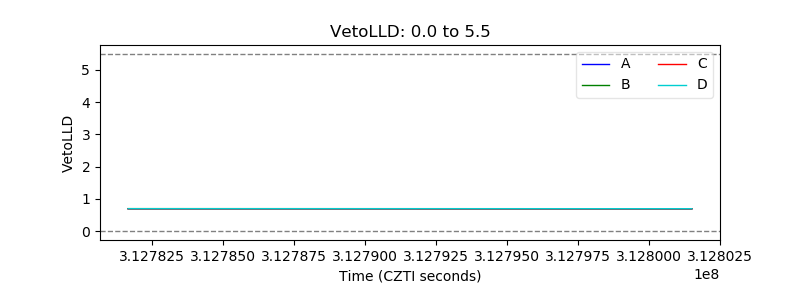 |
| Alpha Counter | 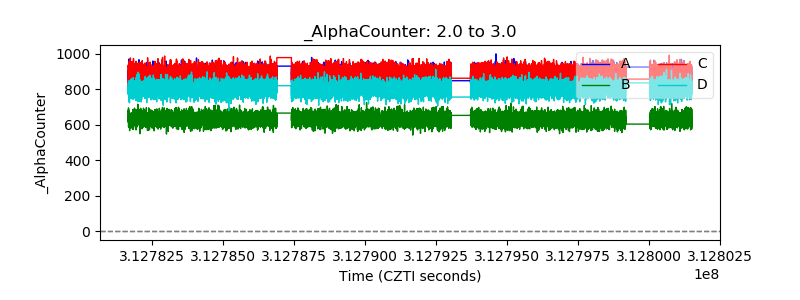 |
| _CPM_Rate | 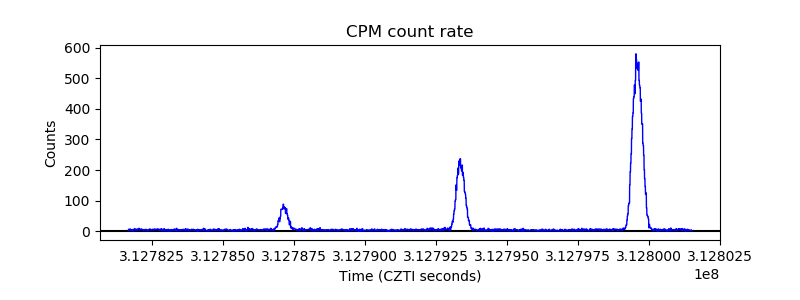 |
| CZT Counter | 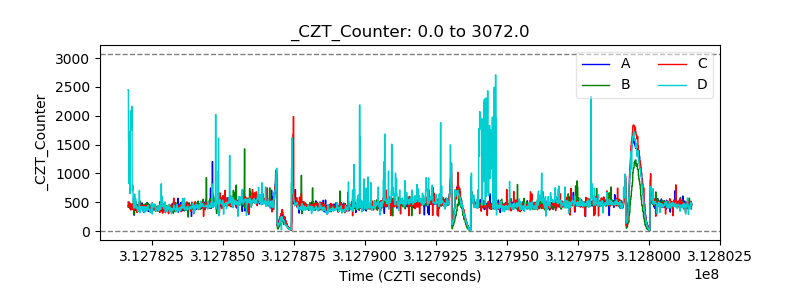 |
| +2.5 Volts monitor |  |
| +5 Volts monitor | 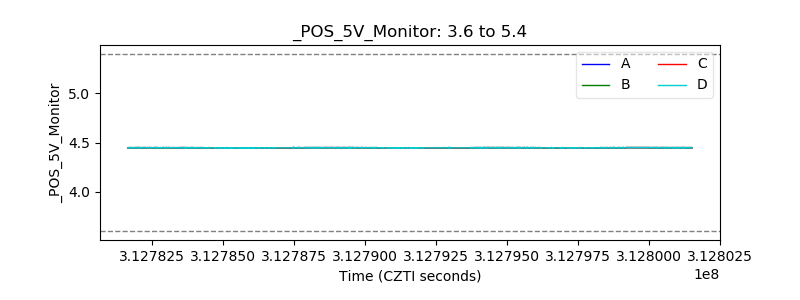 |
| _ROLL_ROT | 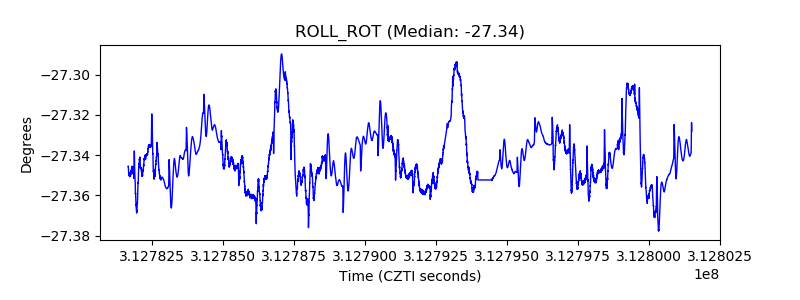 |
| _Roll_DEC | 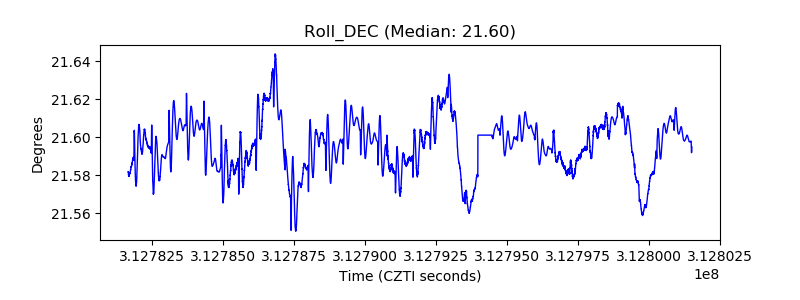 |
| _Roll_RA | 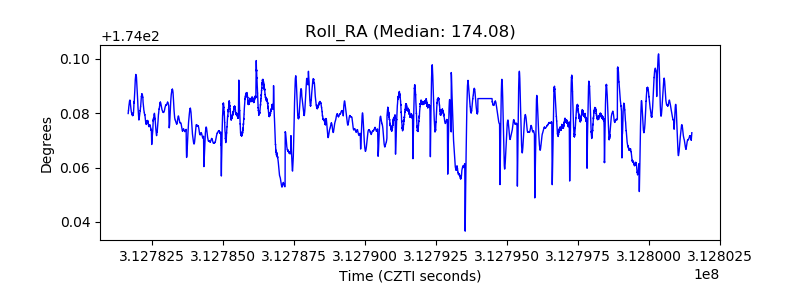 |
| Veto Counter | 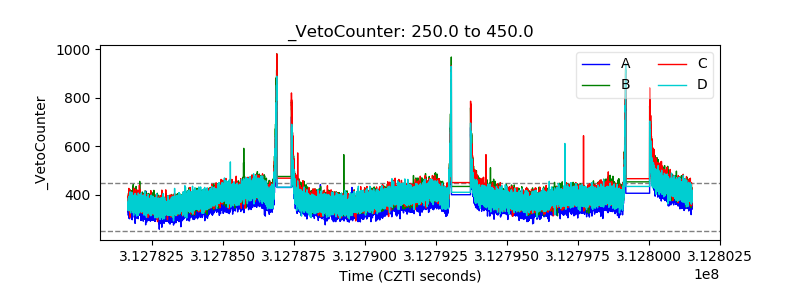 |