| Param | Original file | Final file |
|---|---|---|
| Filename | modeM0/AS1A07_148T05_9000003346_22561cztM0_level2.evt | modeM0/AS1A07_148T05_9000003346_22561cztM0_level2_quad_clean.evt |
| Size (bytes) | 418,104,000 | 82,995,840 |
| Size | 398.7 MB | 79.2 MB |
| Events in quadrant A | 2,960,054 | 525,603 |
| Events in quadrant B | 3,137,725 | 536,929 |
| Events in quadrant C | 3,012,985 | 515,545 |
| Events in quadrant D | 3,130,553 | 503,081 |
| Mode M9 | |||
|---|---|---|---|
| Quadrant | BADHDUFLAG | Total packets | Discarded packets |
| A | 0 | 10 | 0 |
| B | 0 | 10 | 0 |
| C | 0 | 10 | 0 |
| D | 0 | 10 | 0 |
| Mode M0 | |||
|---|---|---|---|
| Quadrant | BADHDUFLAG | Total packets | Discarded packets |
| A | 0 | 12611 | 1 |
| B | 0 | 13051 | 1 |
| C | 0 | 12683 | 1 |
| D | 0 | 13385 | 1 |
| Mode SS | |||
|---|---|---|---|
| Quadrant | BADHDUFLAG | Total packets | Discarded packets |
| A | 0 | 126 | 0 |
| B | 0 | 126 | 0 |
| C | 0 | 126 | 0 |
| D | 0 | 126 | 0 |
| Quadrant | Total seconds | Saturated seconds | Saturation percentage |
|---|---|---|---|
| A | 6188 | 43 | 0.694893% |
| B | 6189 | 58 | 0.937147% |
| C | 6189 | 64 | 1.034093% |
| D | 6189 | 104 | 1.680401% |
Noise dominated data is calculated using 1-second bins in cleaned event files. If a bin has >2000 counts, and if more than 50% of those come from <1% of pixels, then it is considered to be noise-dominated and hence unusable.
| Quadrant | # 1 sec bins | Bins with >0 counts | Bins with >2000 counts | High rate bins dominated by noise | Noise dominated (total time) | Noise dominated (detector-on time) | Marked lightcurve |
|---|---|---|---|---|---|---|---|
| A | 7193 | 6189 | 0 | 0 | 0.00% | 0.00% | 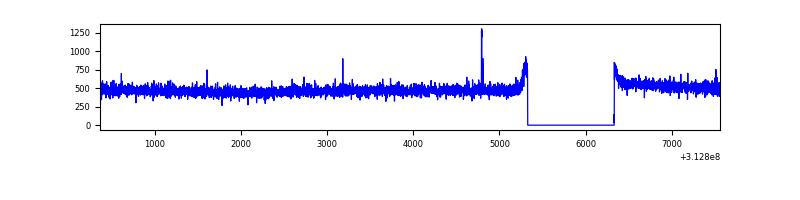 |
| B | 7194 | 6190 | 10 | 10 | 0.14% | 0.16% | 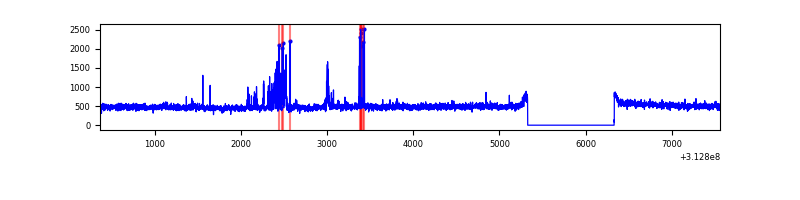 |
| C | 7194 | 6190 | 1 | 1 | 0.01% | 0.02% | 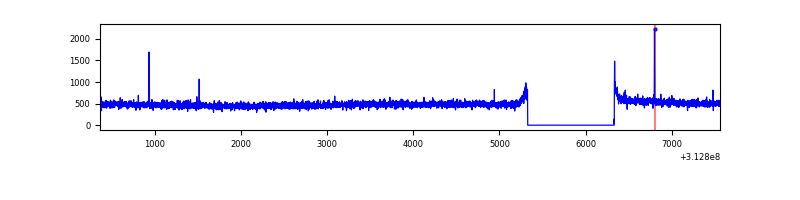 |
| D | 7194 | 6190 | 51 | 51 | 0.71% | 0.82% | 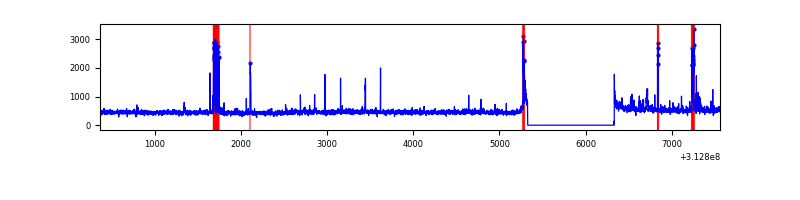 |
Top three noisy pixels from each quadrant. If the there are fewer than three noisy pixels in the level2.evt file, extra rows are filled as -1
| Pixel properties | Quadrant properties | ||||||
|---|---|---|---|---|---|---|---|
| Quadrant | DetID | PixID | Counts | Sigma | Mean | Median | Sigma |
| A | 13 | 254 | 10111 | 60.71 | 766 | 752 | 154.2 |
| A | 0 | 226 | 6714 | 38.67 | 766 | 752 | 154.2 |
| A | 3 | 137 | 6532 | 37.49 | 766 | 752 | 154.2 |
| B | 15 | 33 | 135444 | 918.05 | 760 | 739 | 146.7 |
| B | 12 | 111 | 17548 | 114.56 | 760 | 739 | 146.7 |
| B | 0 | 190 | 15817 | 102.76 | 760 | 739 | 146.7 |
| C | 14 | 238 | 115697 | 661.76 | 738 | 744 | 173.7 |
| C | 10 | 22 | 15835 | 86.88 | 738 | 744 | 173.7 |
| C | 13 | 61 | 5051 | 24.79 | 738 | 744 | 173.7 |
| D | 1 | 52 | 291562 | 1596.95 | 746 | 725 | 182.1 |
| D | 2 | 234 | 24717 | 131.74 | 746 | 725 | 182.1 |
| D | 7 | 223 | 9685 | 49.2 | 746 | 725 | 182.1 |
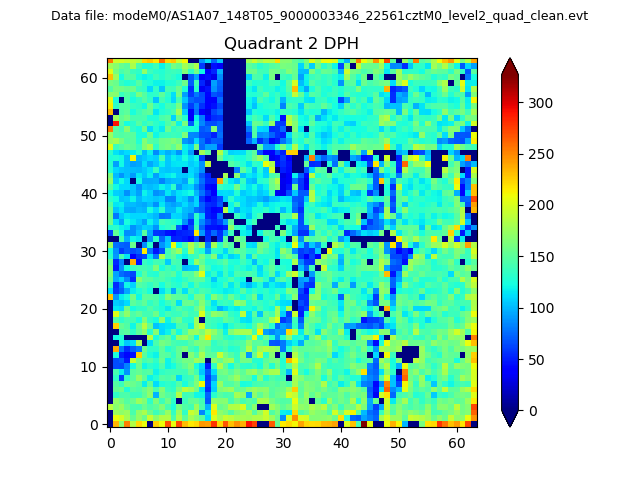
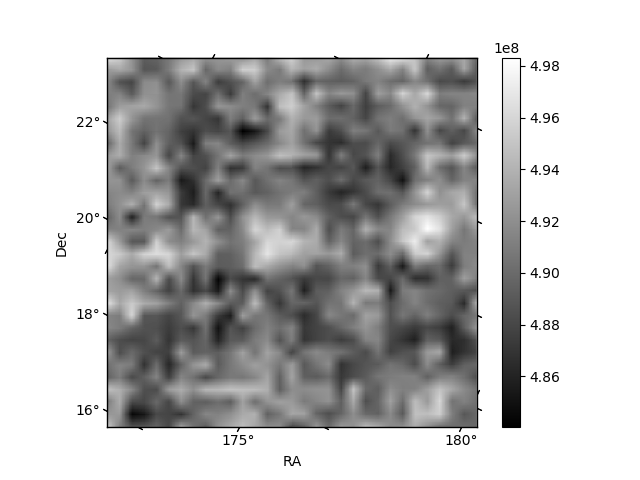
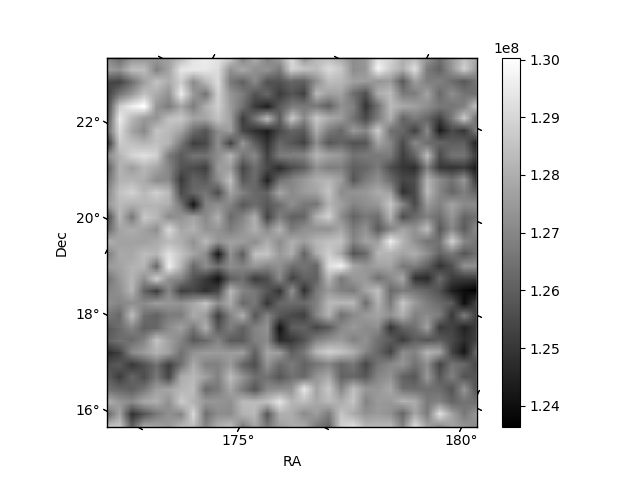
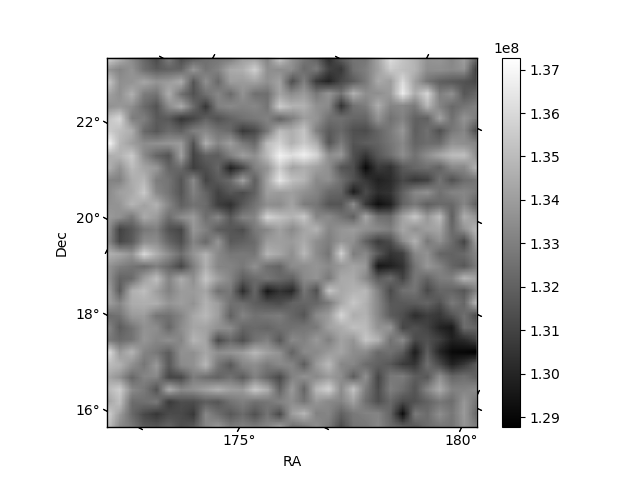
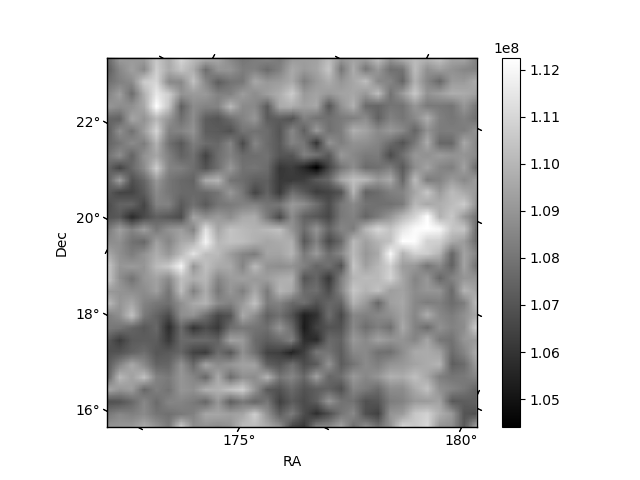
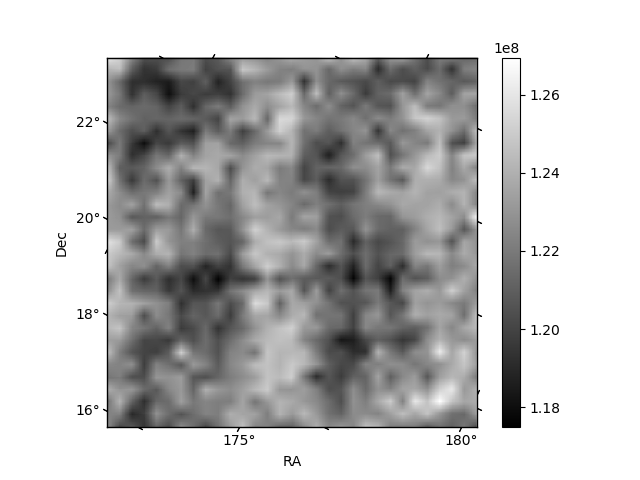
Histogram calculated using DETX and DETY for each event in the final _common_clean file
| Quadrant A | 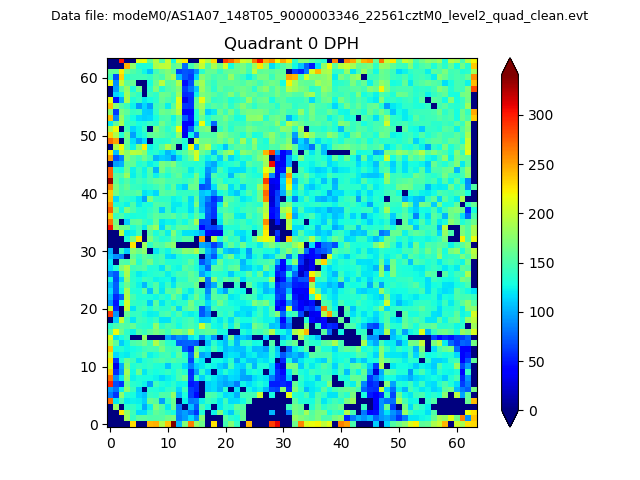 |
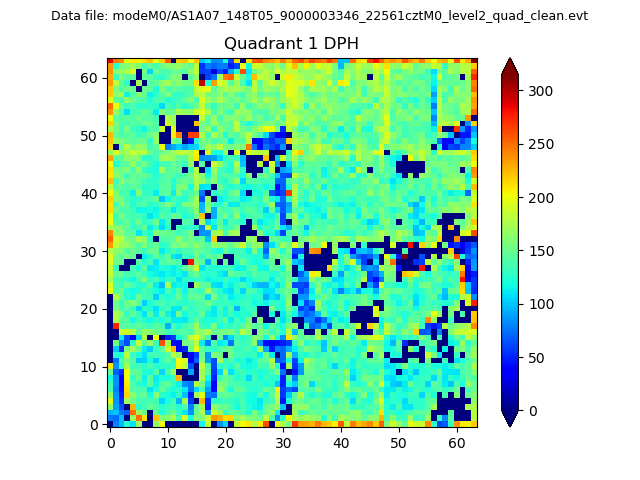 |
Quadrant B |
|---|---|---|---|
| Quadrant D | 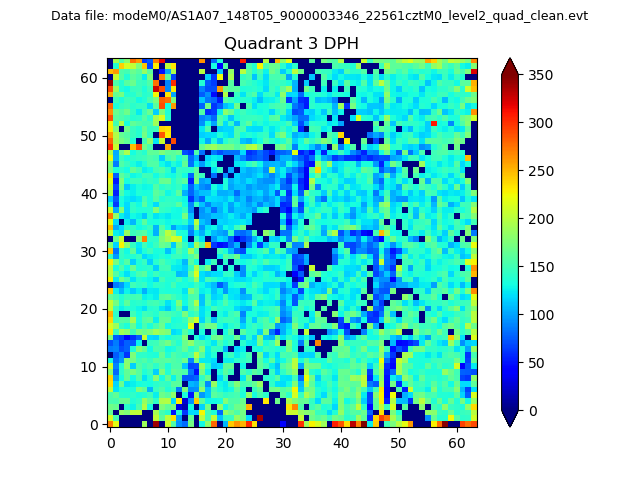 |
 |
Quadrant C |
| Plot type | Count rate plots | Images |
|---|---|---|
| Comparison with Poisson distribution Blue bars denote a histogram of data divided into 1 sec bins. Red curve is a Poisson curve with rate = median count rate of data. |
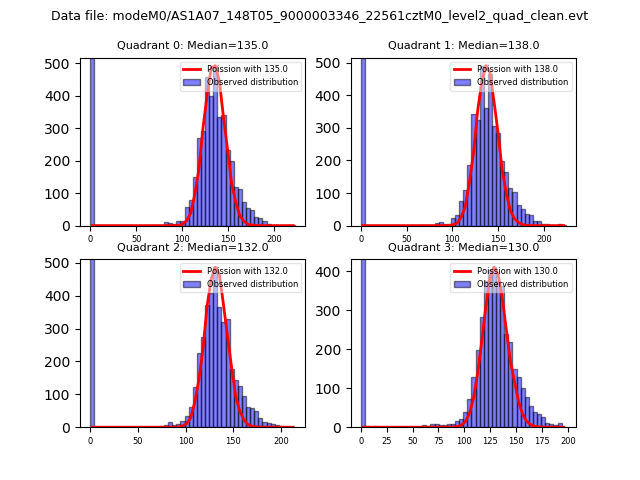 |
 |
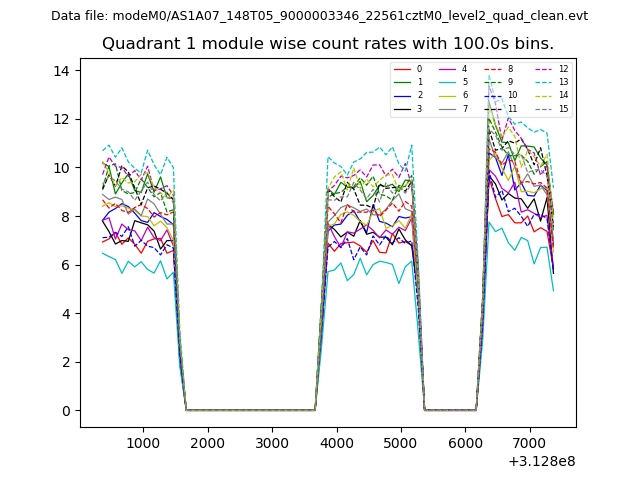
| Quadrant-wise count rates Data is divided into 100 sec bins |
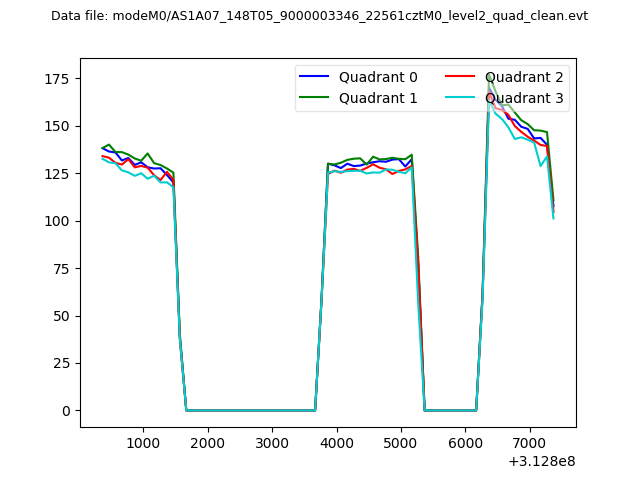 |
|
| Module-wise count rates for Quadrant A Data is divided into 100 sec bins |
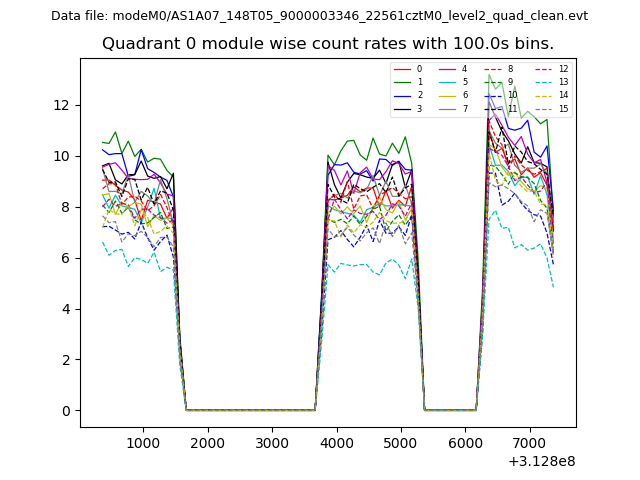 |
 |
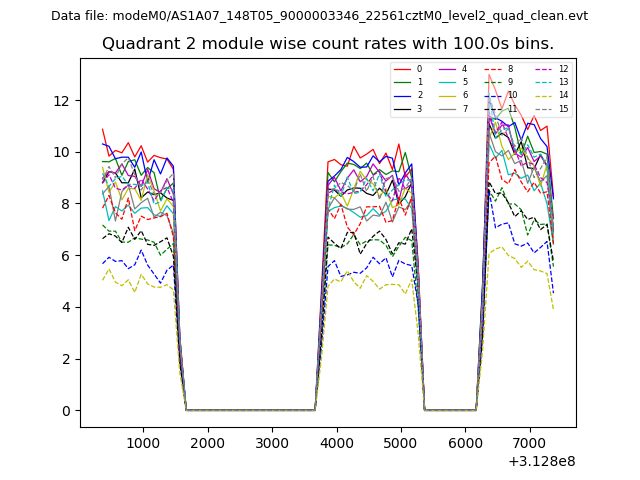
| Module-wise count rates for Quadrant B Data is divided into 100 sec bins |
 |
 |
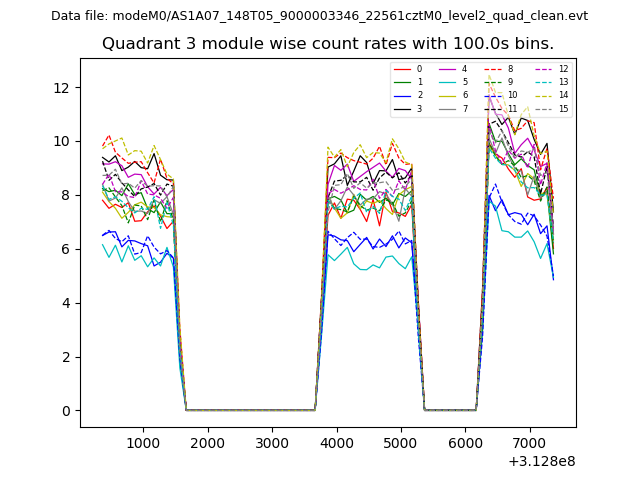
| Module-wise count rates for Quadrant C Data is divided into 100 sec bins |
 |
 |
| Module-wise count rates for Quadrant D Data is divided into 100 sec bins |
 |
 |
| Parameter | Plot |
|---|---|
| CZT HV Monitor | 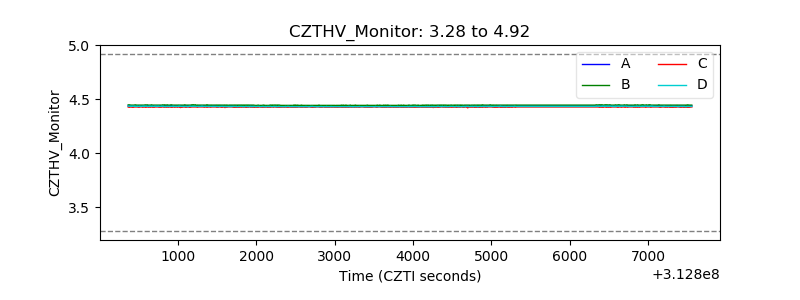 |
| D_VDD | 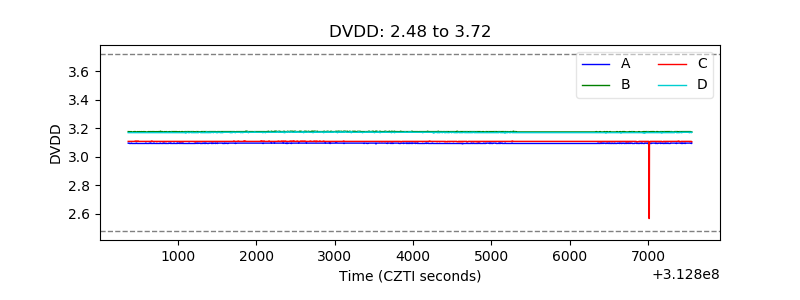 |
| Temperature 1 | 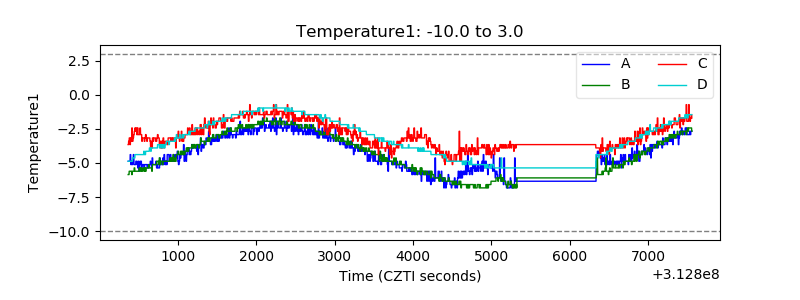 |
| Veto HV Monitor | 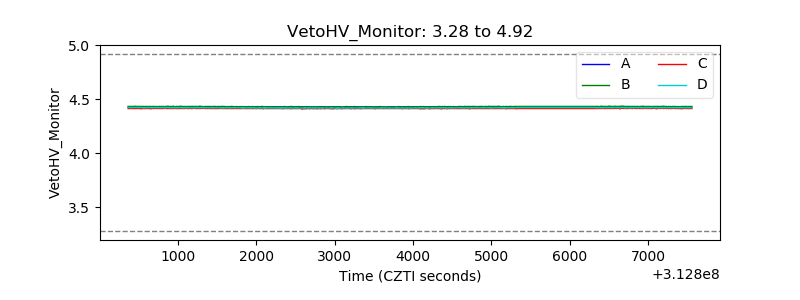 |
| Veto LLD | 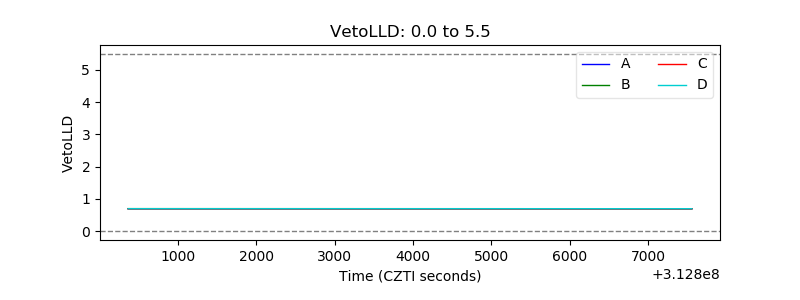 |
| Alpha Counter | 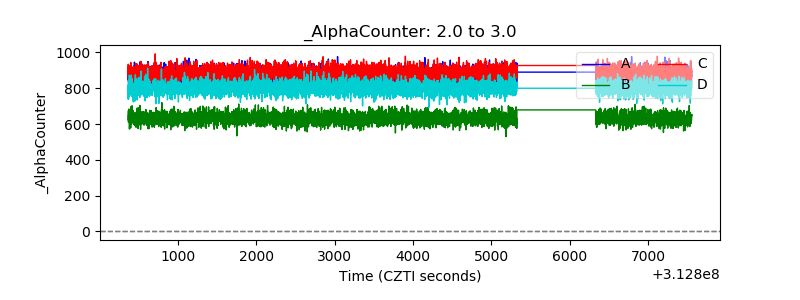 |
| _CPM_Rate | 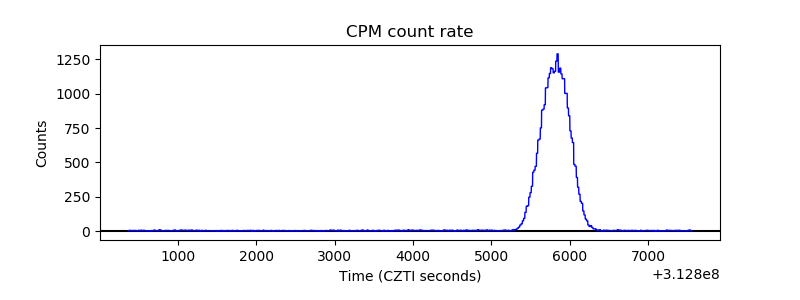 |
| CZT Counter | 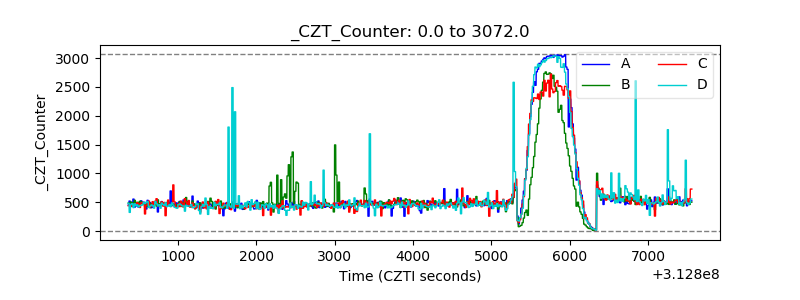 |
| +2.5 Volts monitor |  |
| +5 Volts monitor |  |
| _ROLL_ROT | 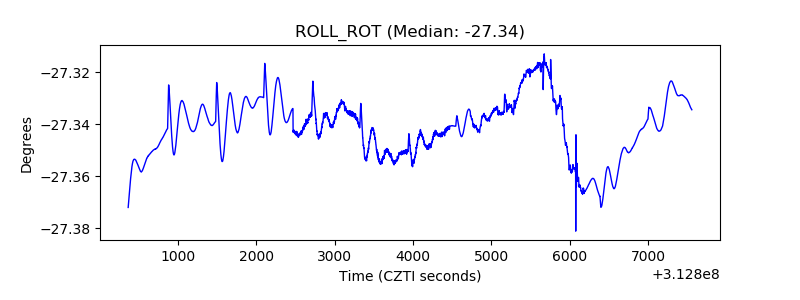 |
| _Roll_DEC | 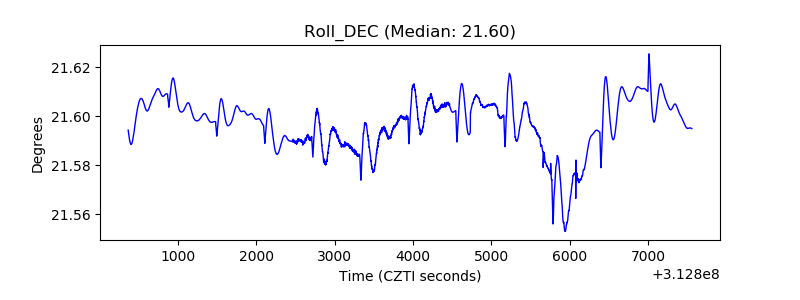 |
| _Roll_RA | 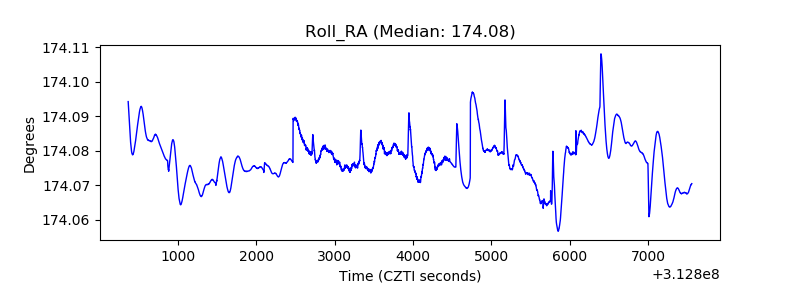 |
| Veto Counter | 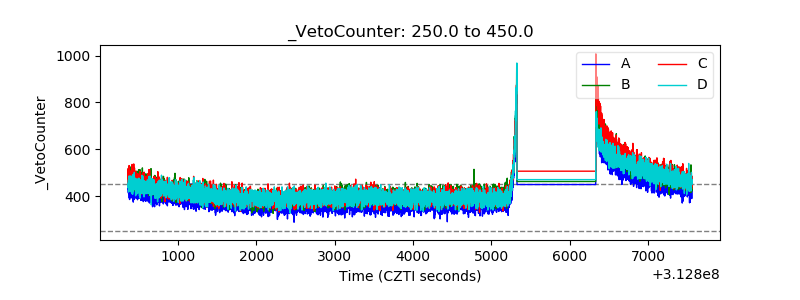 |