| Param | Original file | Final file |
|---|---|---|
| Filename | modeM0/AS1A07_148T05_9000003346_22564cztM0_level2.evt | modeM0/AS1A07_148T05_9000003346_22564cztM0_level2_quad_clean.evt |
| Size (bytes) | 503,055,360 | 77,345,280 |
| Size | 479.8 MB | 73.8 MB |
| Events in quadrant A | 3,416,939 | 477,714 |
| Events in quadrant B | 3,514,991 | 487,739 |
| Events in quadrant C | 3,510,826 | 469,611 |
| Events in quadrant D | 4,360,187 | 462,546 |
| Mode M9 | |||
|---|---|---|---|
| Quadrant | BADHDUFLAG | Total packets | Discarded packets |
| A | 0 | 17 | 0 |
| B | 0 | 18 | 0 |
| C | 0 | 18 | 0 |
| D | 0 | 18 | 0 |
| Mode M0 | |||
|---|---|---|---|
| Quadrant | BADHDUFLAG | Total packets | Discarded packets |
| A | 0 | 14234 | 2 |
| B | 0 | 14454 | 2 |
| C | 0 | 14446 | 2 |
| D | 0 | 17335 | 2 |
| Mode SS | |||
|---|---|---|---|
| Quadrant | BADHDUFLAG | Total packets | Discarded packets |
| A | 0 | 128 | 0 |
| B | 0 | 128 | 0 |
| C | 0 | 128 | 0 |
| D | 0 | 128 | 0 |
| Quadrant | Total seconds | Saturated seconds | Saturation percentage |
|---|---|---|---|
| A | 6374 | 104 | 1.631628% |
| B | 6374 | 109 | 1.710072% |
| C | 6374 | 142 | 2.227800% |
| D | 6374 | 237 | 3.718230% |
Noise dominated data is calculated using 1-second bins in cleaned event files. If a bin has >2000 counts, and if more than 50% of those come from <1% of pixels, then it is considered to be noise-dominated and hence unusable.
| Quadrant | # 1 sec bins | Bins with >0 counts | Bins with >2000 counts | High rate bins dominated by noise | Noise dominated (total time) | Noise dominated (detector-on time) | Marked lightcurve |
|---|---|---|---|---|---|---|---|
| A | 7574 | 6375 | 0 | 0 | 0.00% | 0.00% | 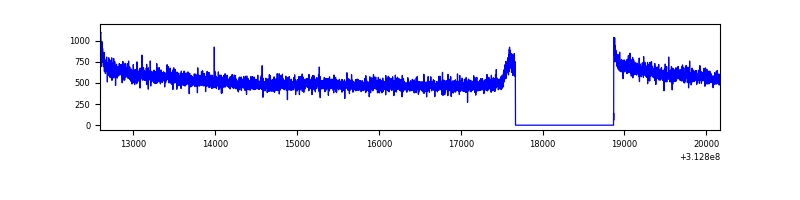 |
| B | 7574 | 6375 | 5 | 5 | 0.07% | 0.08% | 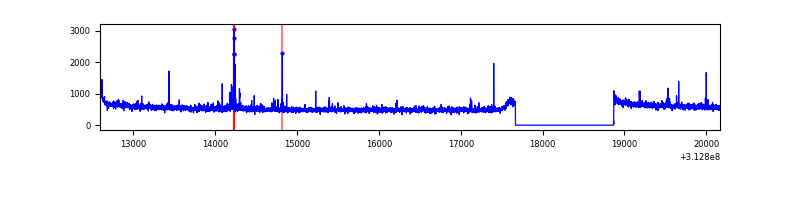 |
| C | 7574 | 6375 | 0 | 0 | 0.00% | 0.00% | 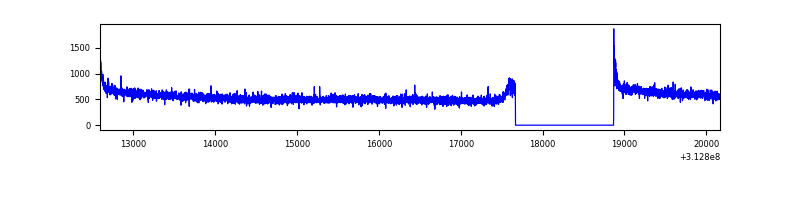 |
| D | 7574 | 6375 | 133 | 133 | 1.76% | 2.09% | 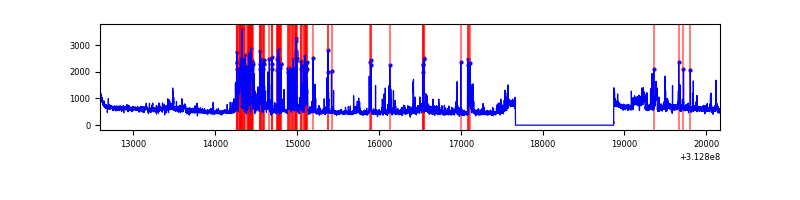 |
Top three noisy pixels from each quadrant. If the there are fewer than three noisy pixels in the level2.evt file, extra rows are filled as -1
| Pixel properties | Quadrant properties | ||||||
|---|---|---|---|---|---|---|---|
| Quadrant | DetID | PixID | Counts | Sigma | Mean | Median | Sigma |
| A | 13 | 254 | 10785 | 56.5 | 886 | 870 | 175.5 |
| A | 0 | 226 | 7522 | 37.9 | 886 | 870 | 175.5 |
| A | 3 | 137 | 6874 | 34.21 | 886 | 870 | 175.5 |
| B | 15 | 33 | 52313 | 316.2 | 874 | 857 | 162.7 |
| B | 12 | 111 | 19149 | 112.41 | 874 | 857 | 162.7 |
| B | 0 | 190 | 18944 | 111.15 | 874 | 857 | 162.7 |
| C | 14 | 238 | 136217 | 679.7 | 856 | 862 | 199.1 |
| C | 0 | 10 | 13254 | 62.23 | 856 | 862 | 199.1 |
| C | 8 | 128 | 11243 | 52.13 | 856 | 862 | 199.1 |
| D | 1 | 52 | 798879 | 3851.15 | 864 | 842 | 207.2 |
| D | 13 | 172 | 150978 | 724.52 | 864 | 842 | 207.2 |
| D | 7 | 223 | 104837 | 501.86 | 864 | 842 | 207.2 |
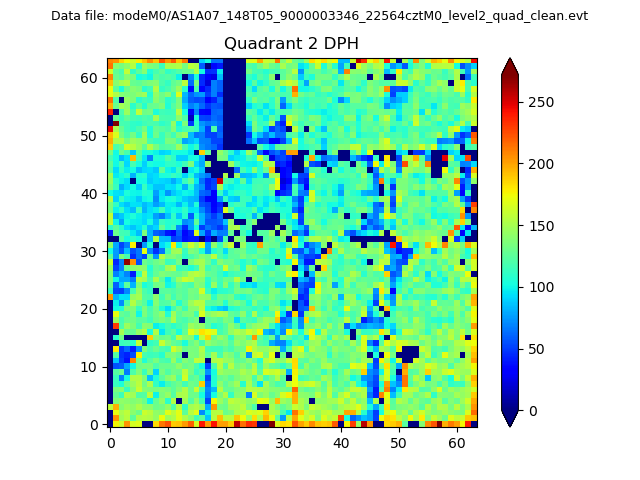
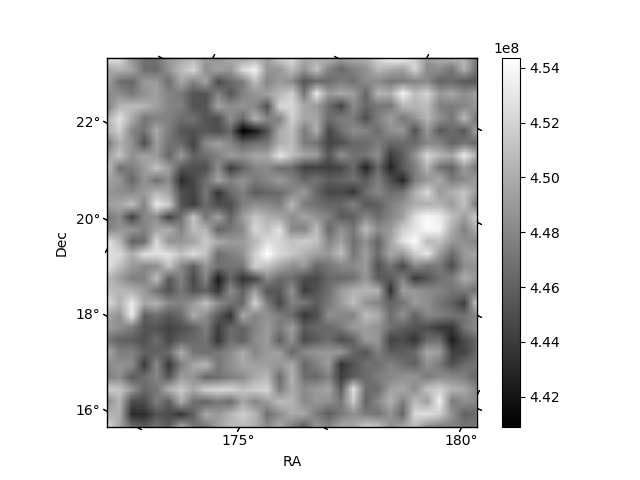
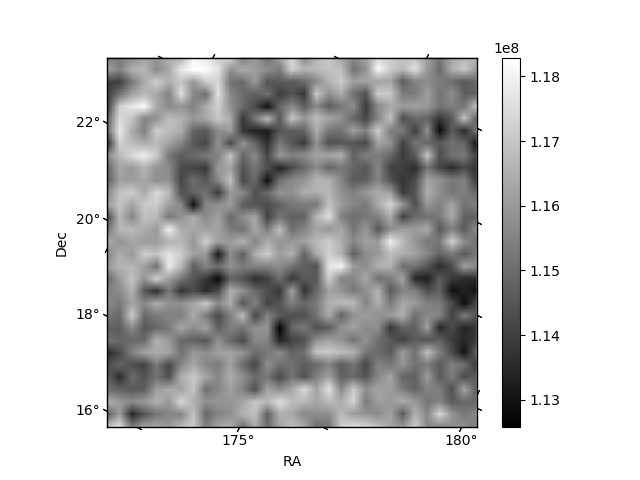
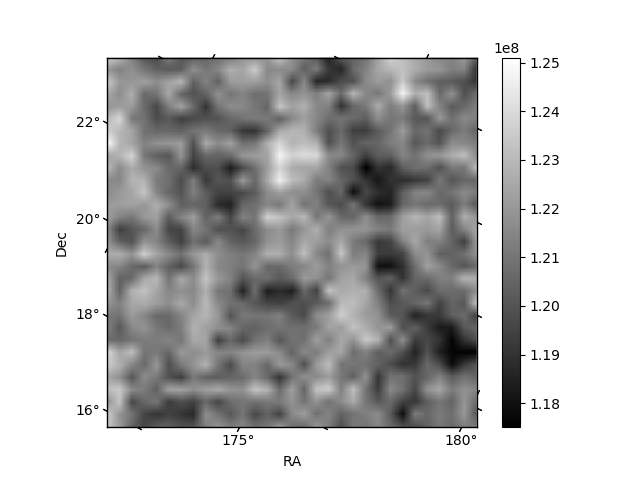
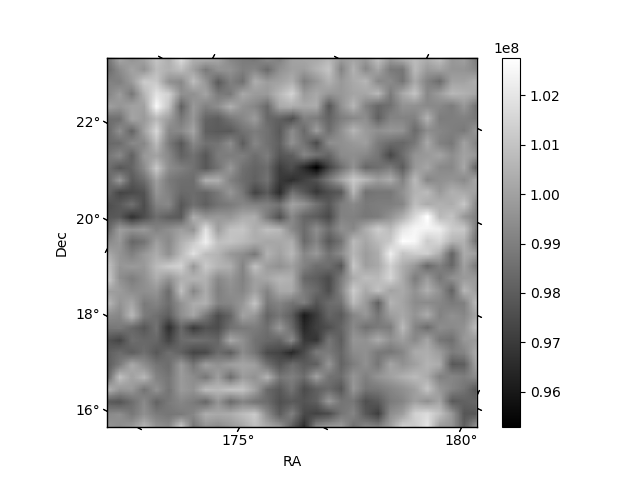
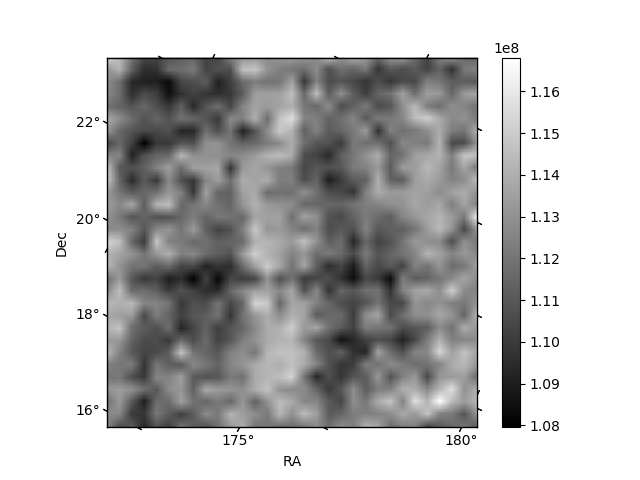
Histogram calculated using DETX and DETY for each event in the final _common_clean file
| Quadrant A | 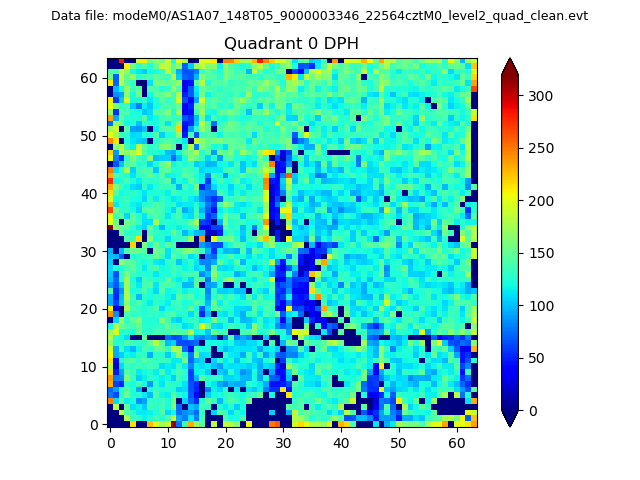 |
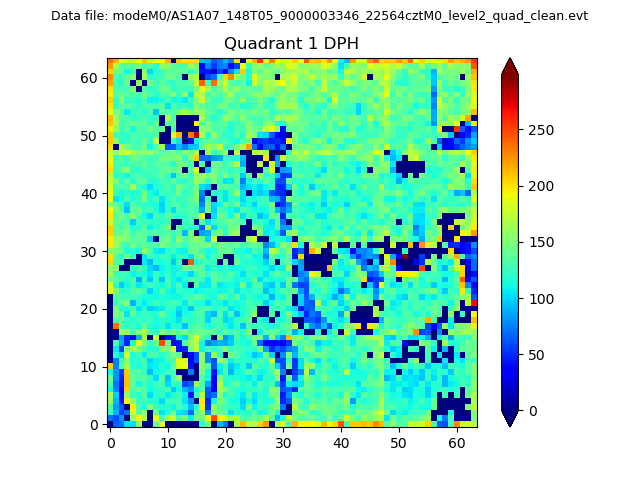 |
Quadrant B |
|---|---|---|---|
| Quadrant D | 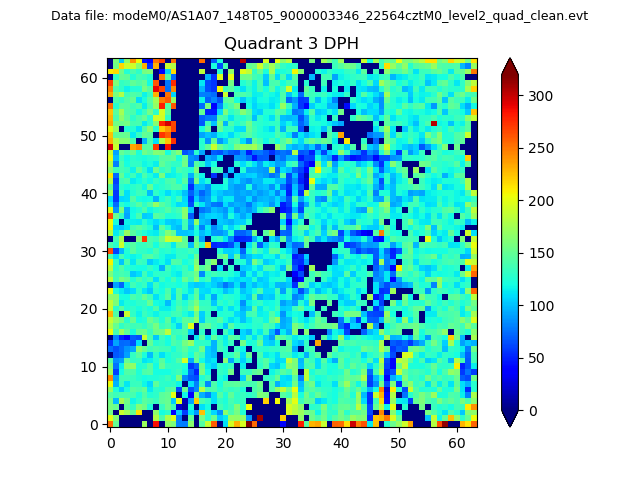 |
 |
Quadrant C |
| Plot type | Count rate plots | Images |
|---|---|---|
| Comparison with Poisson distribution Blue bars denote a histogram of data divided into 1 sec bins. Red curve is a Poisson curve with rate = median count rate of data. |
 |
 |
| Quadrant-wise count rates Data is divided into 100 sec bins |
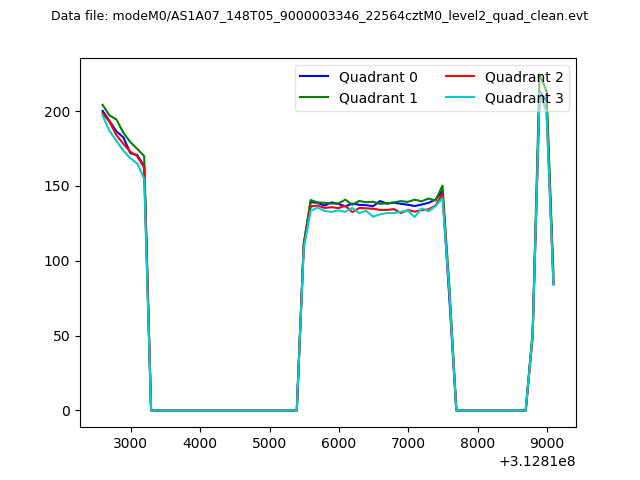 |
|
| Module-wise count rates for Quadrant A Data is divided into 100 sec bins |
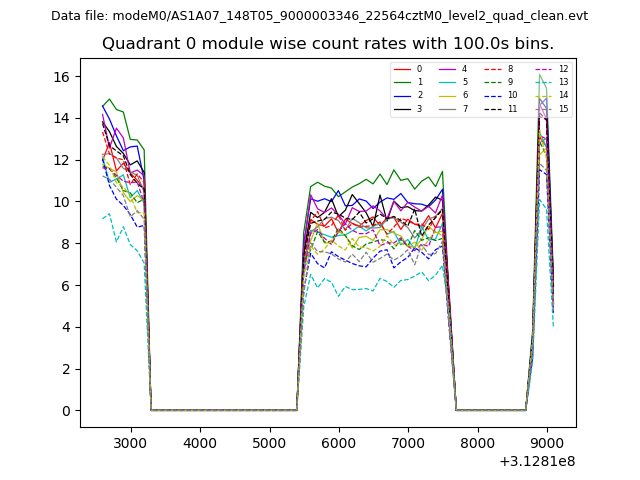 |
 |
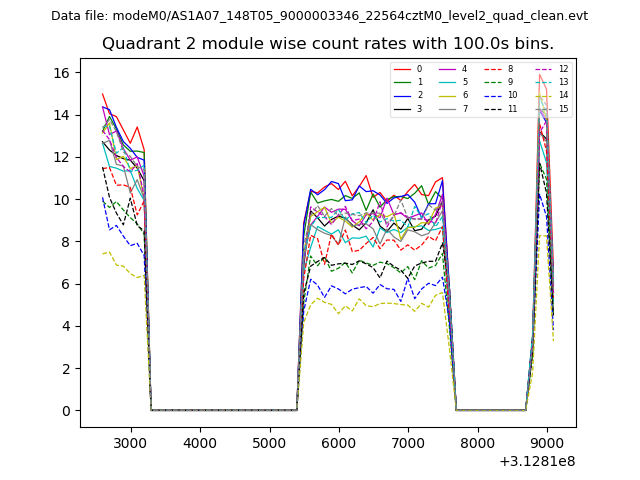
| Module-wise count rates for Quadrant B Data is divided into 100 sec bins |
 |
 |
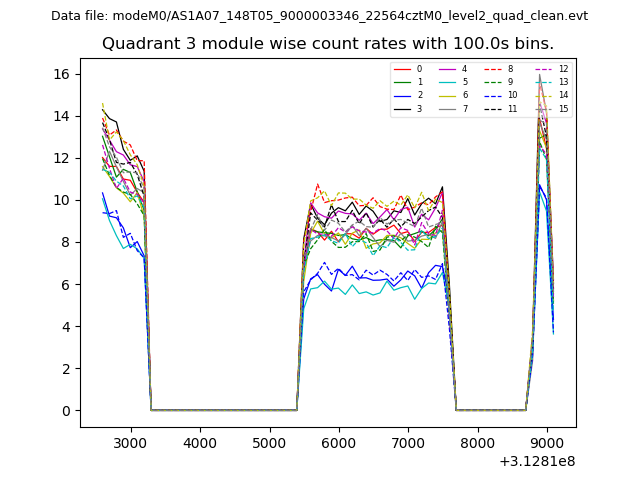
| Module-wise count rates for Quadrant C Data is divided into 100 sec bins |
 |
 |
| Module-wise count rates for Quadrant D Data is divided into 100 sec bins |
 |
 |
| Parameter | Plot |
|---|---|
| CZT HV Monitor |  |
| D_VDD | 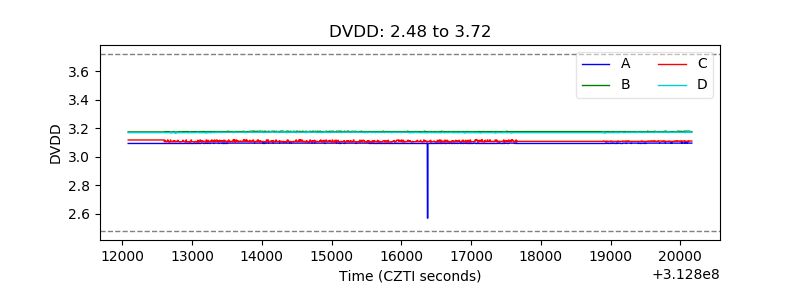 |
| Temperature 1 | 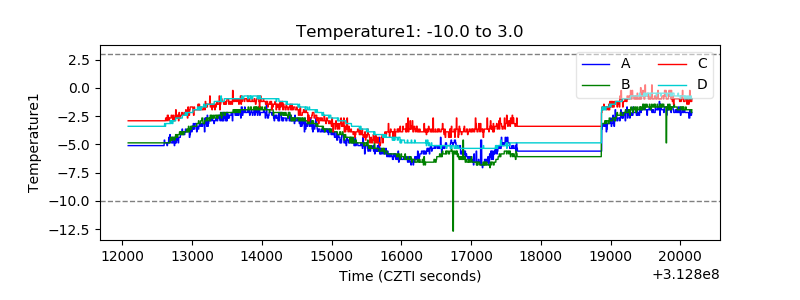 |
| Veto HV Monitor | 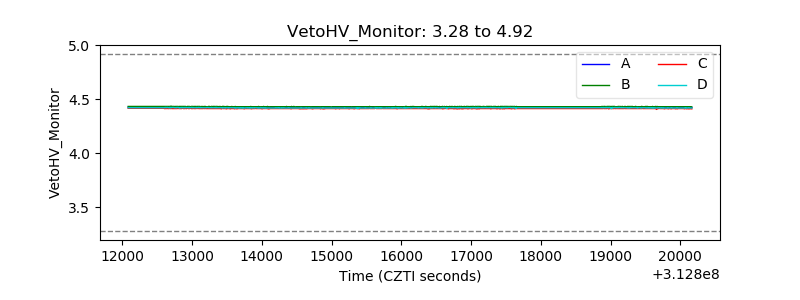 |
| Veto LLD | 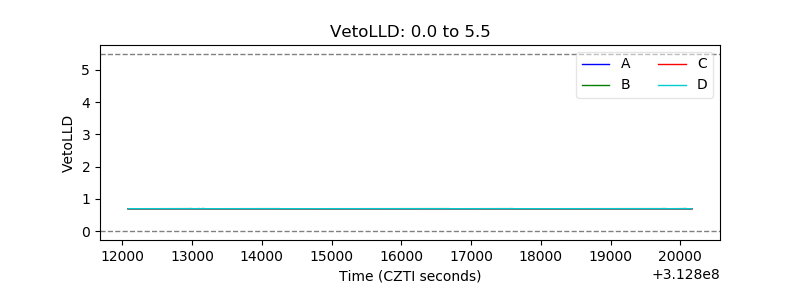 |
| Alpha Counter | 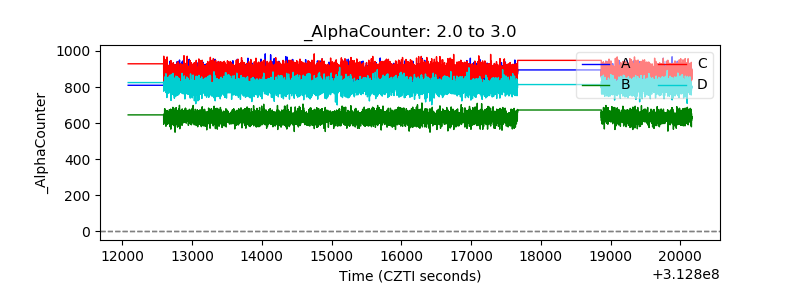 |
| _CPM_Rate | 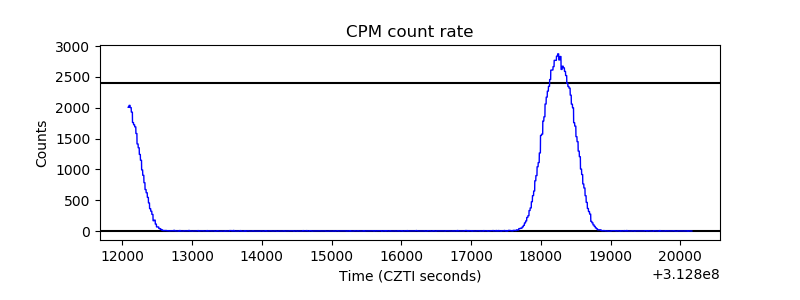 |
| CZT Counter | 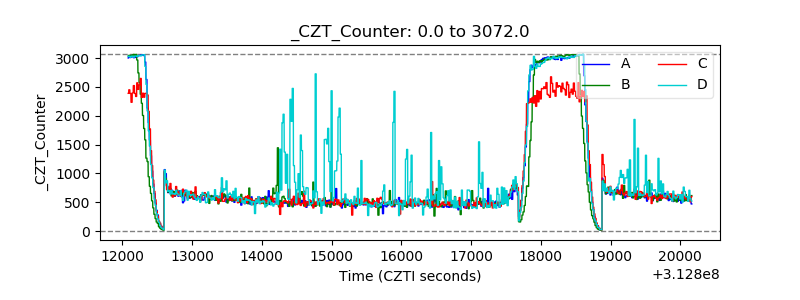 |
| +2.5 Volts monitor |  |
| +5 Volts monitor | 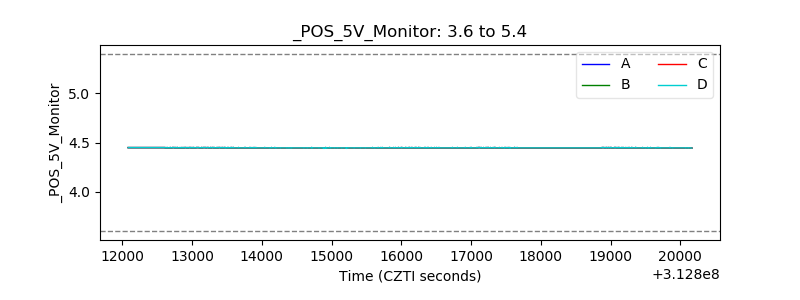 |
| _ROLL_ROT | 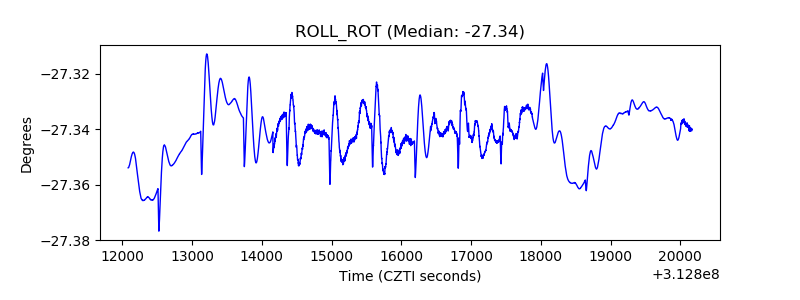 |
| _Roll_DEC | 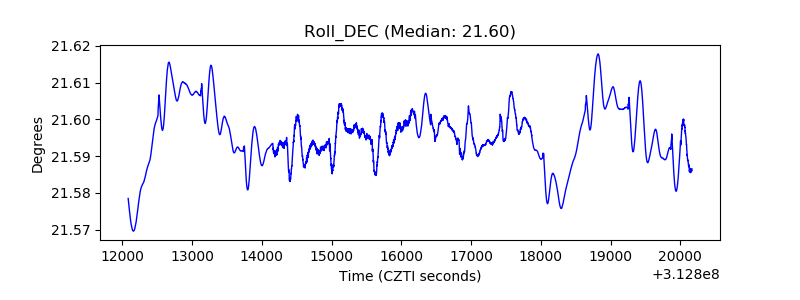 |
| _Roll_RA | 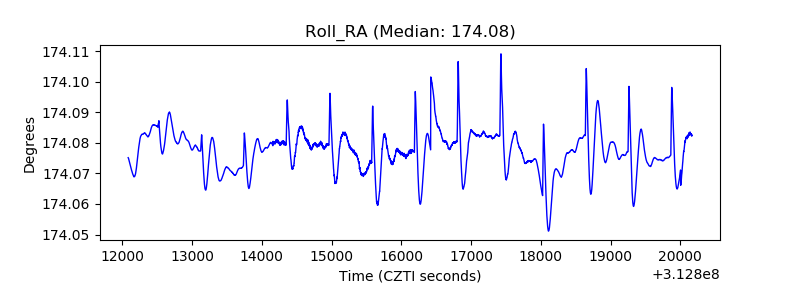 |
| Veto Counter | 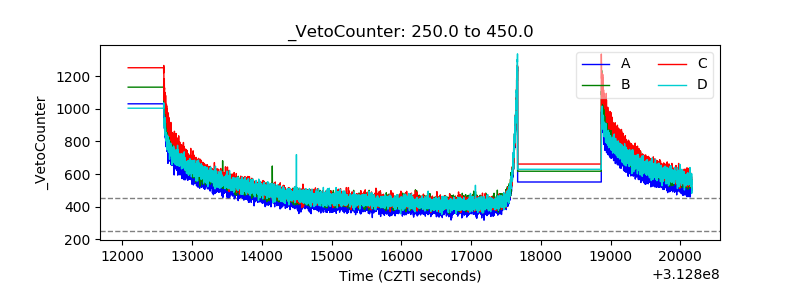 |