| Param | Original file | Final file |
|---|---|---|
| Filename | modeM0/AS1A07_148T05_9000003346_22565cztM0_level2.evt | modeM0/AS1A07_148T05_9000003346_22565cztM0_level2_quad_clean.evt |
| Size (bytes) | 513,351,360 | 66,205,440 |
| Size | 489.6 MB | 63.1 MB |
| Events in quadrant A | 3,648,736 | 392,368 |
| Events in quadrant B | 3,724,255 | 396,921 |
| Events in quadrant C | 3,648,267 | 386,497 |
| Events in quadrant D | 4,088,196 | 378,658 |
| Mode M9 | |||
|---|---|---|---|
| Quadrant | BADHDUFLAG | Total packets | Discarded packets |
| A | 0 | 13 | 0 |
| B | 0 | 13 | 0 |
| C | 0 | 13 | 0 |
| D | 0 | 13 | 0 |
| Mode M0 | |||
|---|---|---|---|
| Quadrant | BADHDUFLAG | Total packets | Discarded packets |
| A | 0 | 14918 | 1 |
| B | 0 | 15296 | 1 |
| C | 0 | 14988 | 1 |
| D | 0 | 16521 | 1 |
| Mode SS | |||
|---|---|---|---|
| Quadrant | BADHDUFLAG | Total packets | Discarded packets |
| A | 0 | 130 | 0 |
| B | 0 | 130 | 0 |
| C | 0 | 130 | 0 |
| D | 0 | 130 | 0 |
| Quadrant | Total seconds | Saturated seconds | Saturation percentage |
|---|---|---|---|
| A | 6454 | 98 | 1.518438% |
| B | 6455 | 125 | 1.936483% |
| C | 6455 | 152 | 2.354764% |
| D | 6455 | 103 | 1.595662% |
Noise dominated data is calculated using 1-second bins in cleaned event files. If a bin has >2000 counts, and if more than 50% of those come from <1% of pixels, then it is considered to be noise-dominated and hence unusable.
| Quadrant | # 1 sec bins | Bins with >0 counts | Bins with >2000 counts | High rate bins dominated by noise | Noise dominated (total time) | Noise dominated (detector-on time) | Marked lightcurve |
|---|---|---|---|---|---|---|---|
| A | 7724 | 6455 | 0 | 0 | 0.00% | 0.00% | 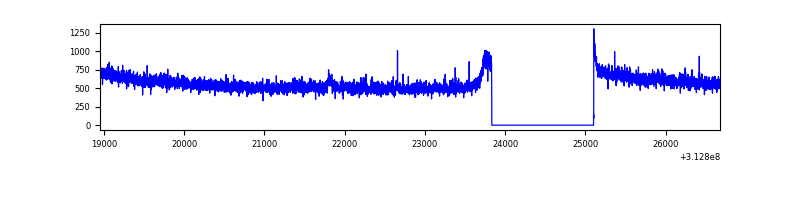 |
| B | 7725 | 6456 | 22 | 22 | 0.28% | 0.34% | 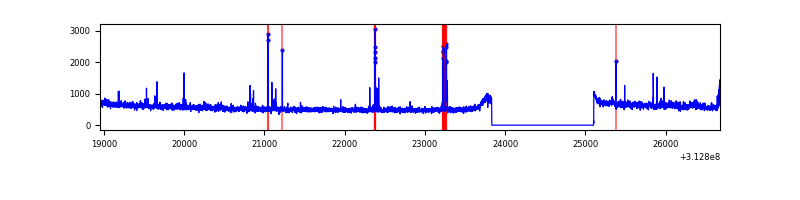 |
| C | 7725 | 6456 | 0 | 0 | 0.00% | 0.00% | 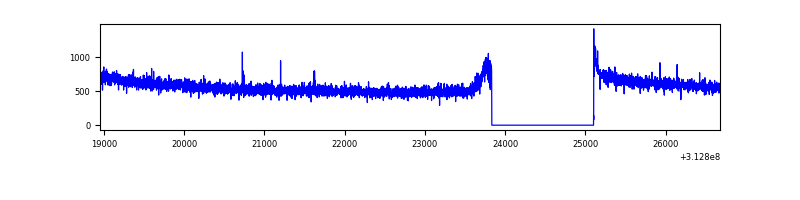 |
| D | 7725 | 6456 | 16 | 16 | 0.21% | 0.25% | 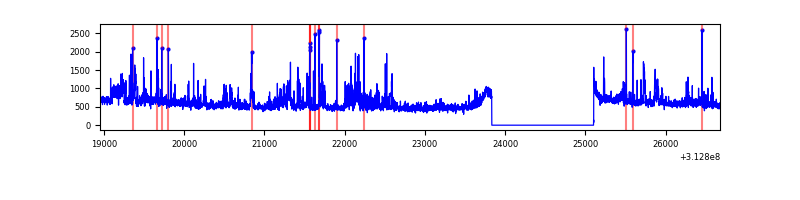 |
Top three noisy pixels from each quadrant. If the there are fewer than three noisy pixels in the level2.evt file, extra rows are filled as -1
| Pixel properties | Quadrant properties | ||||||
|---|---|---|---|---|---|---|---|
| Quadrant | DetID | PixID | Counts | Sigma | Mean | Median | Sigma |
| A | 13 | 34 | 91094 | 492.8 | 921 | 906 | 183.0 |
| A | 13 | 254 | 11089 | 55.64 | 921 | 906 | 183.0 |
| A | 0 | 226 | 8222 | 39.98 | 921 | 906 | 183.0 |
| B | 5 | 172 | 64177 | 376.15 | 910 | 891 | 168.2 |
| B | 0 | 190 | 24540 | 140.56 | 910 | 891 | 168.2 |
| B | 0 | 228 | 23161 | 132.36 | 910 | 891 | 168.2 |
| C | 14 | 238 | 144368 | 690.69 | 897 | 907 | 207.7 |
| C | 13 | 61 | 6371 | 26.31 | 897 | 907 | 207.7 |
| C | 0 | 10 | 4988 | 19.65 | 897 | 907 | 207.7 |
| D | 1 | 52 | 379151 | 1721.38 | 910 | 887 | 219.7 |
| D | 7 | 223 | 164174 | 743.07 | 910 | 887 | 219.7 |
| D | 13 | 172 | 50935 | 227.75 | 910 | 887 | 219.7 |
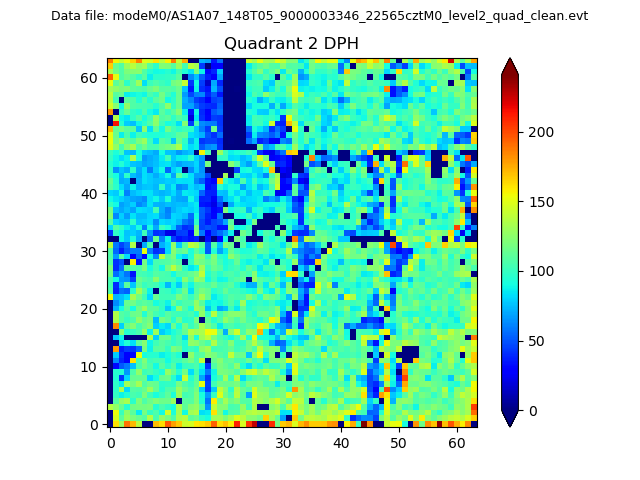
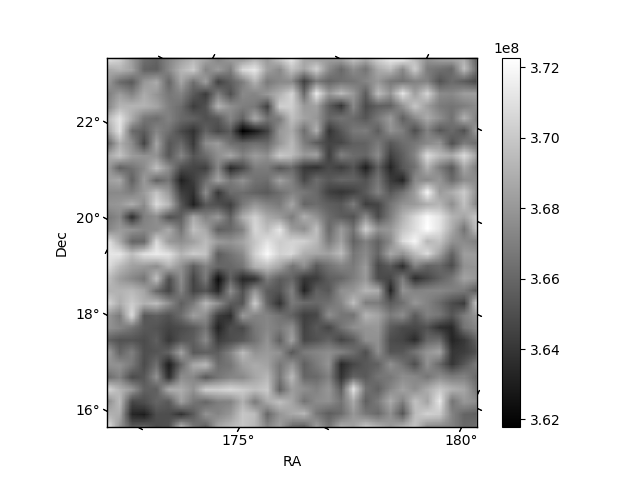
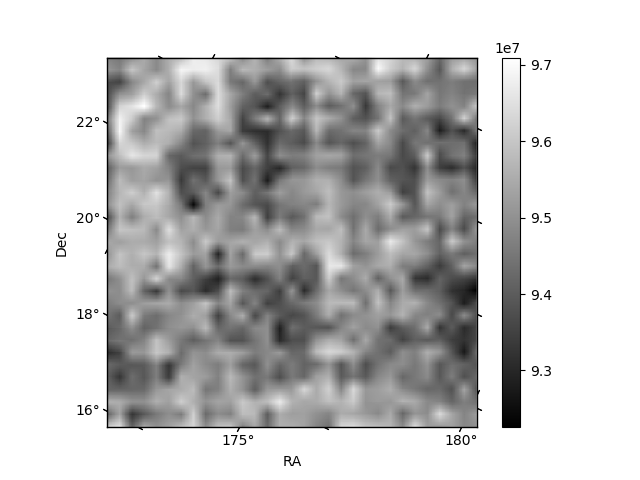
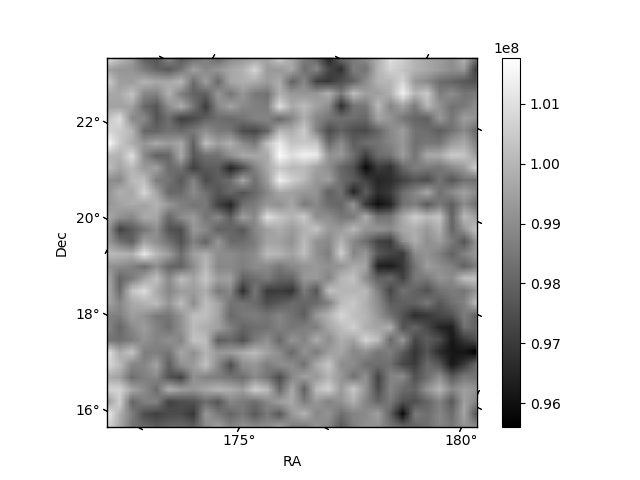
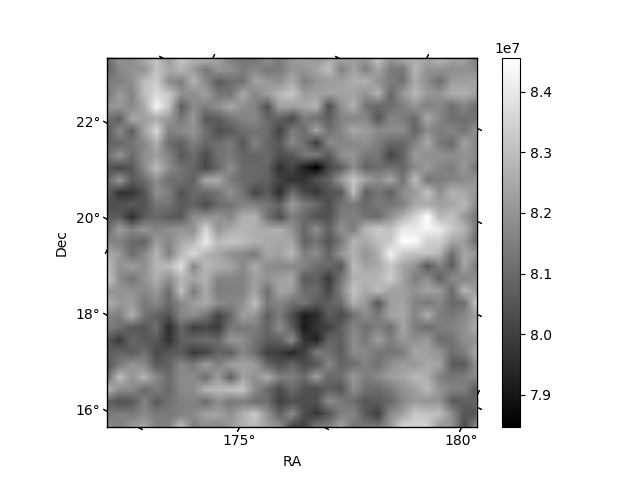
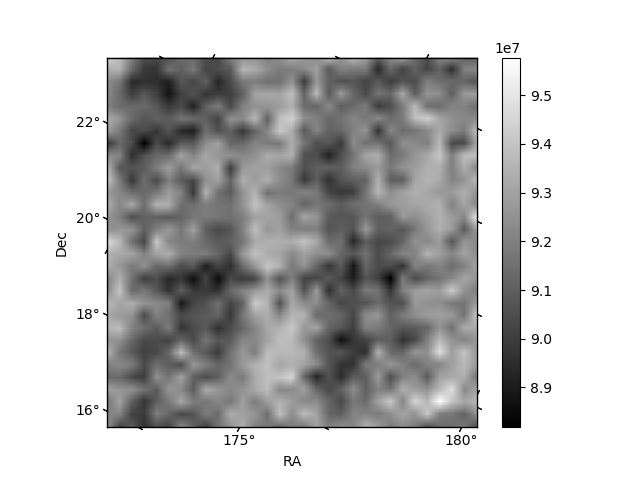
Histogram calculated using DETX and DETY for each event in the final _common_clean file
| Quadrant A | 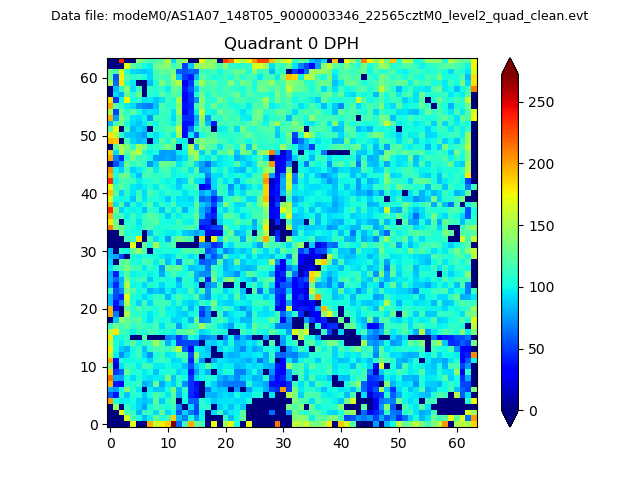 |
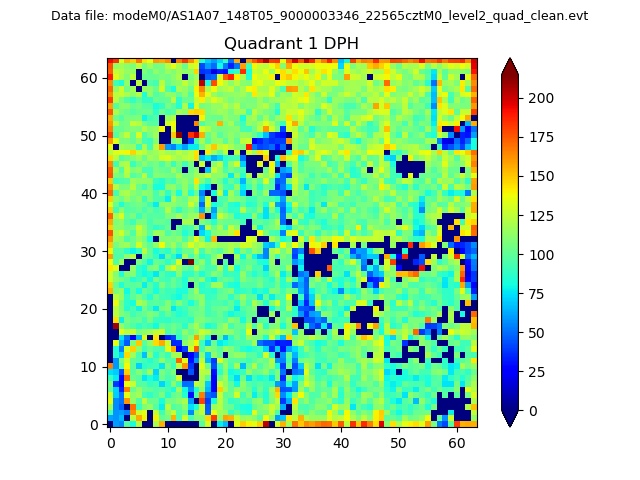 |
Quadrant B |
|---|---|---|---|
| Quadrant D | 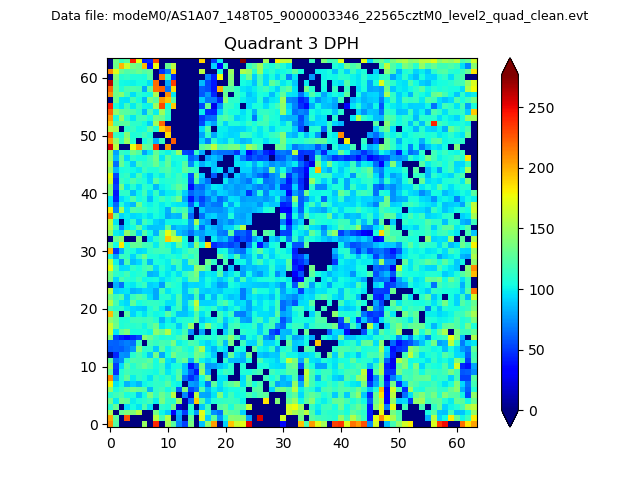 |
 |
Quadrant C |
| Plot type | Count rate plots | Images |
|---|---|---|
| Comparison with Poisson distribution Blue bars denote a histogram of data divided into 1 sec bins. Red curve is a Poisson curve with rate = median count rate of data. |
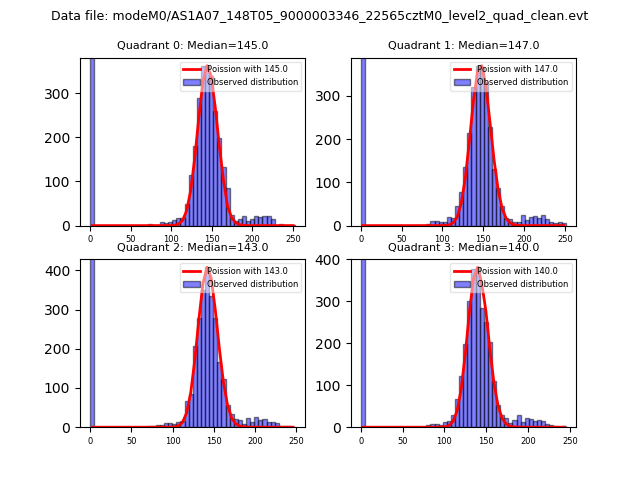 |
 |
| Quadrant-wise count rates Data is divided into 100 sec bins |
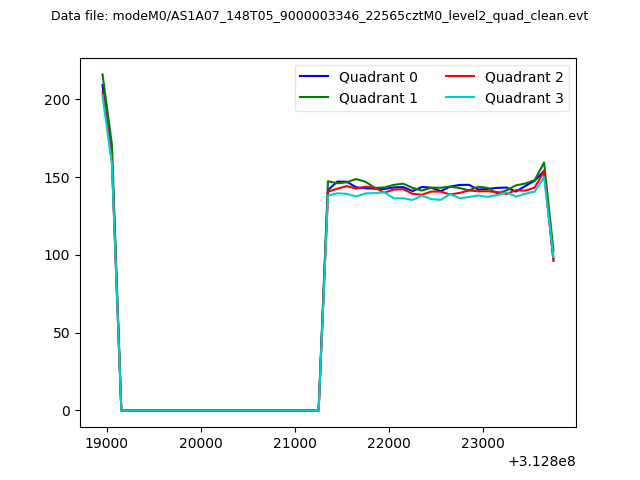 |
|
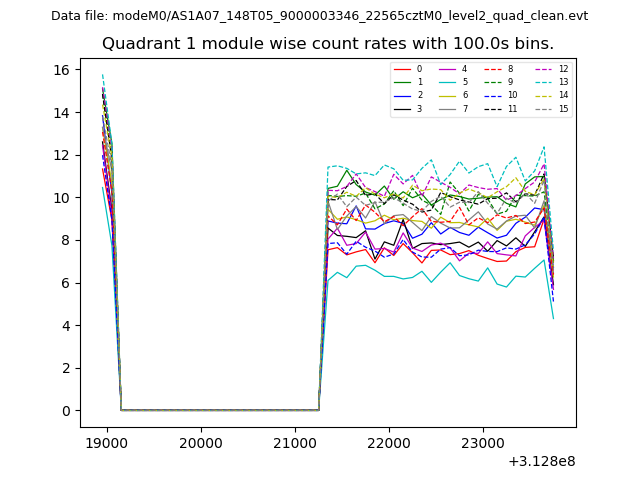
| Module-wise count rates for Quadrant A Data is divided into 100 sec bins |
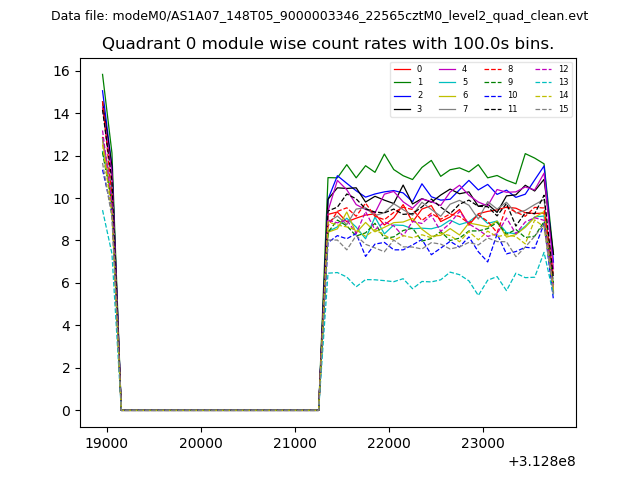 |
 |
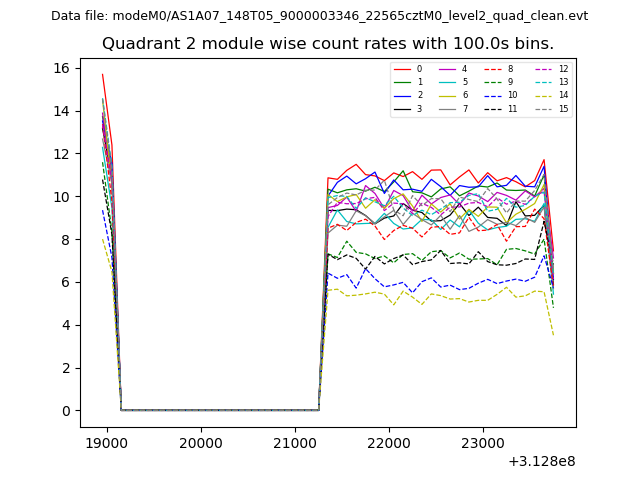
| Module-wise count rates for Quadrant B Data is divided into 100 sec bins |
 |
 |
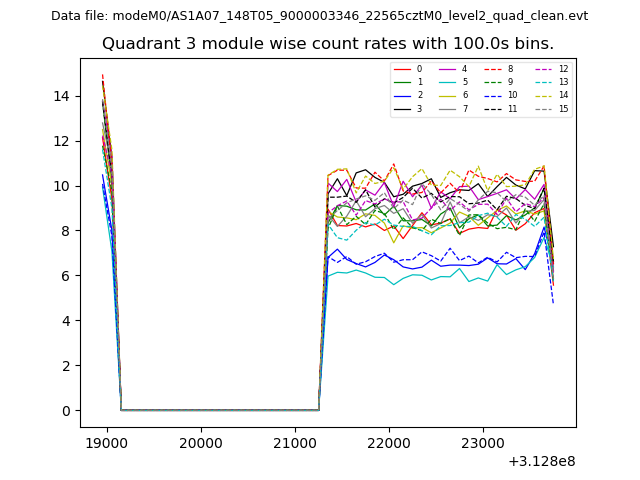
| Module-wise count rates for Quadrant C Data is divided into 100 sec bins |
 |
 |
| Module-wise count rates for Quadrant D Data is divided into 100 sec bins |
 |
 |
| Parameter | Plot |
|---|---|
| CZT HV Monitor | 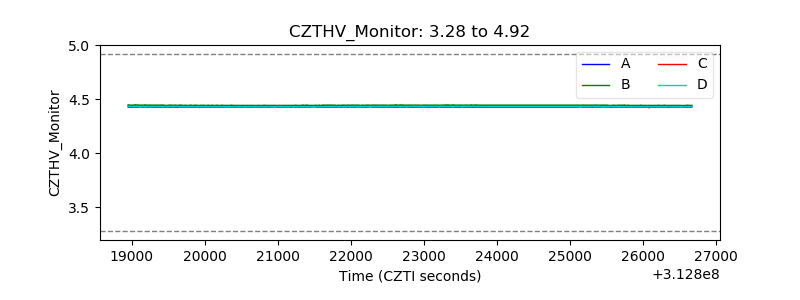 |
| D_VDD | 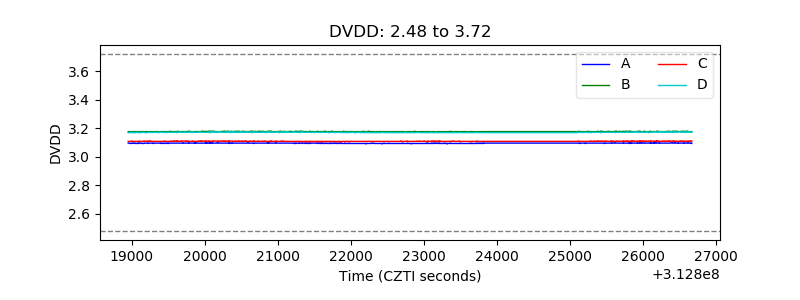 |
| Temperature 1 | 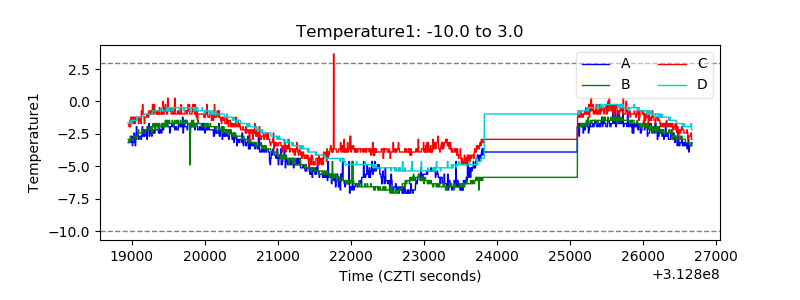 |
| Veto HV Monitor | 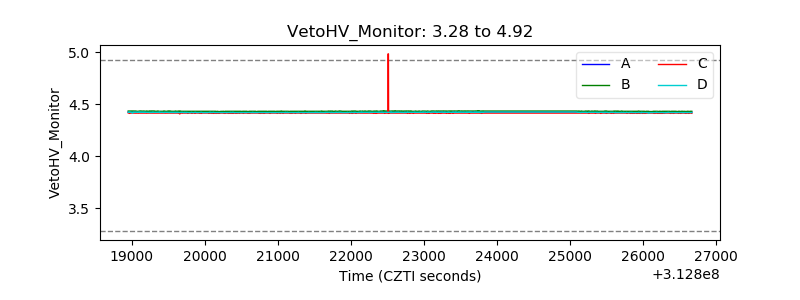 |
| Veto LLD | 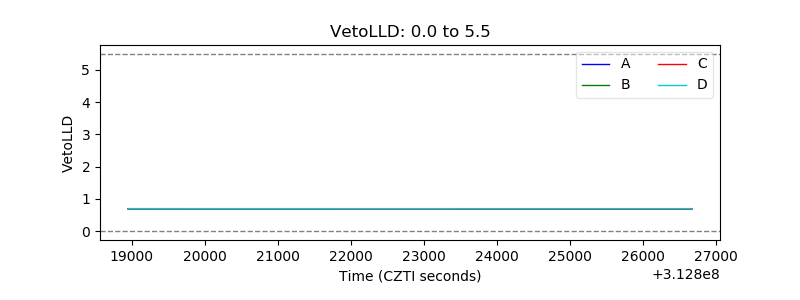 |
| Alpha Counter | 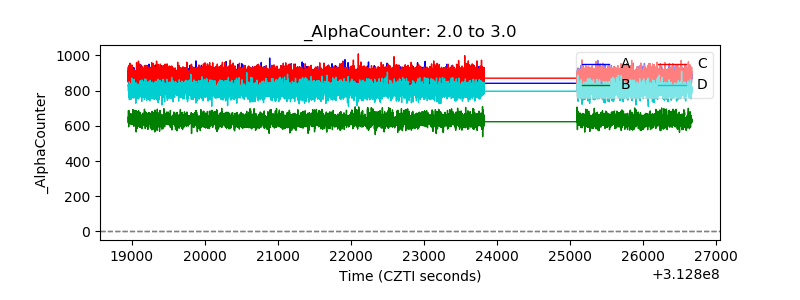 |
| _CPM_Rate | 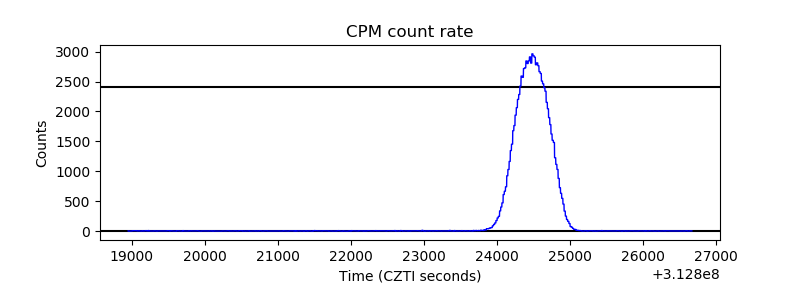 |
| CZT Counter | 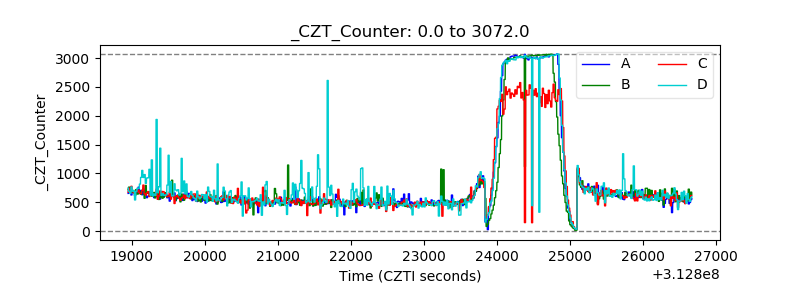 |
| +2.5 Volts monitor |  |
| +5 Volts monitor | 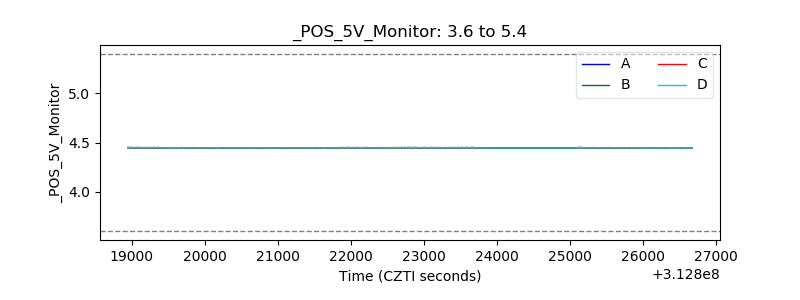 |
| _ROLL_ROT | 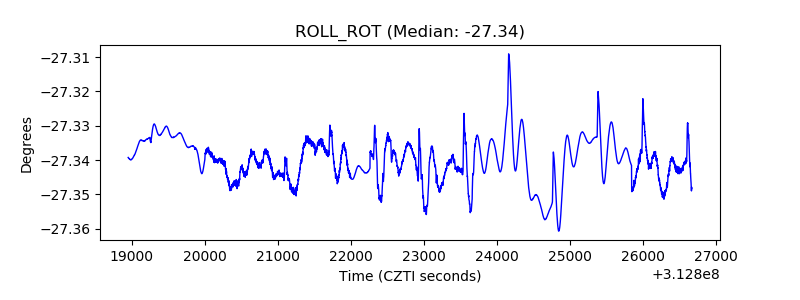 |
| _Roll_DEC | 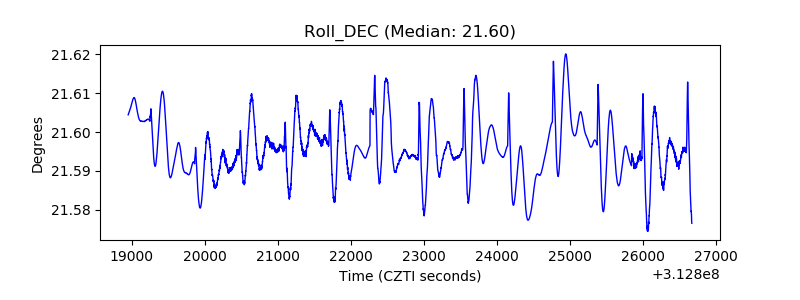 |
| _Roll_RA | 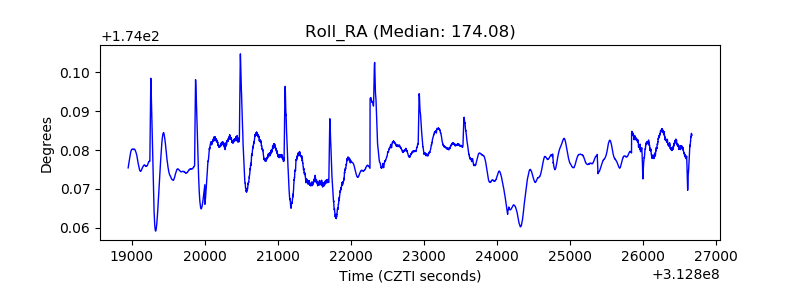 |
| Veto Counter | 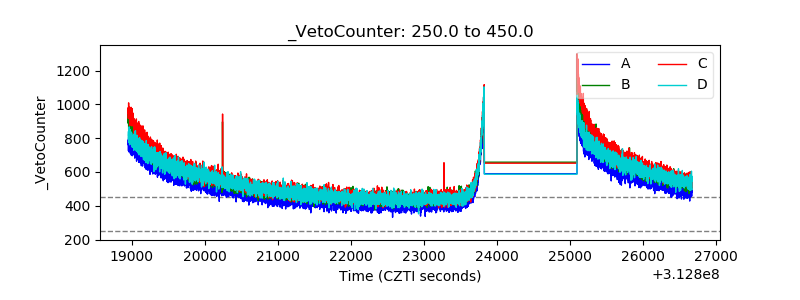 |