| Param | Original file | Final file |
|---|---|---|
| Filename | modeM0/AS1A07_148T05_9000003346_22568cztM0_level2.evt | modeM0/AS1A07_148T05_9000003346_22568cztM0_level2_quad_clean.evt |
| Size (bytes) | 155,027,520 | 16,925,760 |
| Size | 147.8 MB | 16.1 MB |
| Events in quadrant A | 1,074,101 | 92,454 |
| Events in quadrant B | 1,142,749 | 94,631 |
| Events in quadrant C | 1,070,976 | 91,935 |
| Events in quadrant D | 1,271,539 | 89,911 |
| Mode M9 | |||
|---|---|---|---|
| Quadrant | BADHDUFLAG | Total packets | Discarded packets |
| A | 0 | 10 | 0 |
| B | 0 | 11 | 0 |
| C | 0 | 11 | 0 |
| D | 0 | 11 | 0 |
| Mode M0 | |||
|---|---|---|---|
| Quadrant | BADHDUFLAG | Total packets | Discarded packets |
| A | 0 | 4402 | 1 |
| B | 0 | 4584 | 1 |
| C | 0 | 4330 | 1 |
| D | 0 | 5081 | 1 |
| Mode SS | |||
|---|---|---|---|
| Quadrant | BADHDUFLAG | Total packets | Discarded packets |
| A | 0 | 38 | 0 |
| B | 0 | 38 | 0 |
| C | 0 | 38 | 0 |
| D | 0 | 38 | 0 |
| Quadrant | Total seconds | Saturated seconds | Saturation percentage |
|---|---|---|---|
| A | 1966 | 18 | 0.915565% |
| B | 1966 | 46 | 2.339776% |
| C | 1966 | 27 | 1.373347% |
| D | 1966 | 29 | 1.475076% |
Noise dominated data is calculated using 1-second bins in cleaned event files. If a bin has >2000 counts, and if more than 50% of those come from <1% of pixels, then it is considered to be noise-dominated and hence unusable.
| Quadrant | # 1 sec bins | Bins with >0 counts | Bins with >2000 counts | High rate bins dominated by noise | Noise dominated (total time) | Noise dominated (detector-on time) | Marked lightcurve |
|---|---|---|---|---|---|---|---|
| A | 1966 | 1966 | 0 | 0 | 0.00% | 0.00% | 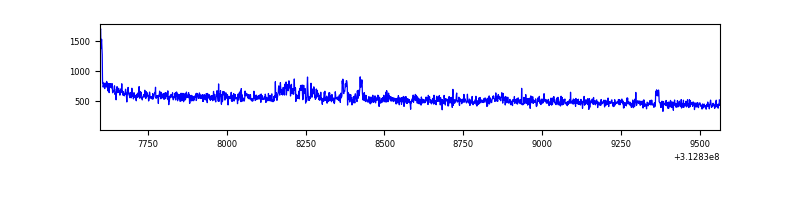 |
| B | 1966 | 1966 | 2 | 2 | 0.10% | 0.10% | 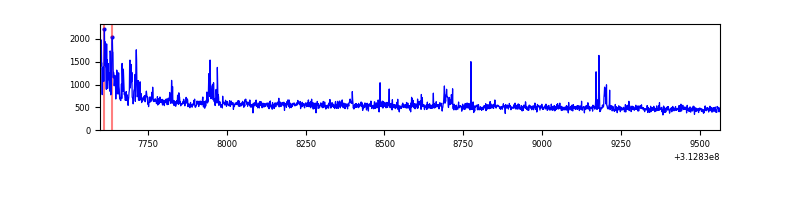 |
| C | 1966 | 1966 | 0 | 0 | 0.00% | 0.00% | 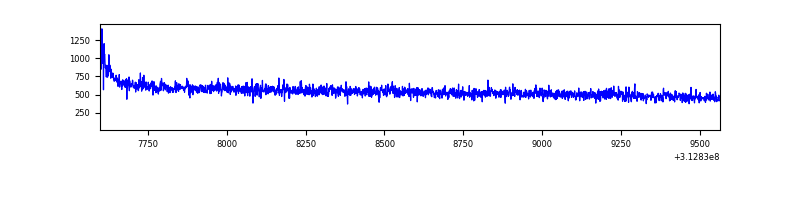 |
| D | 1966 | 1966 | 15 | 15 | 0.76% | 0.76% | 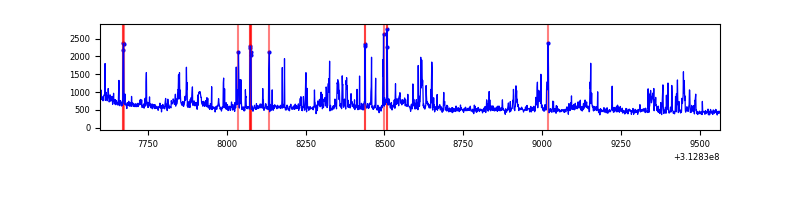 |
Top three noisy pixels from each quadrant. If the there are fewer than three noisy pixels in the level2.evt file, extra rows are filled as -1
| Pixel properties | Quadrant properties | ||||||
|---|---|---|---|---|---|---|---|
| Quadrant | DetID | PixID | Counts | Sigma | Mean | Median | Sigma |
| A | 13 | 34 | 37835 | 676.76 | 268 | 263 | 55.5 |
| A | 13 | 254 | 3549 | 59.19 | 268 | 263 | 55.5 |
| A | 0 | 226 | 2413 | 38.73 | 268 | 263 | 55.5 |
| B | 15 | 33 | 66791 | 1286.45 | 265 | 259 | 51.7 |
| B | 0 | 230 | 13718 | 260.24 | 265 | 259 | 51.7 |
| B | 0 | 228 | 11976 | 226.56 | 265 | 259 | 51.7 |
| C | 14 | 238 | 40864 | 652.67 | 261 | 264 | 62.2 |
| C | 0 | 10 | 7067 | 109.36 | 261 | 264 | 62.2 |
| C | 10 | 222 | 2217 | 31.4 | 261 | 264 | 62.2 |
| D | 1 | 52 | 201969 | 3092.81 | 264 | 257 | 65.2 |
| D | 2 | 136 | 39265 | 598.1 | 264 | 257 | 65.2 |
| D | 13 | 172 | 21275 | 322.27 | 264 | 257 | 65.2 |
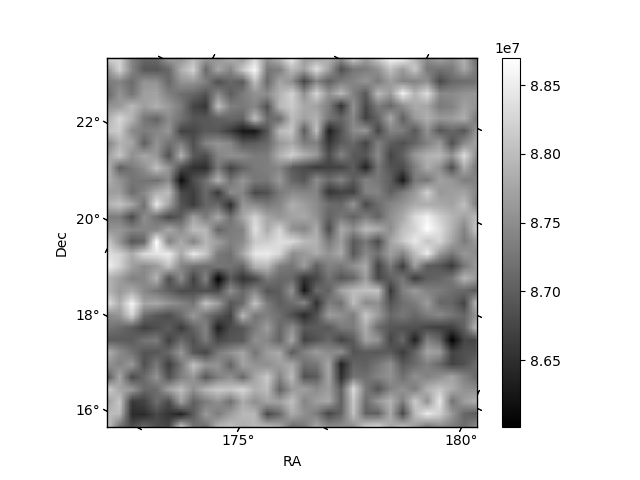
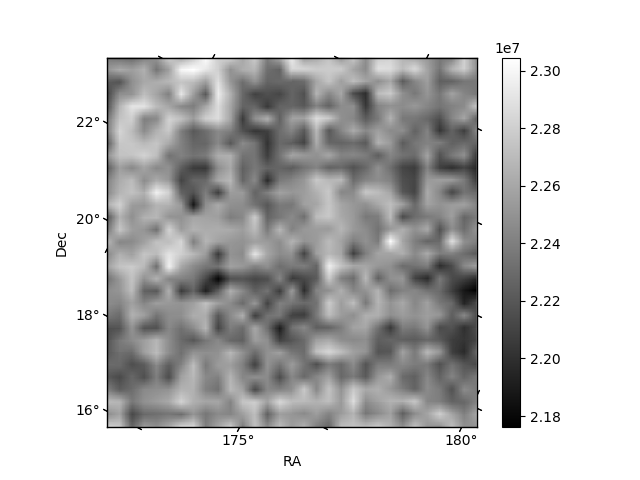
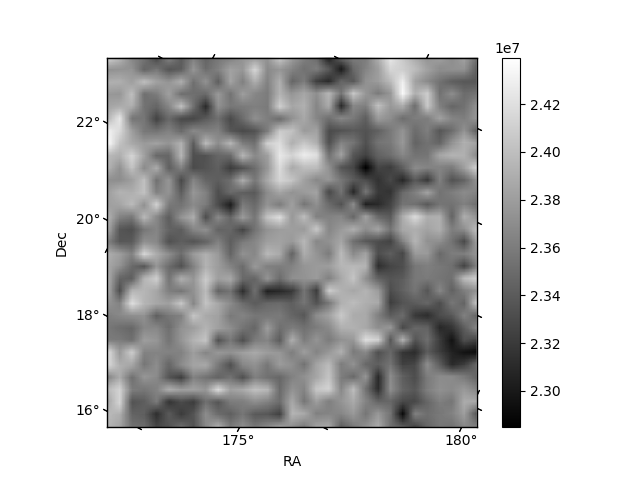
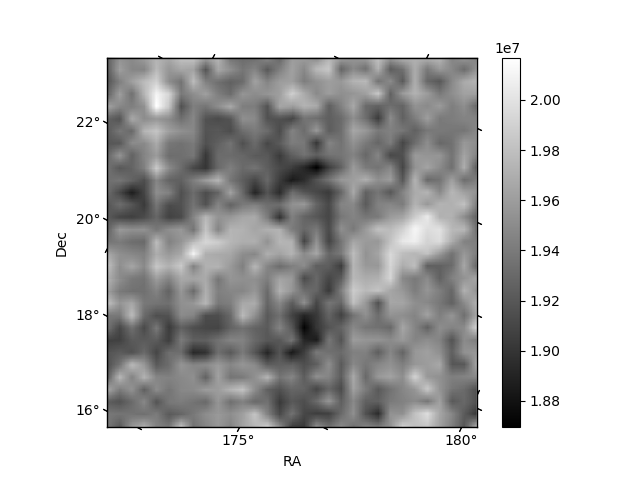
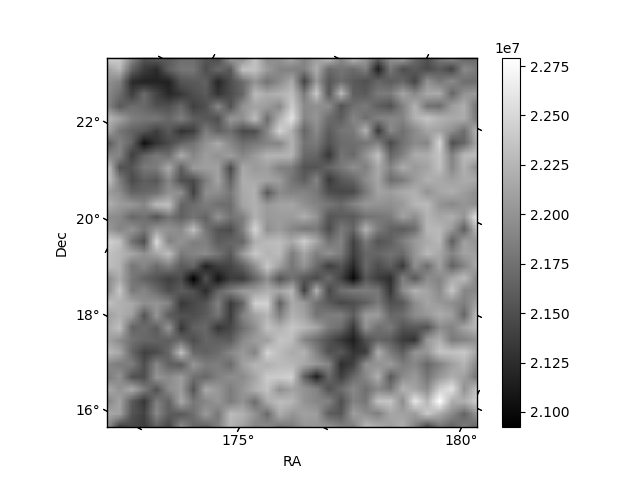
Histogram calculated using DETX and DETY for each event in the final _common_clean file
| Quadrant A | 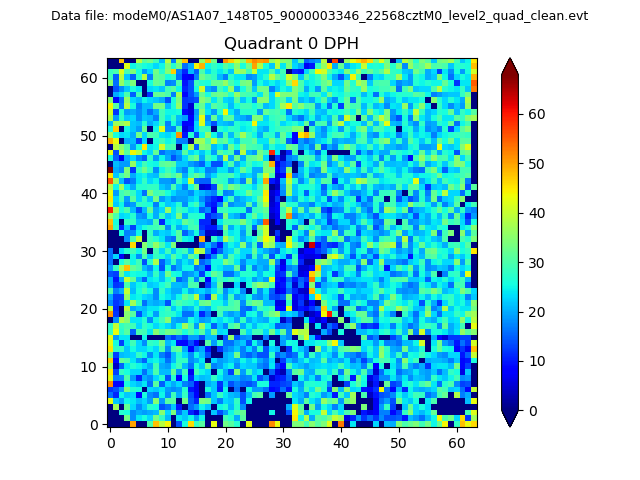 |
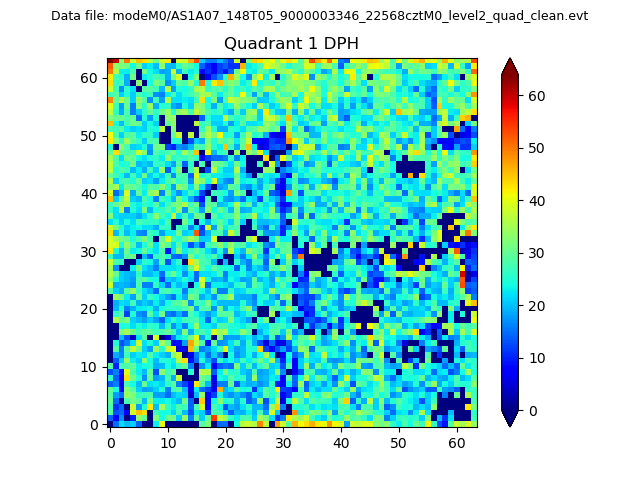 |
Quadrant B |
|---|---|---|---|
| Quadrant D | 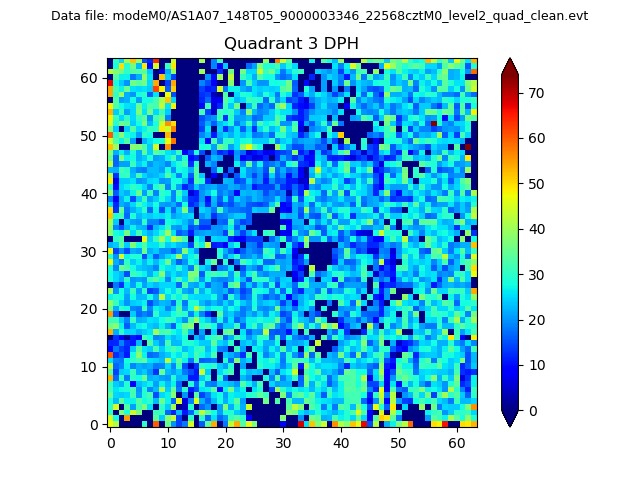 |
 |
Quadrant C |
| Plot type | Count rate plots | Images |
|---|---|---|
| Comparison with Poisson distribution Blue bars denote a histogram of data divided into 1 sec bins. Red curve is a Poisson curve with rate = median count rate of data. |
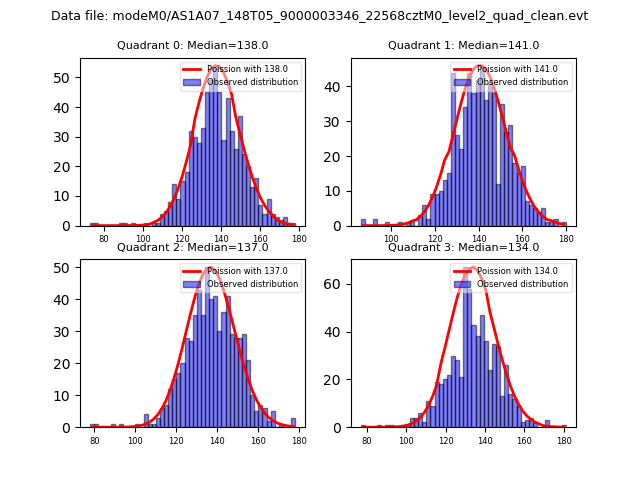 |
 |
| Quadrant-wise count rates Data is divided into 100 sec bins |
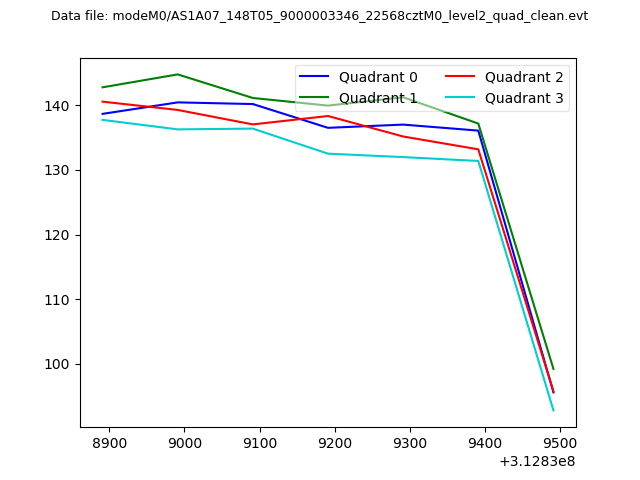 |
|
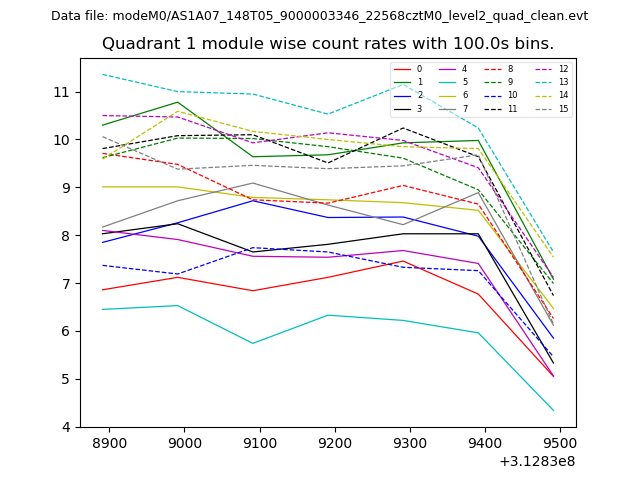
| Module-wise count rates for Quadrant A Data is divided into 100 sec bins |
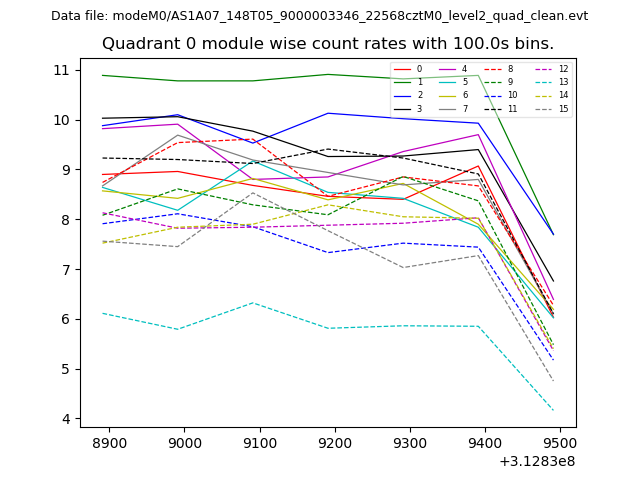 |
 |
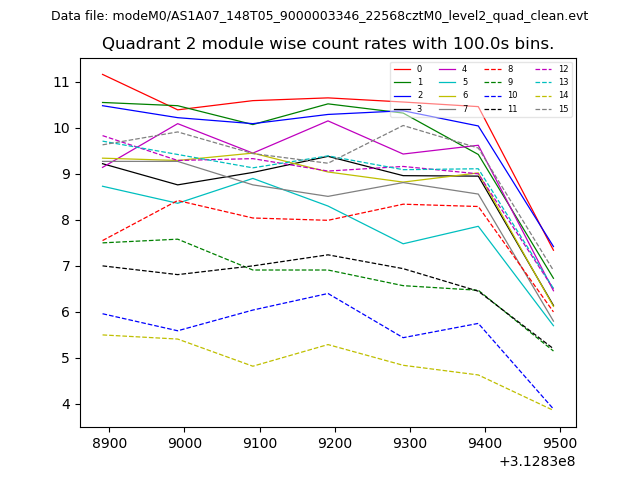
| Module-wise count rates for Quadrant B Data is divided into 100 sec bins |
 |
 |
| Module-wise count rates for Quadrant C Data is divided into 100 sec bins |
 |
 |
| Module-wise count rates for Quadrant D Data is divided into 100 sec bins |
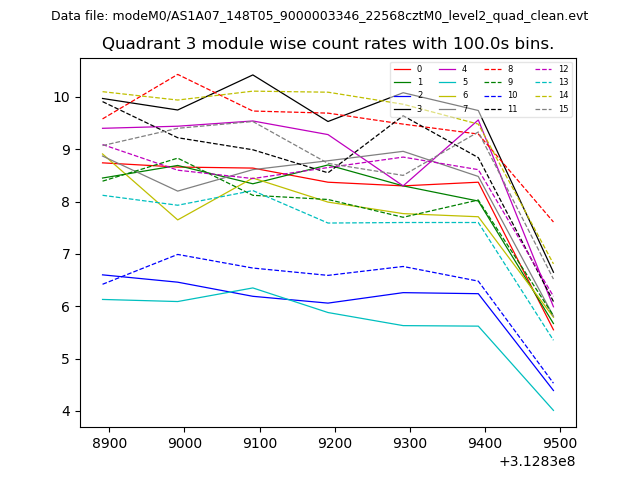 |
 |
| Parameter | Plot |
|---|---|
| CZT HV Monitor | 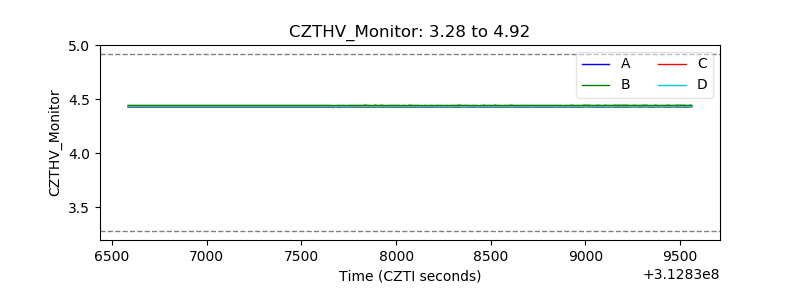 |
| D_VDD | 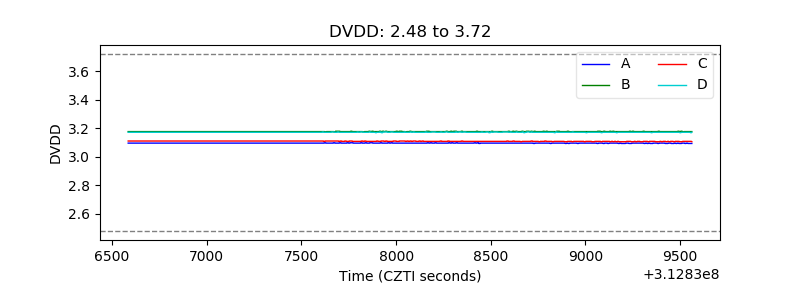 |
| Temperature 1 | 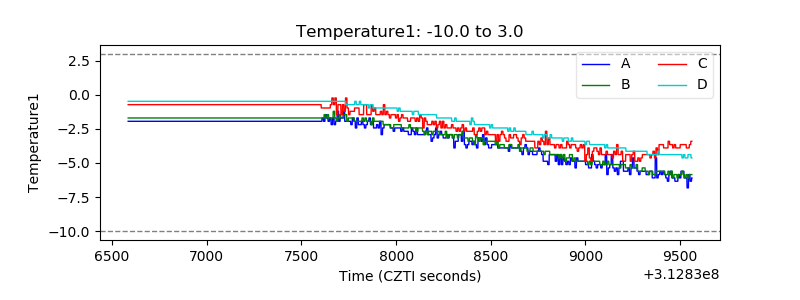 |
| Veto HV Monitor | 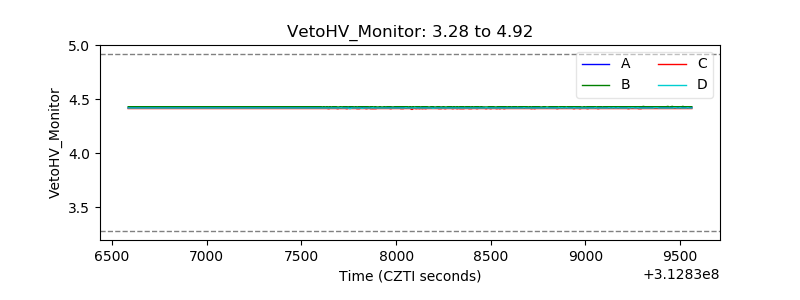 |
| Veto LLD | 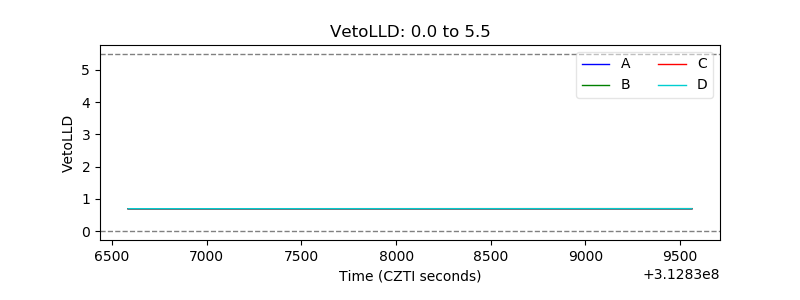 |
| Alpha Counter | 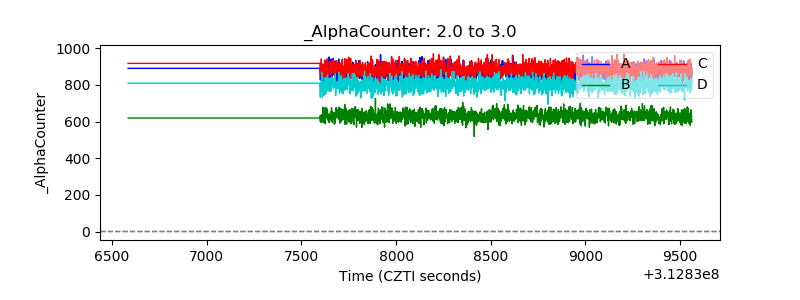 |
| _CPM_Rate | 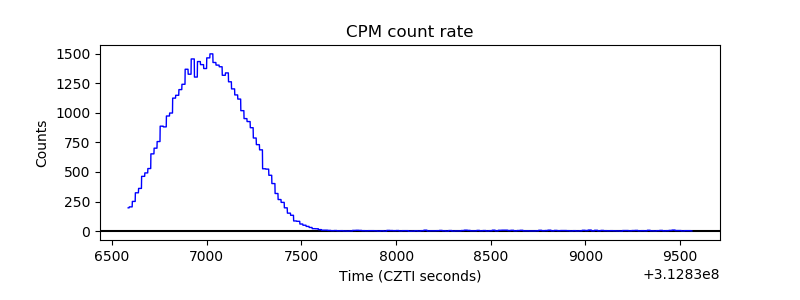 |
| CZT Counter | 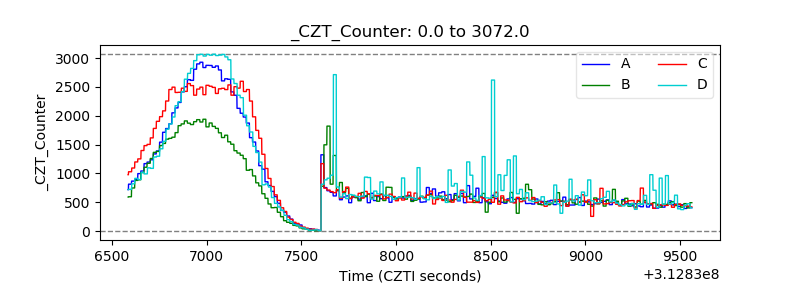 |
| +2.5 Volts monitor |  |
| +5 Volts monitor |  |
| _ROLL_ROT | 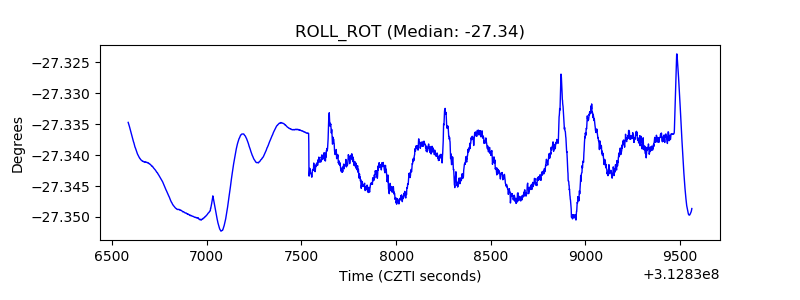 |
| _Roll_DEC | 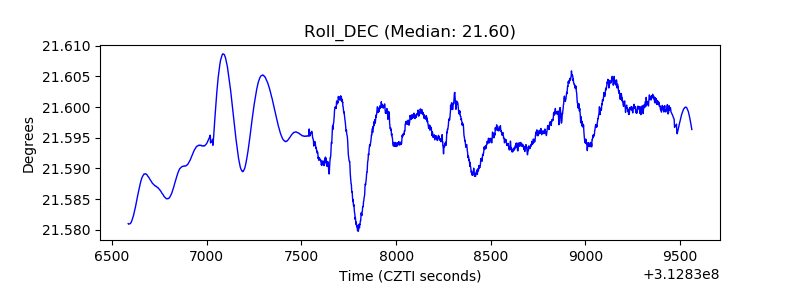 |
| _Roll_RA | 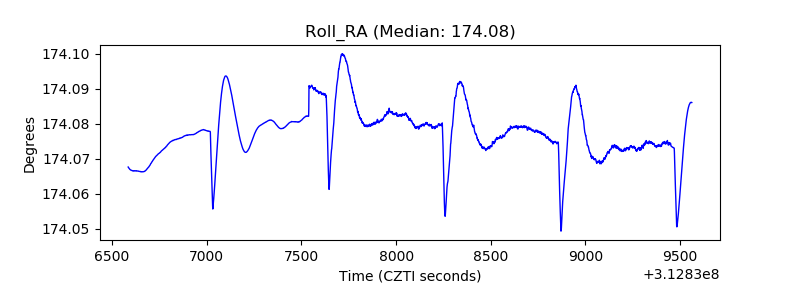 |
| Veto Counter | 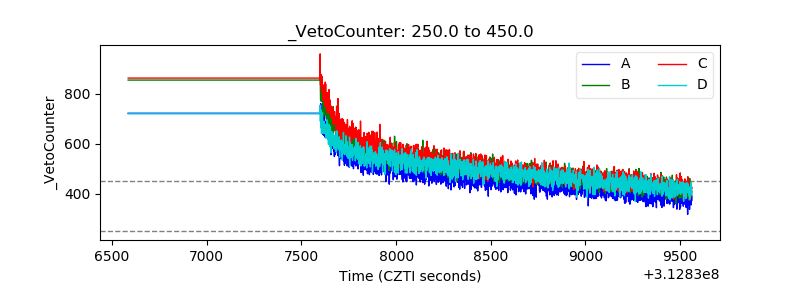 |