| Param | Original file | Final file |
|---|---|---|
| Filename | modeM0/AS1A07_054T01_9000003348cztM0_level2.fits | modeM0/AS1A07_054T01_9000003348cztM0_level2_quad_clean.evt |
| Size (bytes) | 687,271,680 | 768,600,000 |
| Size | 655.4 MB | 733.0 MB |
| Events in quadrant A | 4,225,390 | 4,840,142 |
| Events in quadrant B | 4,021,438 | 4,780,516 |
| Events in quadrant C | 4,155,022 | 4,587,426 |
| Events in quadrant D | 3,643,852 | 4,302,058 |
| Mode M9 | |||
|---|---|---|---|
| Quadrant | BADHDUFLAG | Total packets | Discarded packets |
| A | 0 | 111 | 0 |
| B | 0 | 111 | 0 |
| C | 0 | 111 | 0 |
| D | 0 | 111 | 0 |
| Mode SS | |||
|---|---|---|---|
| Quadrant | BADHDUFLAG | Total packets | Discarded packets |
| A | 0 | 1420 | 0 |
| B | 0 | 1420 | 0 |
| C | 0 | 1420 | 0 |
| D | 0 | 1420 | 0 |
| Mode M0 | |||
|---|---|---|---|
| Quadrant | BADHDUFLAG | Total packets | Discarded packets |
| A | 0 | 147025 | 0 |
| B | 0 | 149655 | 0 |
| C | 0 | 145849 | 0 |
| D | 0 | 154672 | 0 |
| Quadrant | Total seconds | Saturated seconds | Saturation percentage |
|---|---|---|---|
| A | 69532 | 602 | 0.865788% |
| B | 69532 | 1025 | 1.474141% |
| C | 69532 | 953 | 1.370592% |
| D | 69532 | 982 | 1.412299% |
Noise dominated data is calculated using 1-second bins in cleaned event files. If a bin has >2000 counts, and if more than 50% of those come from <1% of pixels, then it is considered to be noise-dominated and hence unusable.
| Quadrant | # 1 sec bins | Bins with >0 counts | Bins with >2000 counts | High rate bins dominated by noise | Noise dominated (total time) | Noise dominated (detector-on time) | Marked lightcurve |
|---|---|---|---|---|---|---|---|
| A | 80837 | 69532 | 0 | 0 | 0.00% | 0.00% | 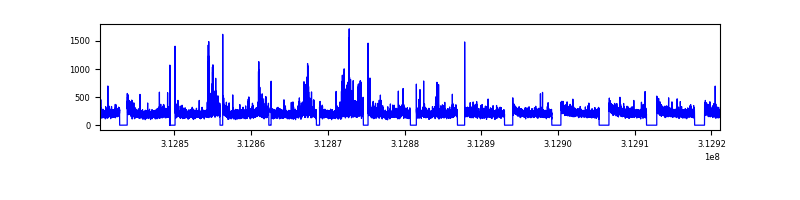 |
| B | 80837 | 69533 | 0 | 0 | 0.00% | 0.00% |  |
| C | 80836 | 69531 | 0 | 0 | 0.00% | 0.00% | 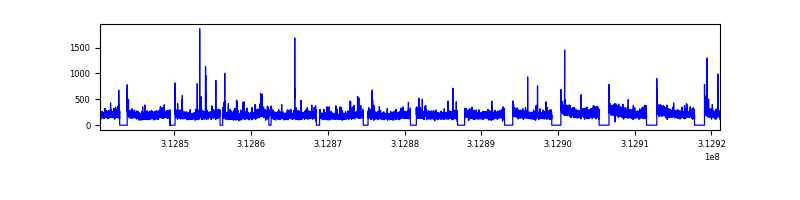 |
| D | 80836 | 69529 | 0 | 0 | 0.00% | 0.00% |  |
Top three noisy pixels from each quadrant. If the there are fewer than three noisy pixels in the level2.evt file, extra rows are filled as -1
| Pixel properties | Quadrant properties | ||||||
|---|---|---|---|---|---|---|---|
| Quadrant | DetID | PixID | Counts | Sigma | Mean | Median | Sigma |
| A | 0 | 29 | 4094 | 11.44 | 1099 | 1040 | 267.0 |
| A | 7 | 110 | 3473 | 9.11 | 1099 | 1040 | 267.0 |
| A | 0 | 30 | 3168 | 7.97 | 1099 | 1040 | 267.0 |
| B | 2 | 9 | 3228 | 10.55 | 1066 | 1021 | 209.2 |
| B | 2 | 8 | 2663 | 7.85 | 1066 | 1021 | 209.2 |
| B | 3 | 17 | 2622 | 7.65 | 1066 | 1021 | 209.2 |
| C | 1 | 81 | 3279 | 8.12 | 1097 | 1033 | 276.7 |
| C | 1 | 80 | 3145 | 7.63 | 1097 | 1033 | 276.7 |
| C | 12 | 241 | 2896 | 6.73 | 1097 | 1033 | 276.7 |
| D | 10 | 189 | 2622 | 6.08 | 1040 | 950 | 274.8 |
| D | 6 | 231 | 2585 | 5.95 | 1040 | 950 | 274.8 |
| D | 7 | 3 | 2585 | 5.95 | 1040 | 950 | 274.8 |
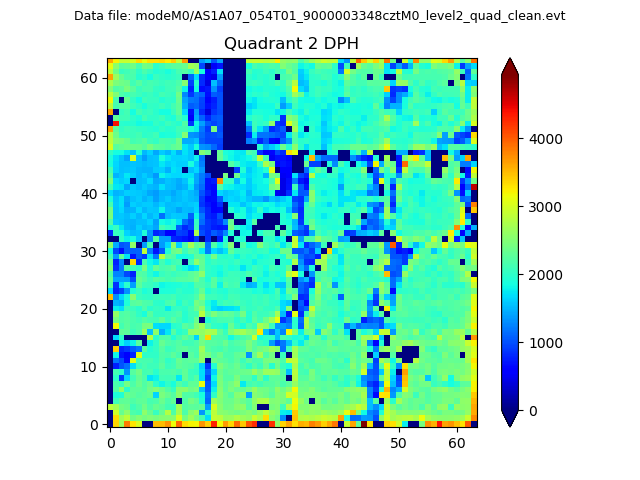
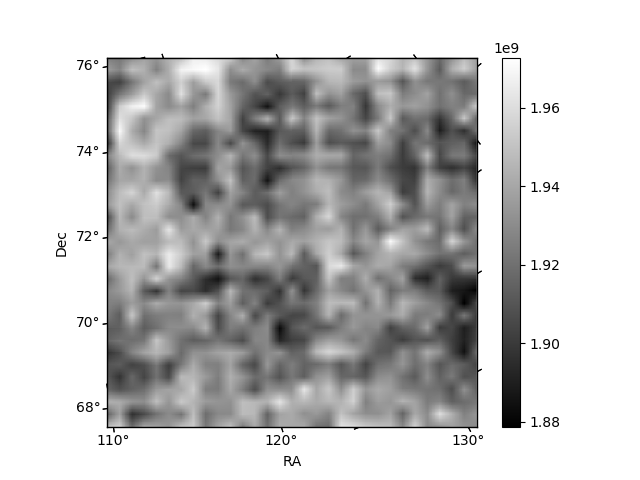
Histogram calculated using DETX and DETY for each event in the final _common_clean file
| Quadrant A | 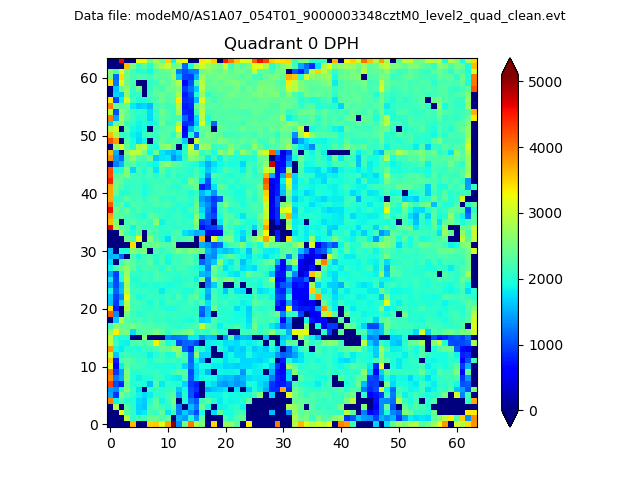 |
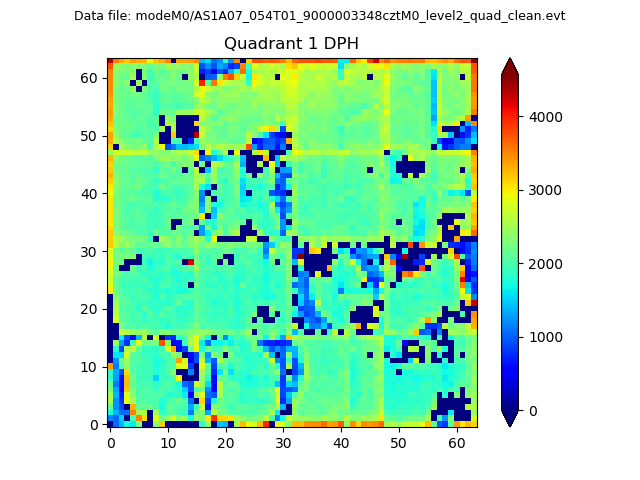 |
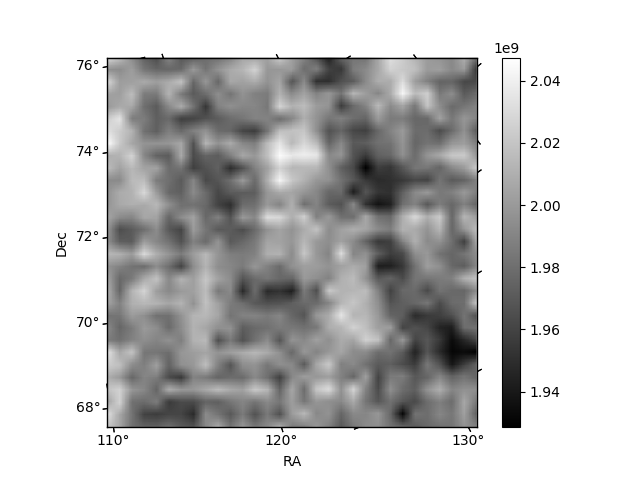
Quadrant B |
|---|---|---|---|
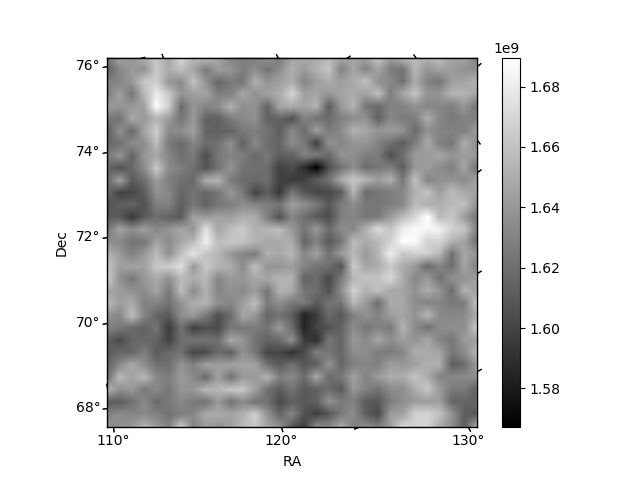
| Quadrant D | 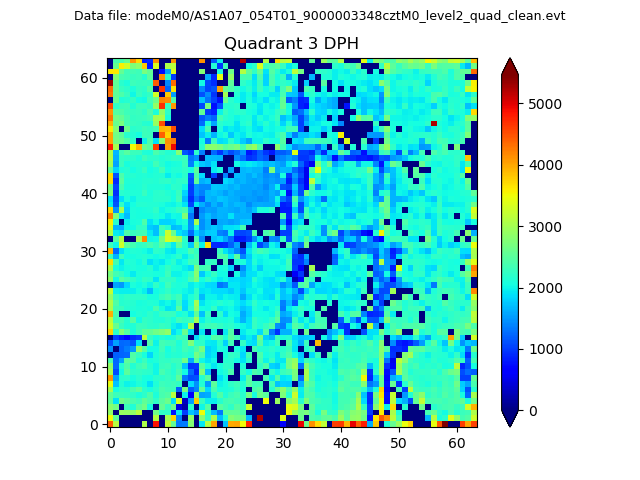 |
 |
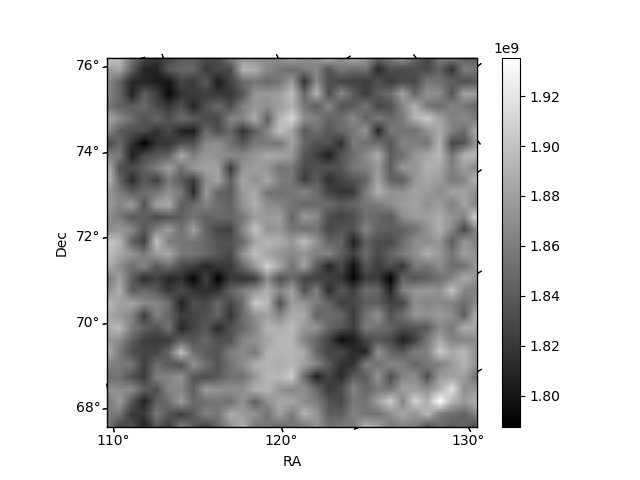
Quadrant C |
| Plot type | Count rate plots | Images |
|---|---|---|
| Comparison with Poisson distribution Blue bars denote a histogram of data divided into 1 sec bins. Red curve is a Poisson curve with rate = median count rate of data. |
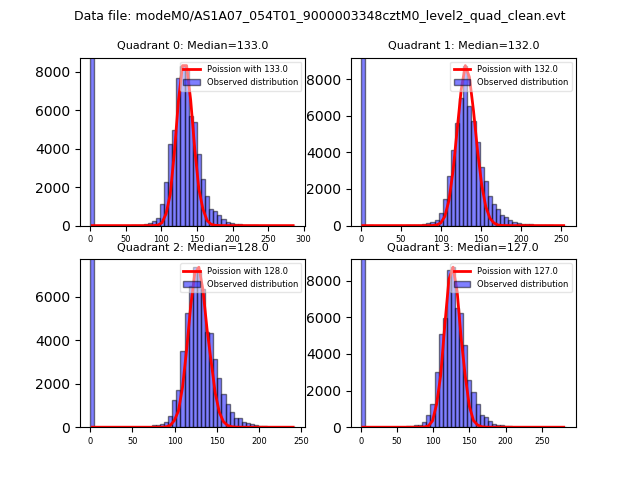 |
 |
| Quadrant-wise count rates Data is divided into 100 sec bins |
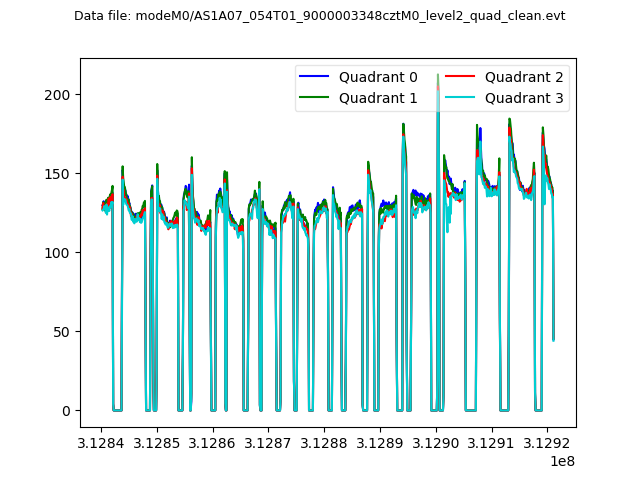 |
|
| Module-wise count rates for Quadrant A Data is divided into 100 sec bins |
 |
 |
| Module-wise count rates for Quadrant B Data is divided into 100 sec bins |
 |
 |
| Module-wise count rates for Quadrant C Data is divided into 100 sec bins |
 |
 |
| Module-wise count rates for Quadrant D Data is divided into 100 sec bins |
 |
 |
| Parameter | Plot |
|---|---|
| CZT HV Monitor | 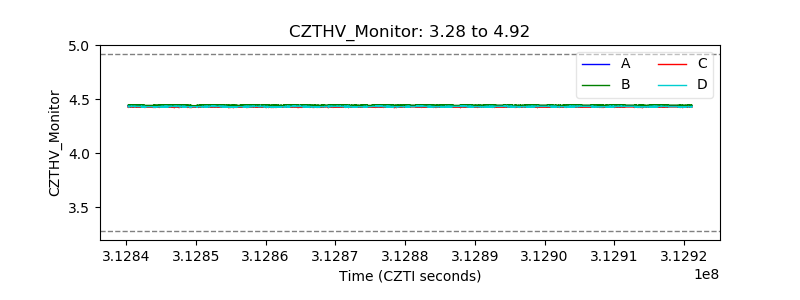 |
| D_VDD | 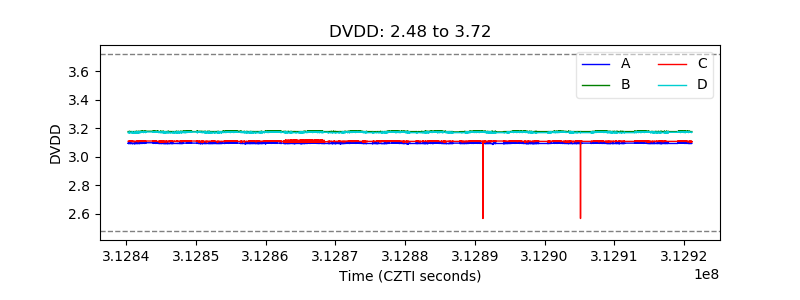 |
| Temperature 1 |  |
| Veto HV Monitor | 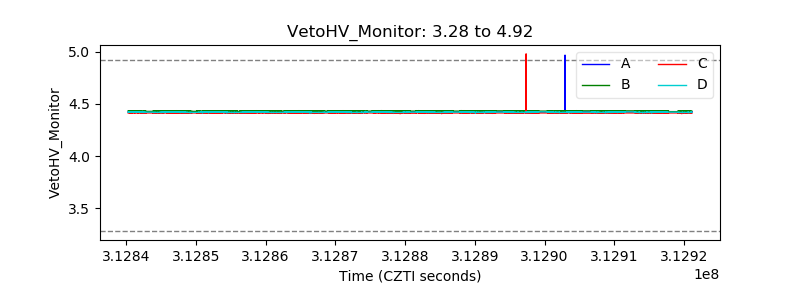 |
| Veto LLD |  |
| Alpha Counter | 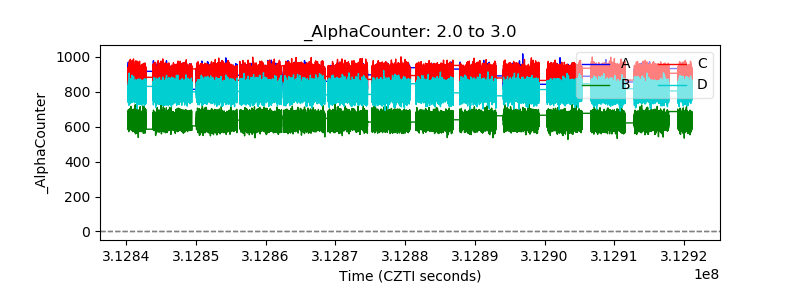 |
| _CPM_Rate | 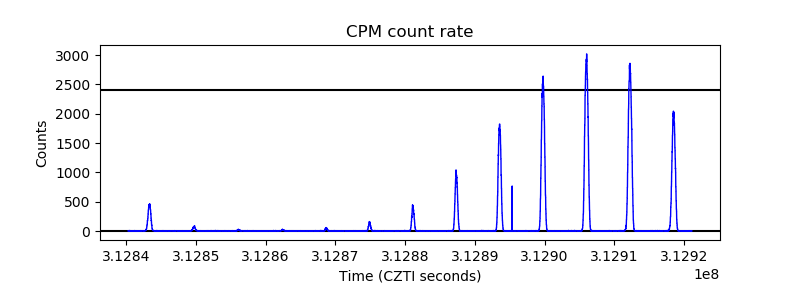 |
| CZT Counter | 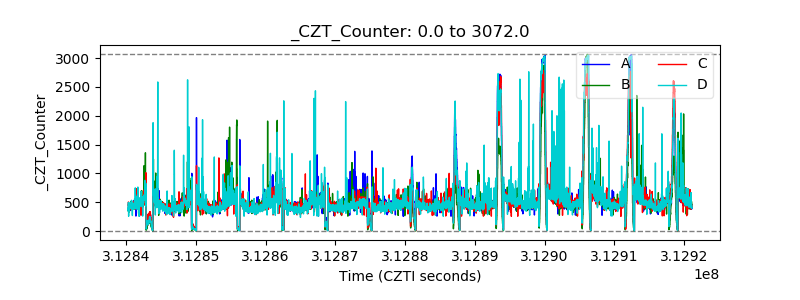 |
| +2.5 Volts monitor | 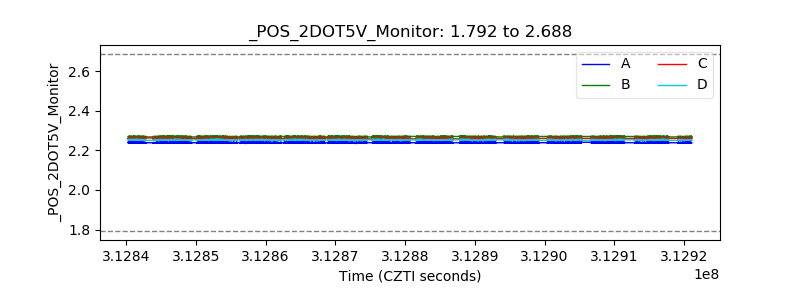 |
| +5 Volts monitor |  |
| _ROLL_ROT | 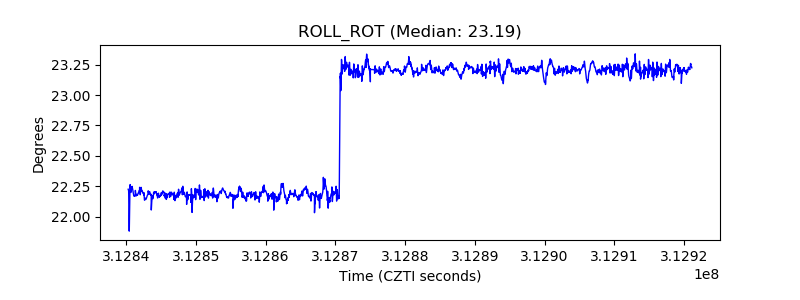 |
| _Roll_DEC | 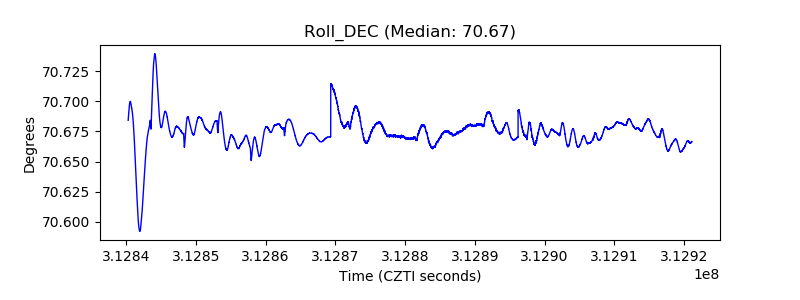 |
| _Roll_RA | 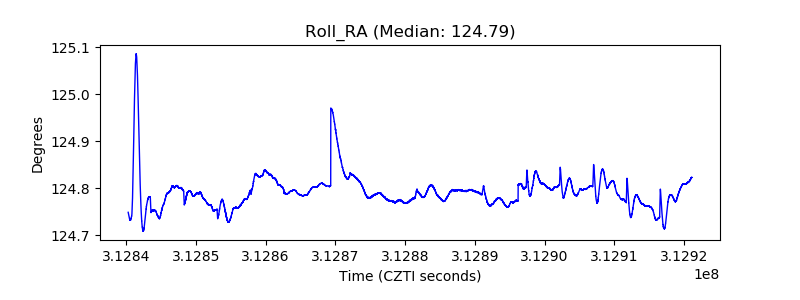 |
| Veto Counter | 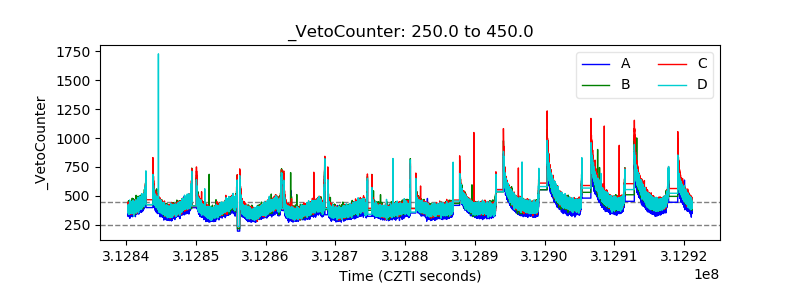 |