| Param | Original file | Final file |
|---|---|---|
| Filename | modeM0/AS1A07_054T01_9000003348_22569cztM0_level2.evt | modeM0/AS1A07_054T01_9000003348_22569cztM0_level2_quad_clean.evt |
| Size (bytes) | 457,413,120 | 118,730,880 |
| Size | 436.2 MB | 113.2 MB |
| Events in quadrant A | 3,254,842 | 788,505 |
| Events in quadrant B | 3,438,334 | 794,070 |
| Events in quadrant C | 3,272,523 | 773,331 |
| Events in quadrant D | 3,417,462 | 758,903 |
| Mode M9 | |||
|---|---|---|---|
| Quadrant | BADHDUFLAG | Total packets | Discarded packets |
| A | 0 | 13 | 0 |
| B | 0 | 14 | 0 |
| C | 0 | 14 | 0 |
| D | 0 | 14 | 0 |
| Mode SS | |||
|---|---|---|---|
| Quadrant | BADHDUFLAG | Total packets | Discarded packets |
| A | 0 | 142 | 0 |
| B | 0 | 142 | 0 |
| C | 0 | 142 | 0 |
| D | 0 | 142 | 0 |
| Mode M0 | |||
|---|---|---|---|
| Quadrant | BADHDUFLAG | Total packets | Discarded packets |
| A | 0 | 14388 | 3 |
| B | 0 | 14977 | 2 |
| C | 0 | 14281 | 2 |
| D | 0 | 15080 | 2 |
| Quadrant | Total seconds | Saturated seconds | Saturation percentage |
|---|---|---|---|
| A | 6910 | 29 | 0.419682% |
| B | 6910 | 96 | 1.389291% |
| C | 6910 | 93 | 1.345876% |
| D | 6910 | 72 | 1.041968% |
Noise dominated data is calculated using 1-second bins in cleaned event files. If a bin has >2000 counts, and if more than 50% of those come from <1% of pixels, then it is considered to be noise-dominated and hence unusable.
| Quadrant | # 1 sec bins | Bins with >0 counts | Bins with >2000 counts | High rate bins dominated by noise | Noise dominated (total time) | Noise dominated (detector-on time) | Marked lightcurve |
|---|---|---|---|---|---|---|---|
| A | 7605 | 6912 | 0 | 0 | 0.00% | 0.00% | 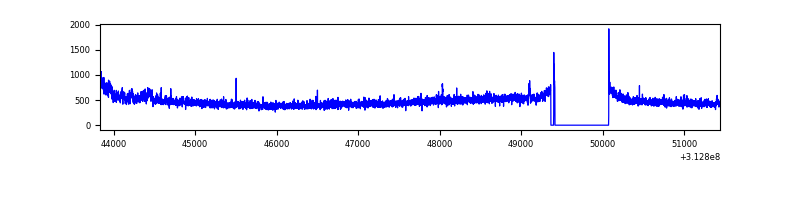 |
| B | 7605 | 6912 | 3 | 3 | 0.04% | 0.04% | 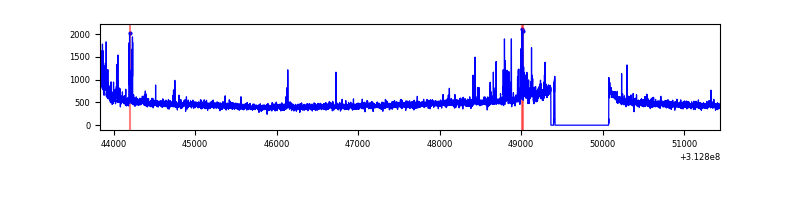 |
| C | 7605 | 6912 | 0 | 0 | 0.00% | 0.00% | 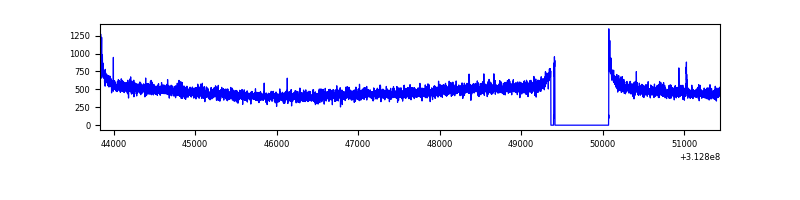 |
| D | 7605 | 6912 | 34 | 34 | 0.45% | 0.49% | 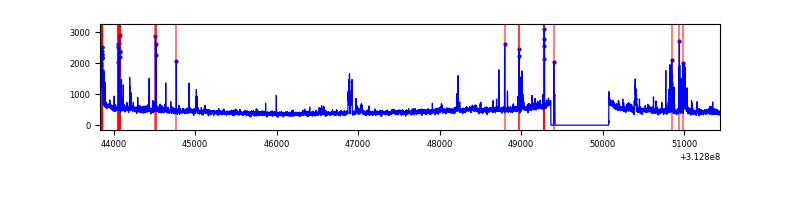 |
Top three noisy pixels from each quadrant. If the there are fewer than three noisy pixels in the level2.evt file, extra rows are filled as -1
| Pixel properties | Quadrant properties | ||||||
|---|---|---|---|---|---|---|---|
| Quadrant | DetID | PixID | Counts | Sigma | Mean | Median | Sigma |
| A | 13 | 34 | 94398 | 571.77 | 819 | 802 | 163.7 |
| A | 13 | 254 | 11908 | 67.85 | 819 | 802 | 163.7 |
| A | 0 | 226 | 7055 | 38.2 | 819 | 802 | 163.7 |
| B | 15 | 33 | 132129 | 839.86 | 821 | 800 | 156.4 |
| B | 15 | 35 | 26719 | 165.75 | 821 | 800 | 156.4 |
| B | 0 | 228 | 26040 | 161.41 | 821 | 800 | 156.4 |
| C | 14 | 238 | 125740 | 671.86 | 799 | 803 | 186.0 |
| C | 10 | 222 | 15392 | 78.45 | 799 | 803 | 186.0 |
| C | 0 | 10 | 13561 | 68.61 | 799 | 803 | 186.0 |
| D | 1 | 52 | 114677 | 587.84 | 802 | 780 | 193.8 |
| D | 2 | 136 | 98479 | 504.24 | 802 | 780 | 193.8 |
| D | 2 | 153 | 60079 | 306.05 | 802 | 780 | 193.8 |
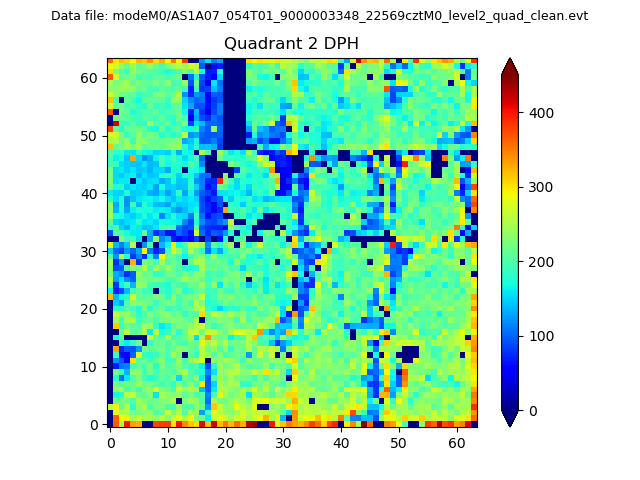
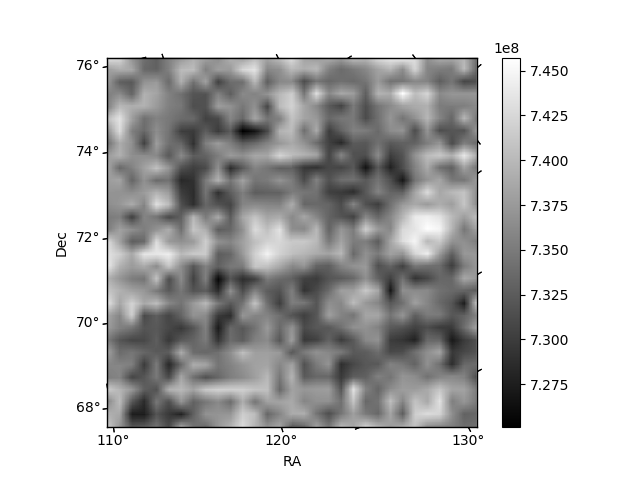
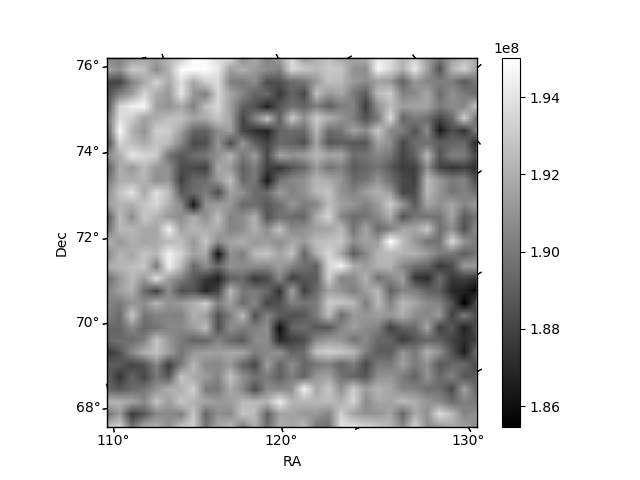
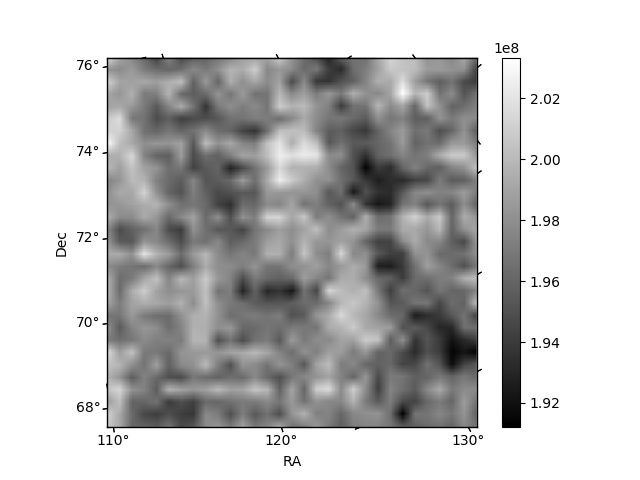
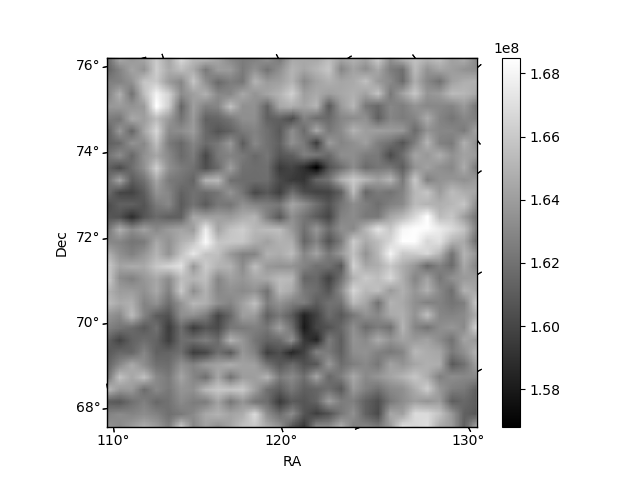
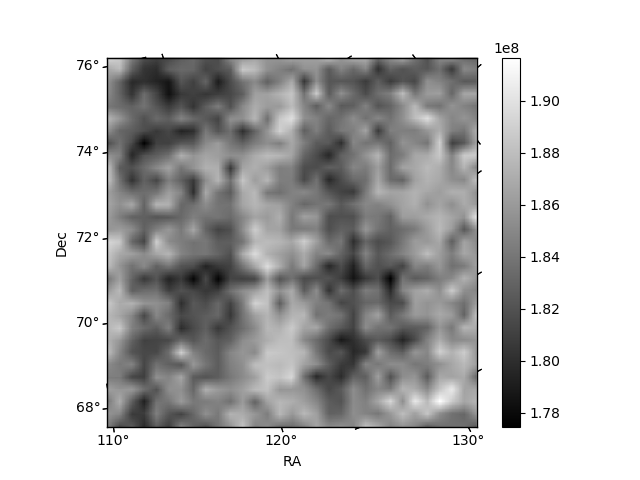
Histogram calculated using DETX and DETY for each event in the final _common_clean file
| Quadrant A | 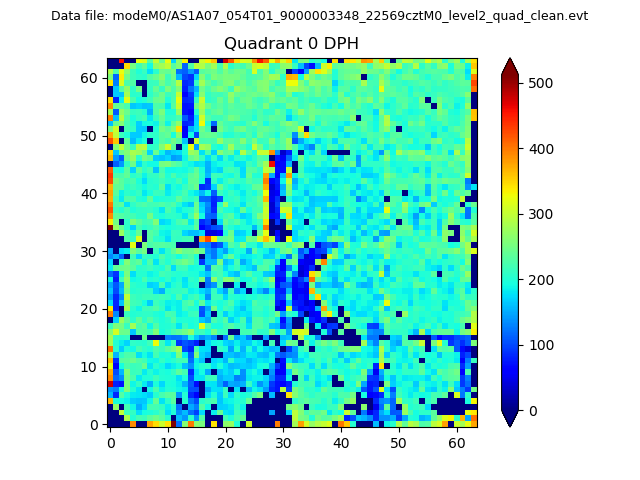 |
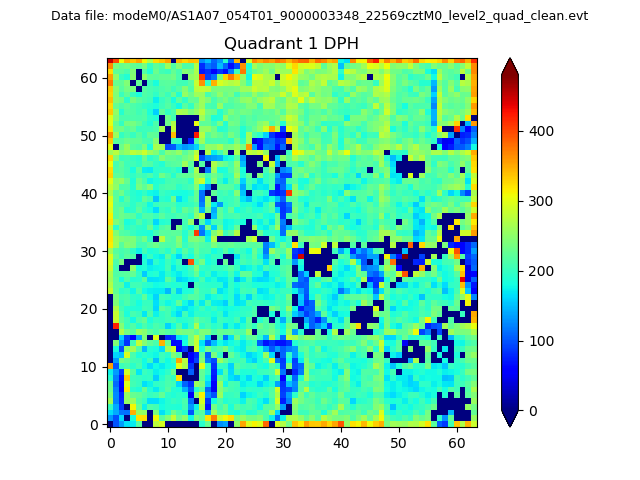 |
Quadrant B |
|---|---|---|---|
| Quadrant D | 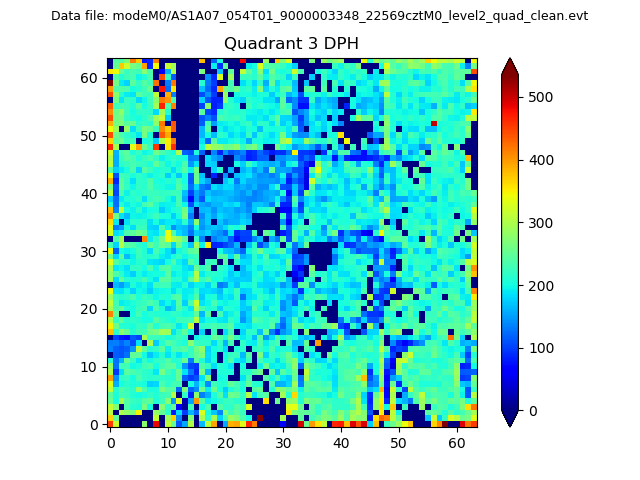 |
 |
Quadrant C |
| Plot type | Count rate plots | Images |
|---|---|---|
| Comparison with Poisson distribution Blue bars denote a histogram of data divided into 1 sec bins. Red curve is a Poisson curve with rate = median count rate of data. |
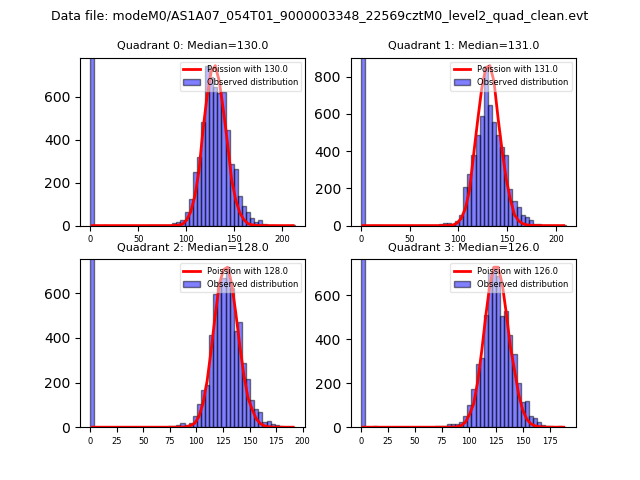 |
 |
| Quadrant-wise count rates Data is divided into 100 sec bins |
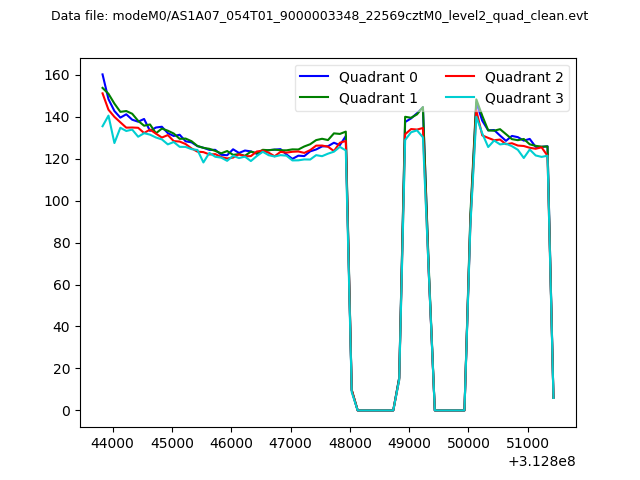 |
|
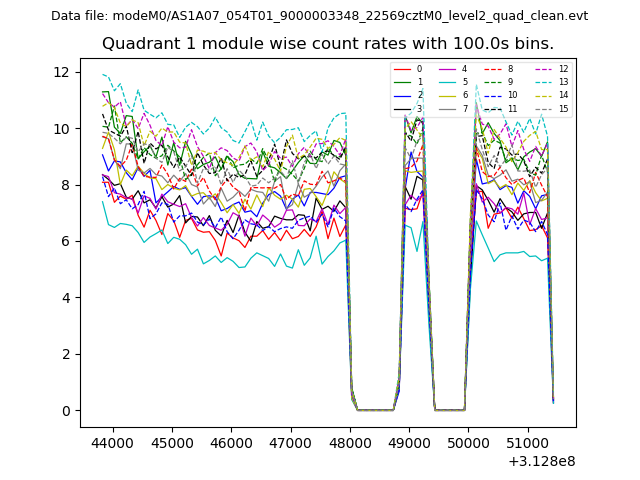
| Module-wise count rates for Quadrant A Data is divided into 100 sec bins |
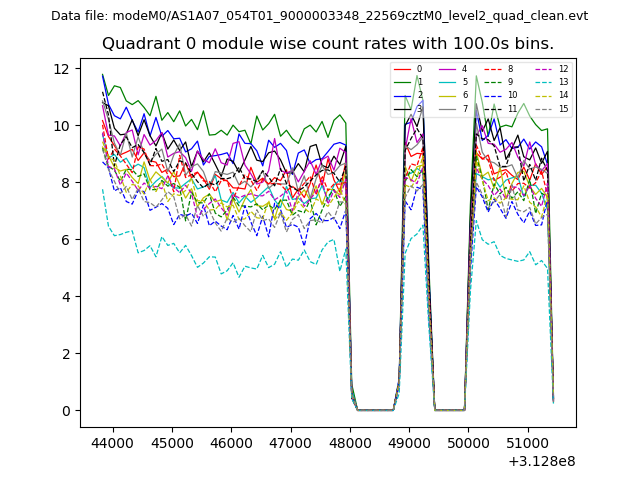 |
 |
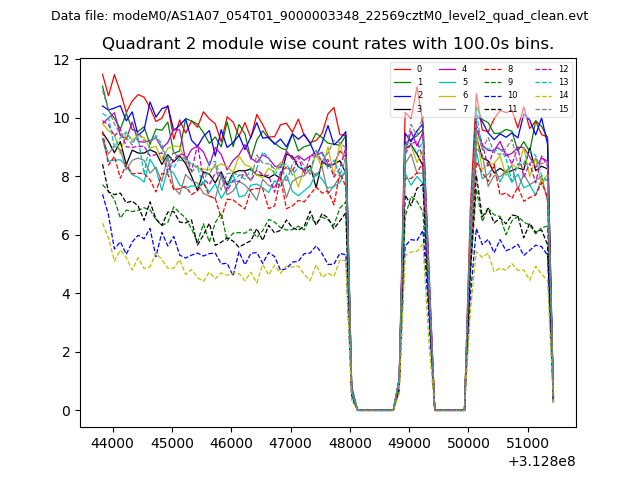
| Module-wise count rates for Quadrant B Data is divided into 100 sec bins |
 |
 |
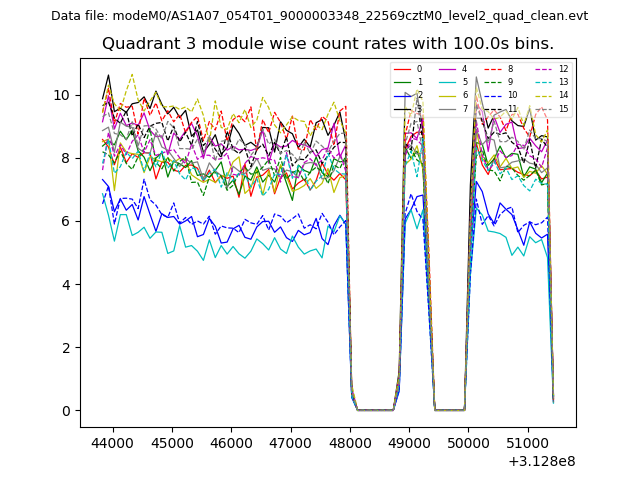
| Module-wise count rates for Quadrant C Data is divided into 100 sec bins |
 |
 |
| Module-wise count rates for Quadrant D Data is divided into 100 sec bins |
 |
 |
| Parameter | Plot |
|---|---|
| CZT HV Monitor | 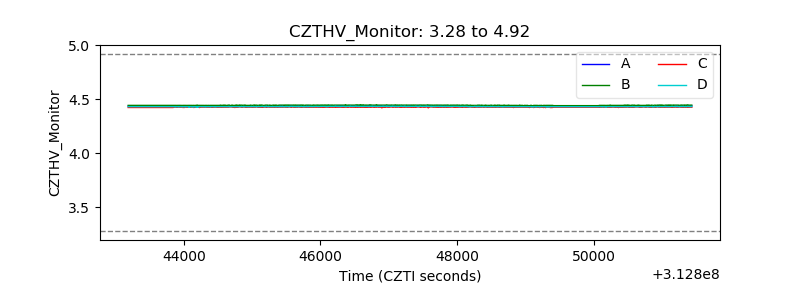 |
| D_VDD | 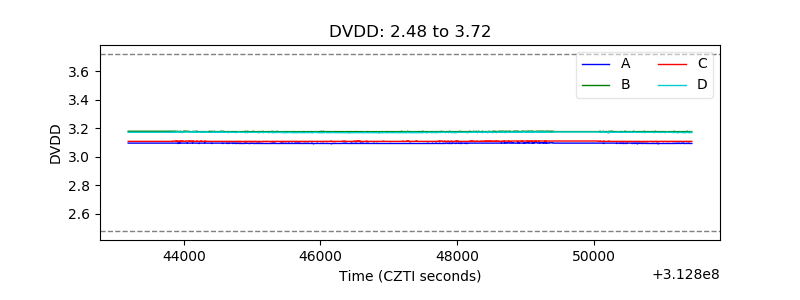 |
| Temperature 1 | 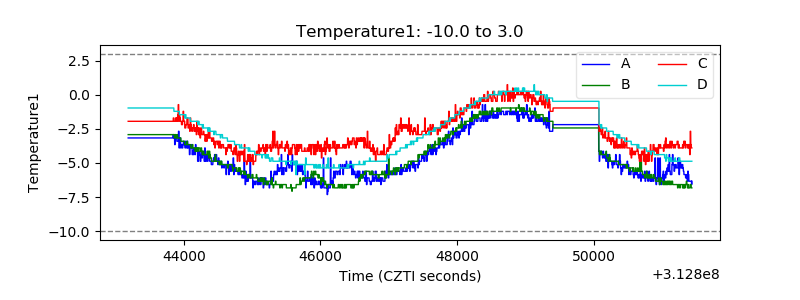 |
| Veto HV Monitor | 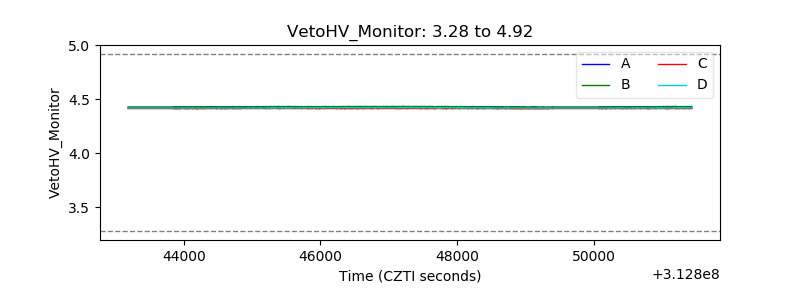 |
| Veto LLD | 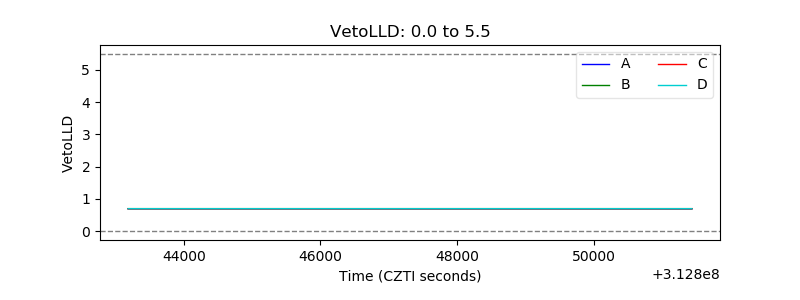 |
| Alpha Counter | 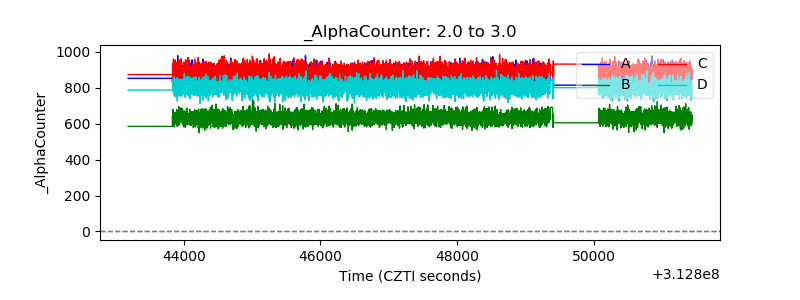 |
| _CPM_Rate | 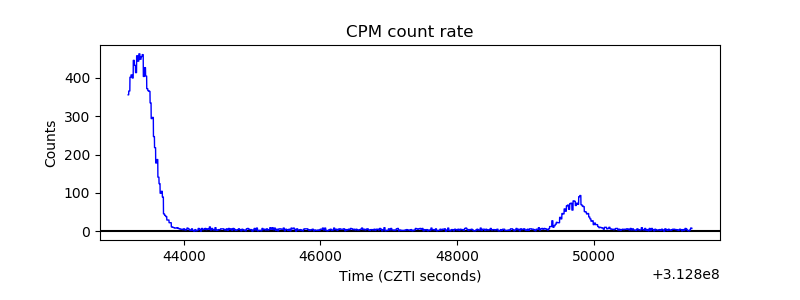 |
| CZT Counter |  |
| +2.5 Volts monitor |  |
| +5 Volts monitor |  |
| _ROLL_ROT | 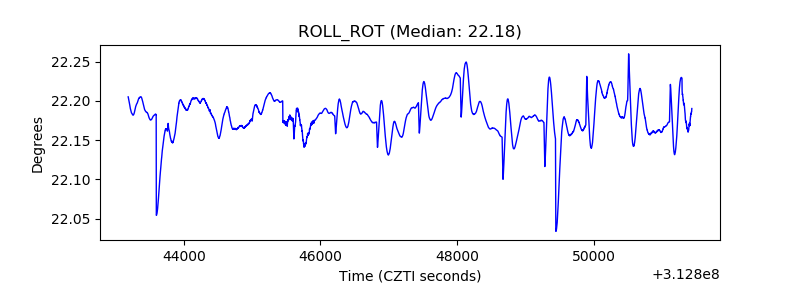 |
| _Roll_DEC |  |
| _Roll_RA | 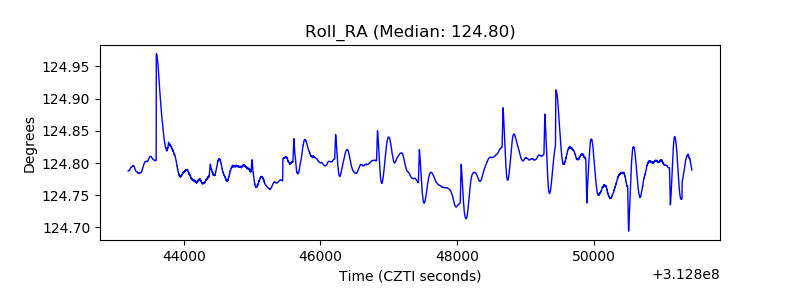 |
| Veto Counter | 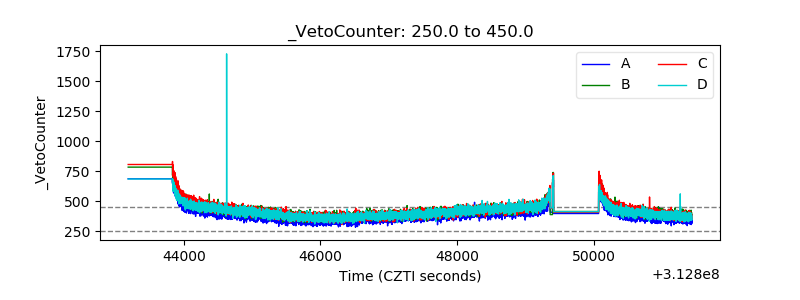 |