| Param | Original file | Final file |
|---|---|---|
| Filename | modeM0/AS1A07_054T01_9000003348_22570cztM0_level2.evt | modeM0/AS1A07_054T01_9000003348_22570cztM0_level2_quad_clean.evt |
| Size (bytes) | 487,051,200 | 125,061,120 |
| Size | 464.5 MB | 119.3 MB |
| Events in quadrant A | 3,537,334 | 830,454 |
| Events in quadrant B | 3,741,109 | 832,199 |
| Events in quadrant C | 3,481,567 | 810,750 |
| Events in quadrant D | 3,489,388 | 801,275 |
| Mode M9 | |||
|---|---|---|---|
| Quadrant | BADHDUFLAG | Total packets | Discarded packets |
| A | 0 | 8 | 0 |
| B | 0 | 9 | 0 |
| C | 0 | 9 | 0 |
| D | 0 | 9 | 0 |
| Mode SS | |||
|---|---|---|---|
| Quadrant | BADHDUFLAG | Total packets | Discarded packets |
| A | 0 | 154 | 0 |
| B | 0 | 154 | 0 |
| C | 0 | 154 | 0 |
| D | 0 | 154 | 0 |
| Mode M0 | |||
|---|---|---|---|
| Quadrant | BADHDUFLAG | Total packets | Discarded packets |
| A | 0 | 15710 | 2 |
| B | 0 | 16304 | 2 |
| C | 0 | 15356 | 2 |
| D | 0 | 15789 | 2 |
| Quadrant | Total seconds | Saturated seconds | Saturation percentage |
|---|---|---|---|
| A | 7366 | 37 | 0.502308% |
| B | 7366 | 115 | 1.561227% |
| C | 7366 | 74 | 1.004616% |
| D | 7366 | 35 | 0.475156% |
Noise dominated data is calculated using 1-second bins in cleaned event files. If a bin has >2000 counts, and if more than 50% of those come from <1% of pixels, then it is considered to be noise-dominated and hence unusable.
| Quadrant | # 1 sec bins | Bins with >0 counts | Bins with >2000 counts | High rate bins dominated by noise | Noise dominated (total time) | Noise dominated (detector-on time) | Marked lightcurve |
|---|---|---|---|---|---|---|---|
| A | 7711 | 7366 | 1 | 1 | 0.01% | 0.01% | 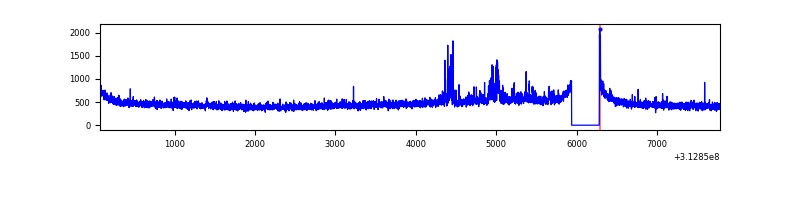 |
| B | 7711 | 7366 | 14 | 14 | 0.18% | 0.19% | 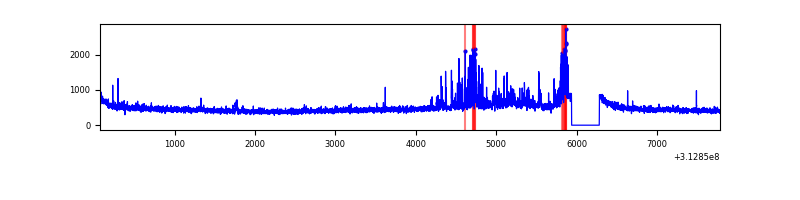 |
| C | 7711 | 7366 | 1 | 1 | 0.01% | 0.01% | 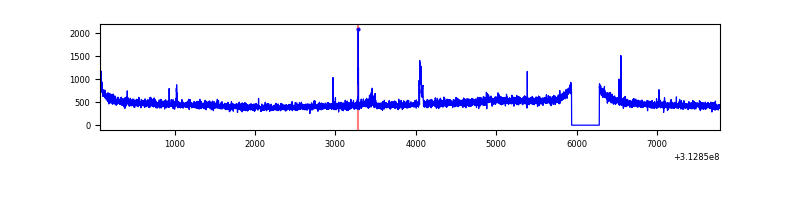 |
| D | 7711 | 7366 | 8 | 8 | 0.10% | 0.11% | 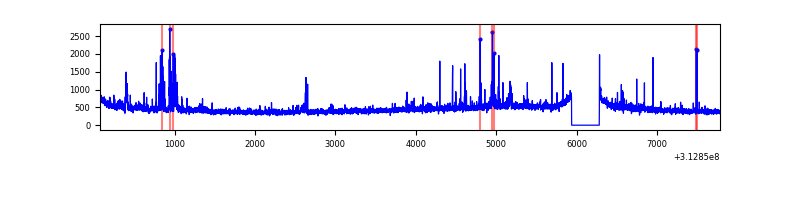 |
Top three noisy pixels from each quadrant. If the there are fewer than three noisy pixels in the level2.evt file, extra rows are filled as -1
| Pixel properties | Quadrant properties | ||||||
|---|---|---|---|---|---|---|---|
| Quadrant | DetID | PixID | Counts | Sigma | Mean | Median | Sigma |
| A | 13 | 34 | 194180 | 1103.22 | 867 | 848 | 175.2 |
| A | 13 | 254 | 13036 | 69.55 | 867 | 848 | 175.2 |
| A | 0 | 226 | 7554 | 38.27 | 867 | 848 | 175.2 |
| B | 15 | 33 | 243725 | 1462.19 | 866 | 843 | 166.1 |
| B | 15 | 35 | 35287 | 207.36 | 866 | 843 | 166.1 |
| B | 0 | 190 | 28395 | 165.87 | 866 | 843 | 166.1 |
| C | 14 | 238 | 132531 | 670.35 | 843 | 848 | 196.4 |
| C | 10 | 22 | 44904 | 224.27 | 843 | 848 | 196.4 |
| C | 0 | 239 | 12199 | 57.78 | 843 | 848 | 196.4 |
| D | 2 | 136 | 146229 | 705.5 | 849 | 824 | 206.1 |
| D | 1 | 52 | 54889 | 262.32 | 849 | 824 | 206.1 |
| D | 2 | 234 | 29804 | 140.61 | 849 | 824 | 206.1 |
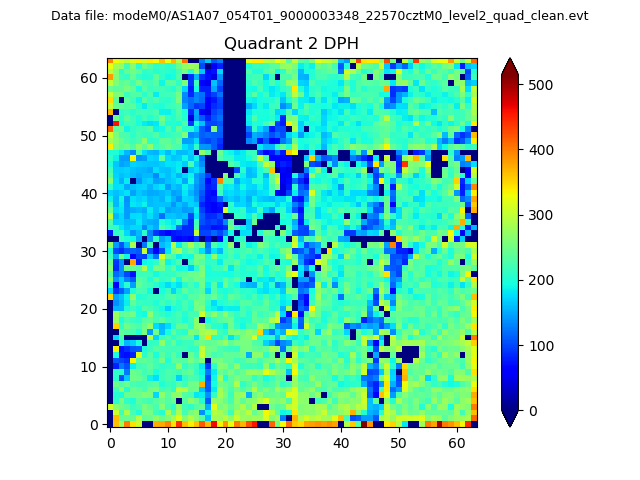
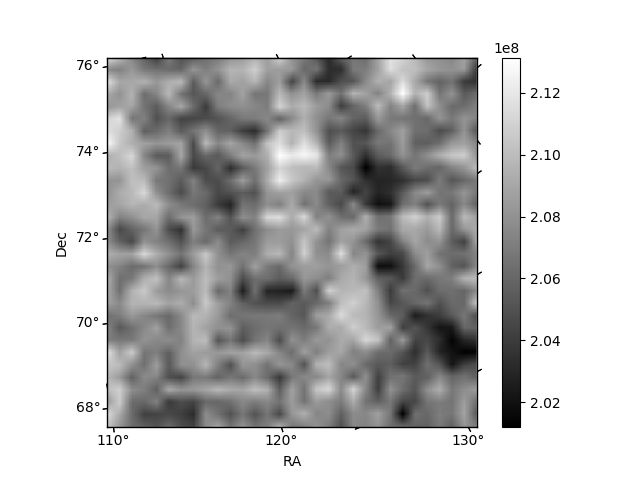
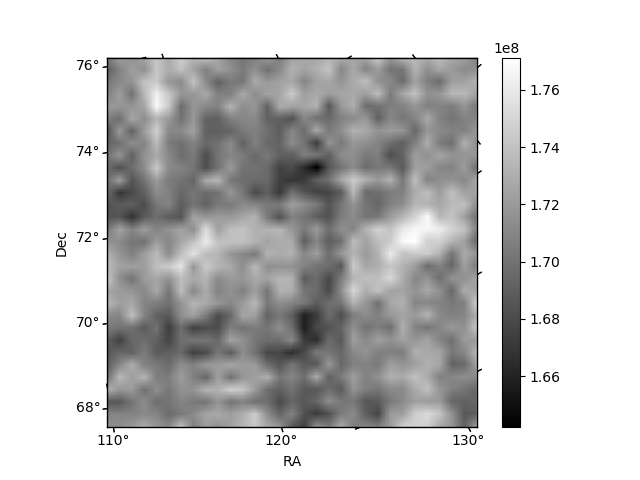
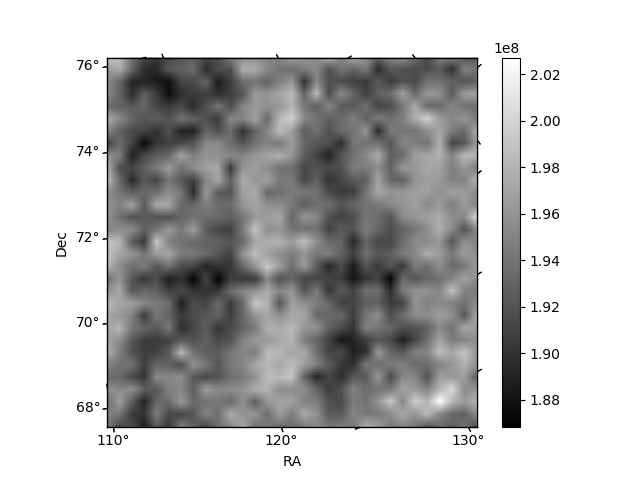
Histogram calculated using DETX and DETY for each event in the final _common_clean file
| Quadrant A | 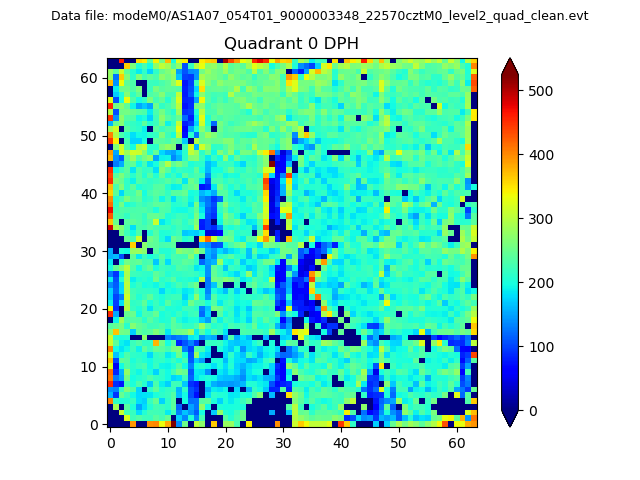 |
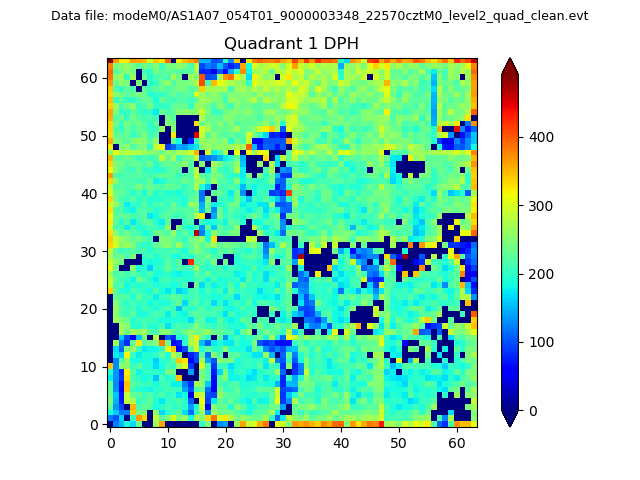 |
Quadrant B |
|---|---|---|---|
| Quadrant D | 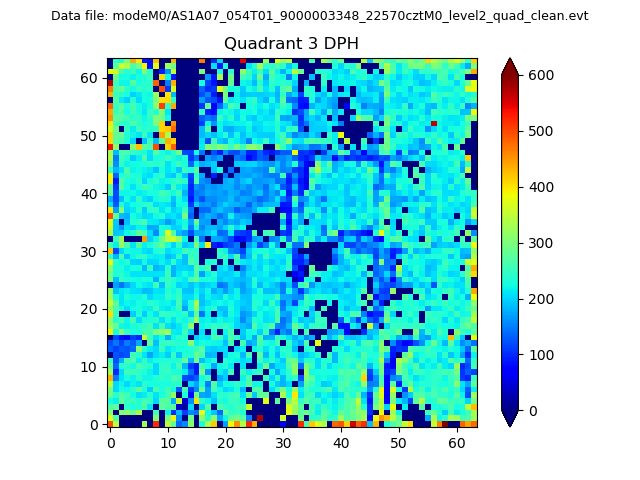 |
 |
Quadrant C |
| Plot type | Count rate plots | Images |
|---|---|---|
| Comparison with Poisson distribution Blue bars denote a histogram of data divided into 1 sec bins. Red curve is a Poisson curve with rate = median count rate of data. |
 |
 |
| Quadrant-wise count rates Data is divided into 100 sec bins |
 |
|
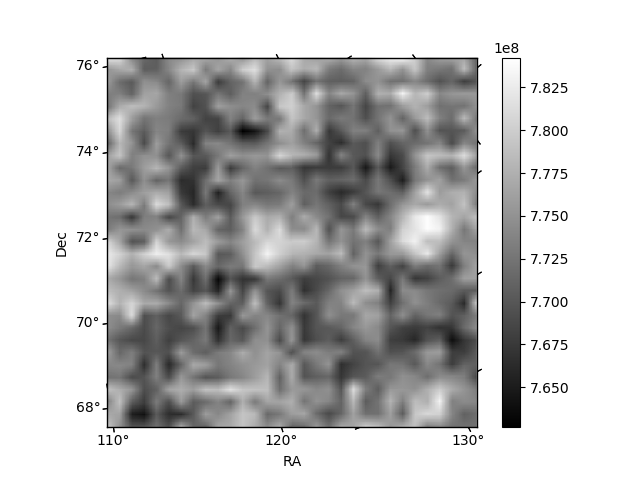
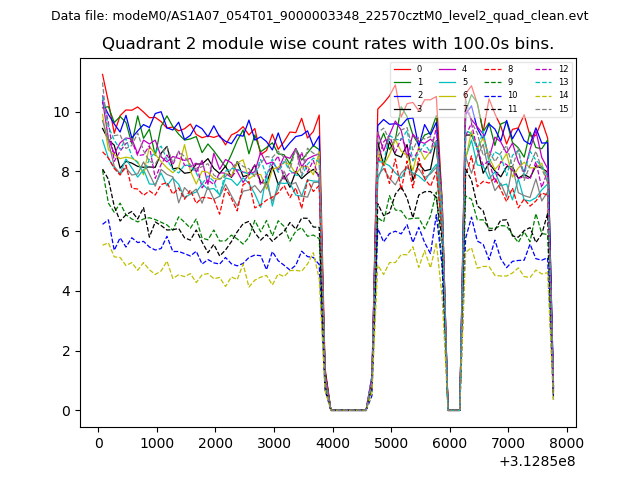
| Module-wise count rates for Quadrant A Data is divided into 100 sec bins |
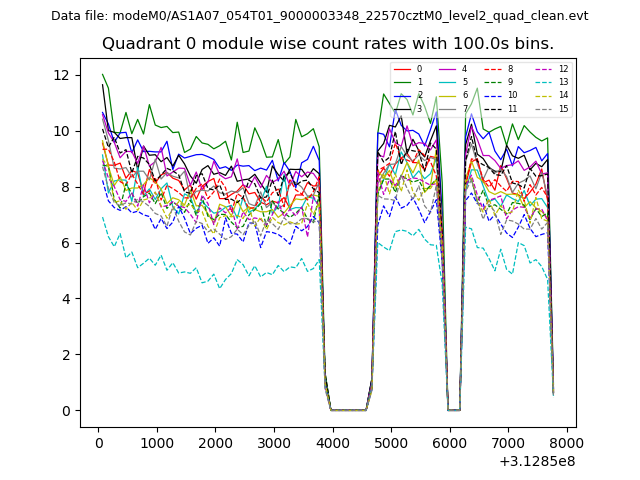 |
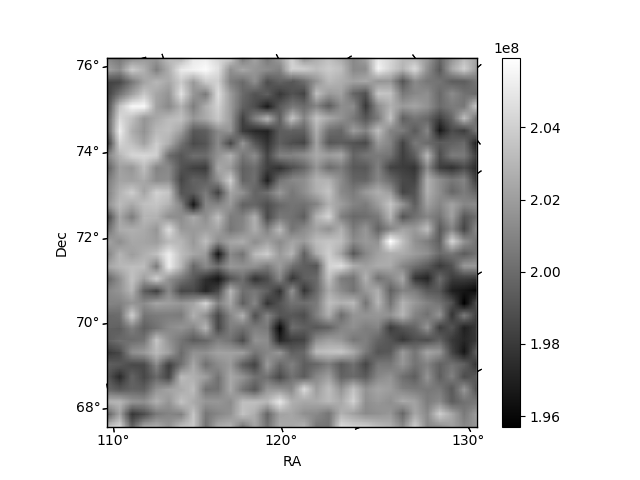 |
| Module-wise count rates for Quadrant B Data is divided into 100 sec bins |
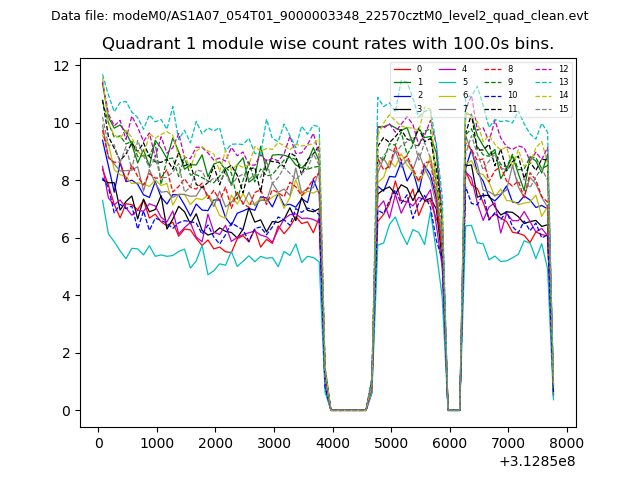 |
 |
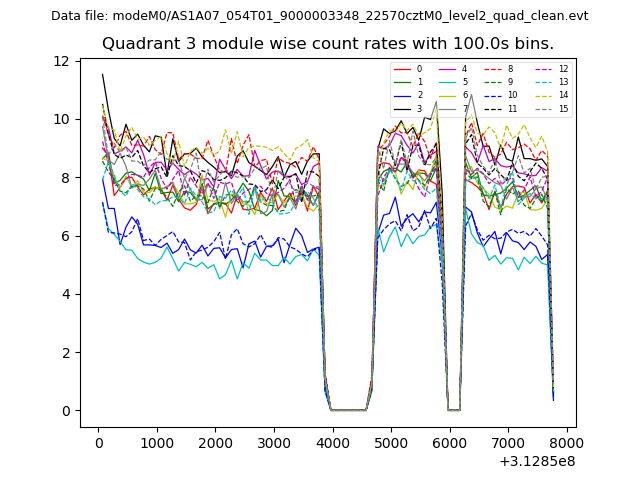
| Module-wise count rates for Quadrant C Data is divided into 100 sec bins |
 |
 |
| Module-wise count rates for Quadrant D Data is divided into 100 sec bins |
 |
 |
| Parameter | Plot |
|---|---|
| CZT HV Monitor | 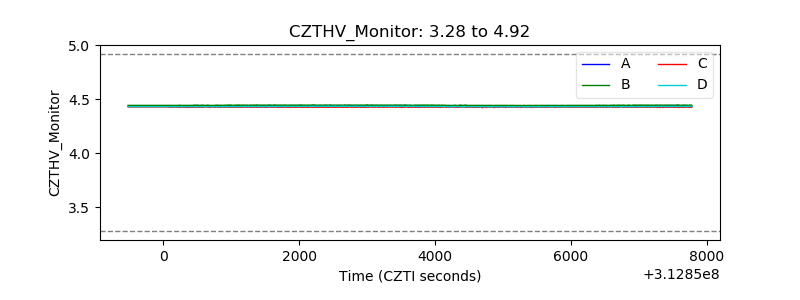 |
| D_VDD | 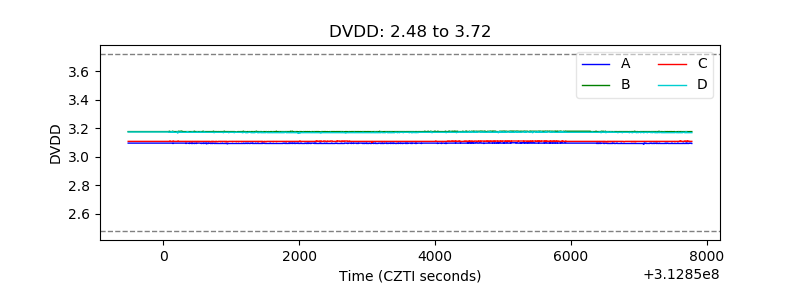 |
| Temperature 1 | 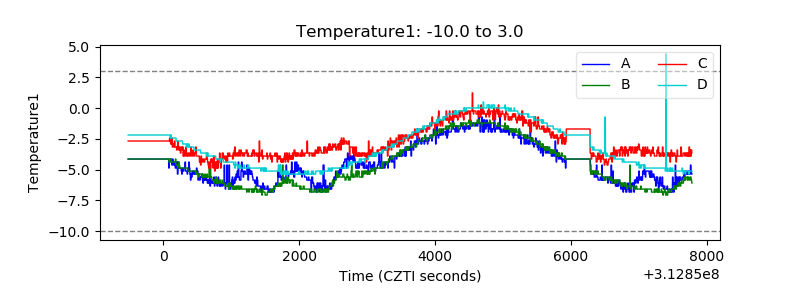 |
| Veto HV Monitor | 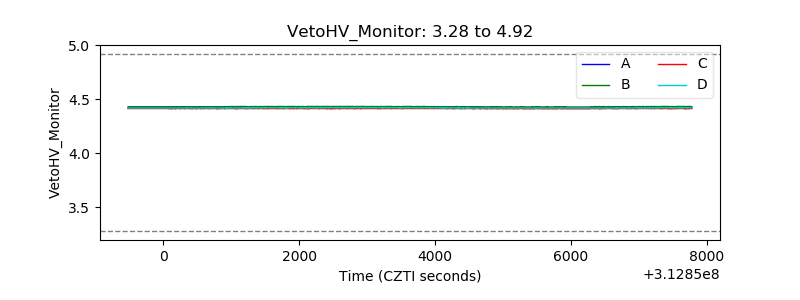 |
| Veto LLD | 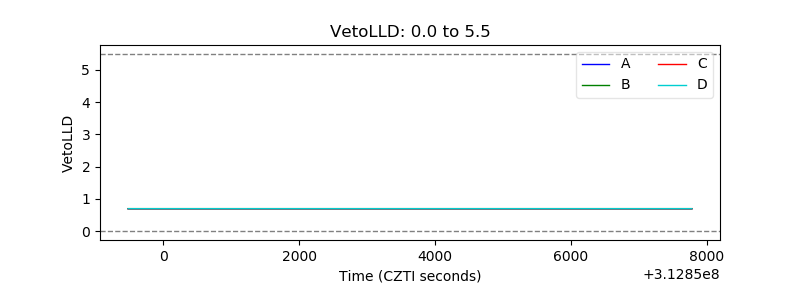 |
| Alpha Counter | 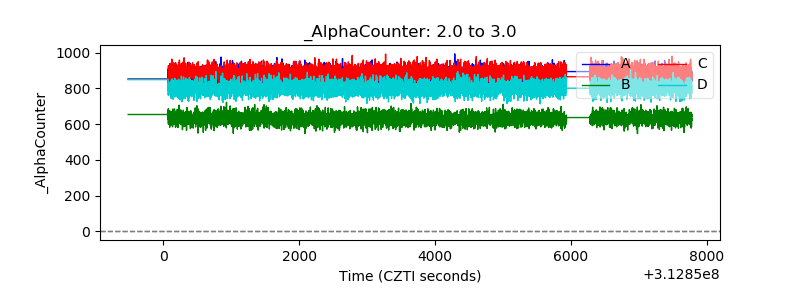 |
| _CPM_Rate |  |
| CZT Counter | 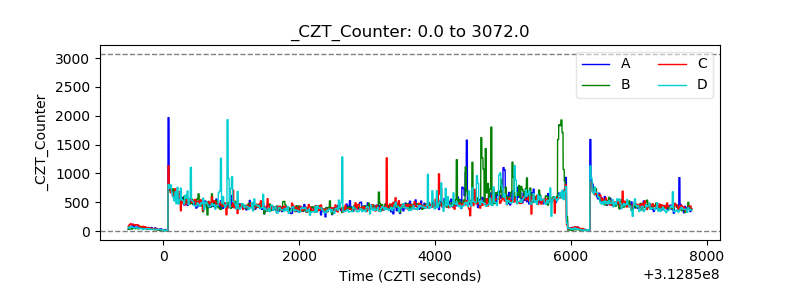 |
| +2.5 Volts monitor |  |
| +5 Volts monitor |  |
| _ROLL_ROT | 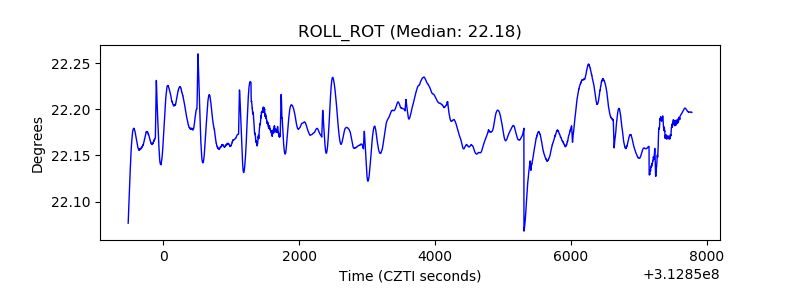 |
| _Roll_DEC | 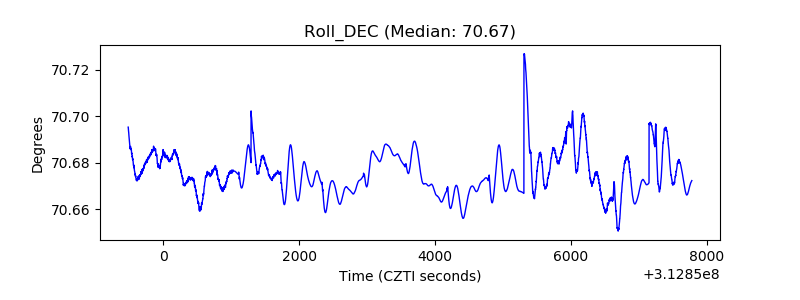 |
| _Roll_RA | 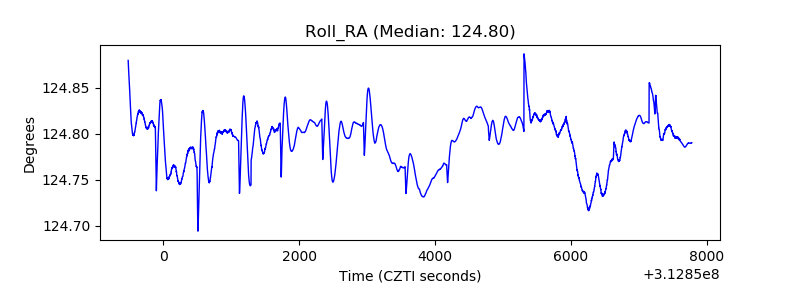 |
| Veto Counter | 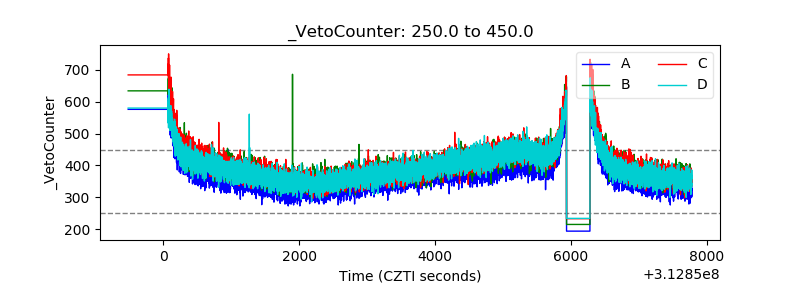 |