| Param | Original file | Final file |
|---|---|---|
| Filename | modeM0/AS1A07_054T01_9000003348_22574cztM0_level2.evt | modeM0/AS1A07_054T01_9000003348_22574cztM0_level2_quad_clean.evt |
| Size (bytes) | 1,184,909,760 | 302,515,200 |
| Size | 1.1 GB | 288.5 MB |
| Events in quadrant A | 9,060,328 | 1,998,100 |
| Events in quadrant B | 8,600,722 | 2,014,098 |
| Events in quadrant C | 8,510,891 | 1,942,549 |
| Events in quadrant D | 8,459,488 | 1,932,210 |
| Mode M9 | |||
|---|---|---|---|
| Quadrant | BADHDUFLAG | Total packets | Discarded packets |
| A | 0 | 18 | 0 |
| B | 0 | 18 | 0 |
| C | 0 | 18 | 0 |
| D | 0 | 18 | 0 |
| Mode SS | |||
|---|---|---|---|
| Quadrant | BADHDUFLAG | Total packets | Discarded packets |
| A | 0 | 376 | 0 |
| B | 0 | 376 | 0 |
| C | 0 | 376 | 0 |
| D | 0 | 376 | 0 |
| Mode M0 | |||
|---|---|---|---|
| Quadrant | BADHDUFLAG | Total packets | Discarded packets |
| A | 0 | 39359 | 3 |
| B | 0 | 37849 | 3 |
| C | 0 | 37672 | 3 |
| D | 0 | 38452 | 3 |
| Quadrant | Total seconds | Saturated seconds | Saturation percentage |
|---|---|---|---|
| A | 18527 | 150 | 0.809629% |
| B | 18528 | 162 | 0.874352% |
| C | 18528 | 166 | 0.895941% |
| D | 18528 | 123 | 0.663860% |
Noise dominated data is calculated using 1-second bins in cleaned event files. If a bin has >2000 counts, and if more than 50% of those come from <1% of pixels, then it is considered to be noise-dominated and hence unusable.
| Quadrant | # 1 sec bins | Bins with >0 counts | Bins with >2000 counts | High rate bins dominated by noise | Noise dominated (total time) | Noise dominated (detector-on time) | Marked lightcurve |
|---|---|---|---|---|---|---|---|
| A | 20352 | 18530 | 0 | 0 | 0.00% | 0.00% | 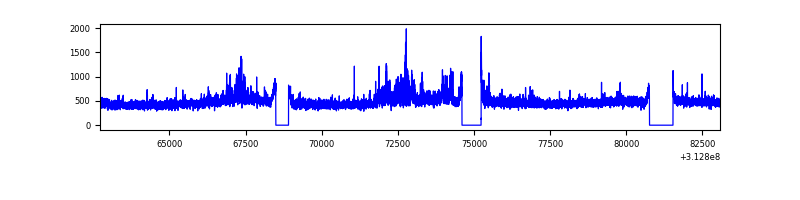 |
| B | 20353 | 18531 | 6 | 6 | 0.03% | 0.03% | 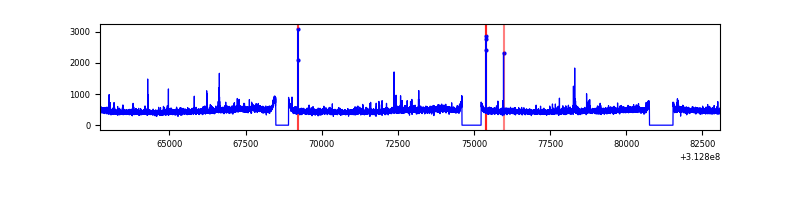 |
| C | 20353 | 18531 | 4 | 4 | 0.02% | 0.02% | 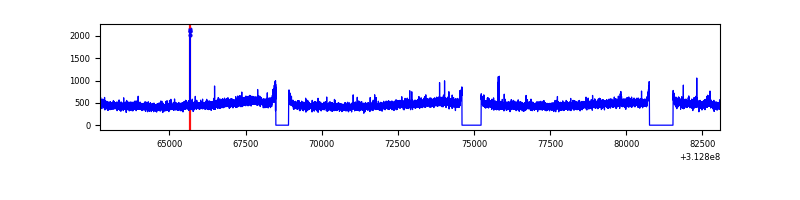 |
| D | 20353 | 18531 | 34 | 34 | 0.17% | 0.18% | 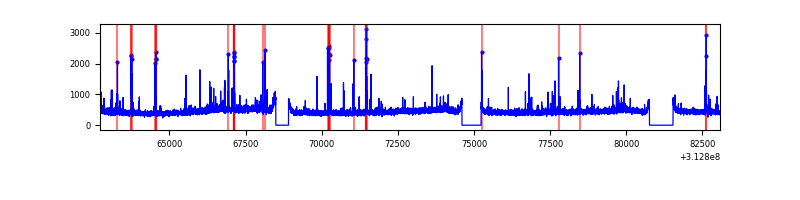 |
Top three noisy pixels from each quadrant. If the there are fewer than three noisy pixels in the level2.evt file, extra rows are filled as -1
| Pixel properties | Quadrant properties | ||||||
|---|---|---|---|---|---|---|---|
| Quadrant | DetID | PixID | Counts | Sigma | Mean | Median | Sigma |
| A | 13 | 34 | 715253 | 1648.88 | 2163 | 2117 | 432.5 |
| A | 13 | 254 | 30459 | 65.53 | 2163 | 2117 | 432.5 |
| A | 3 | 137 | 18910 | 38.83 | 2163 | 2117 | 432.5 |
| B | 12 | 111 | 50348 | 119.72 | 2152 | 2096 | 403.0 |
| B | 11 | 111 | 44351 | 104.84 | 2152 | 2096 | 403.0 |
| B | 0 | 230 | 41654 | 98.15 | 2152 | 2096 | 403.0 |
| C | 14 | 238 | 326766 | 673.71 | 2075 | 2083 | 481.9 |
| C | 10 | 222 | 41056 | 80.87 | 2075 | 2083 | 481.9 |
| C | 10 | 22 | 24053 | 45.59 | 2075 | 2083 | 481.9 |
| D | 12 | 0 | 143096 | 276.05 | 2106 | 2042 | 511.0 |
| D | 2 | 136 | 139218 | 268.46 | 2106 | 2042 | 511.0 |
| D | 1 | 52 | 119102 | 229.1 | 2106 | 2042 | 511.0 |
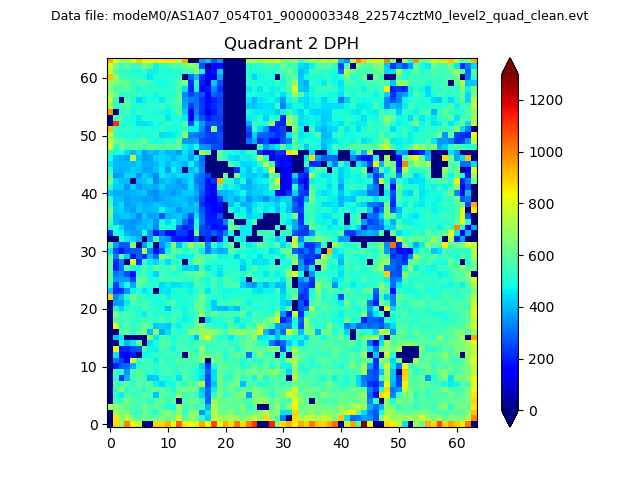
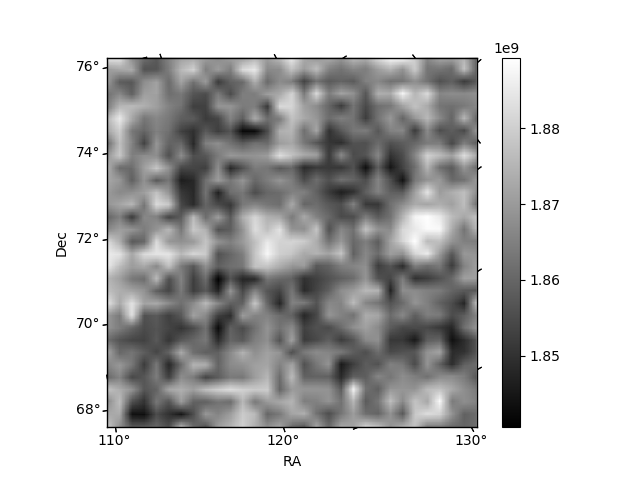
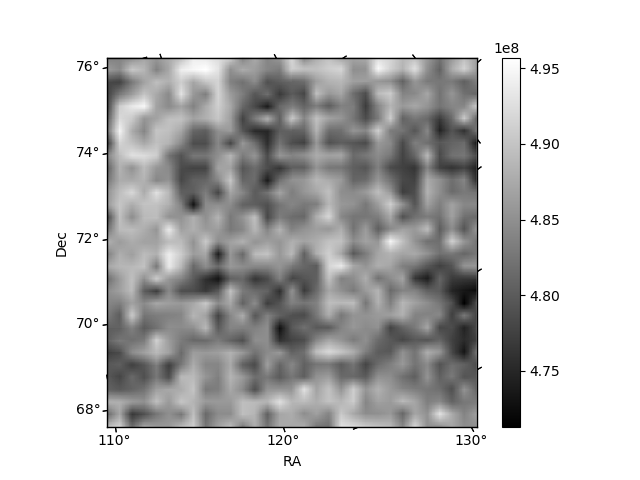
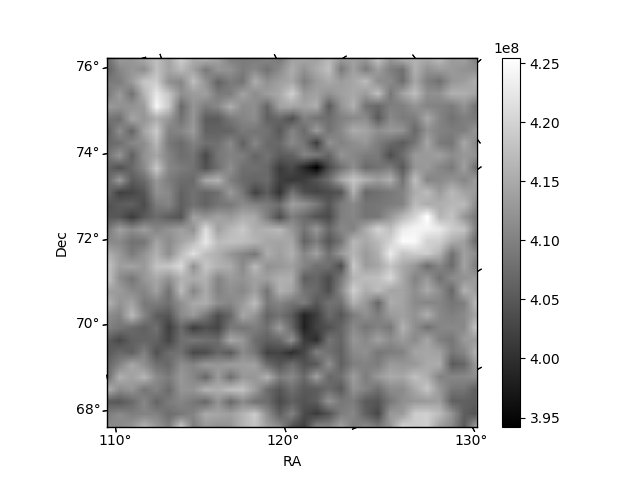
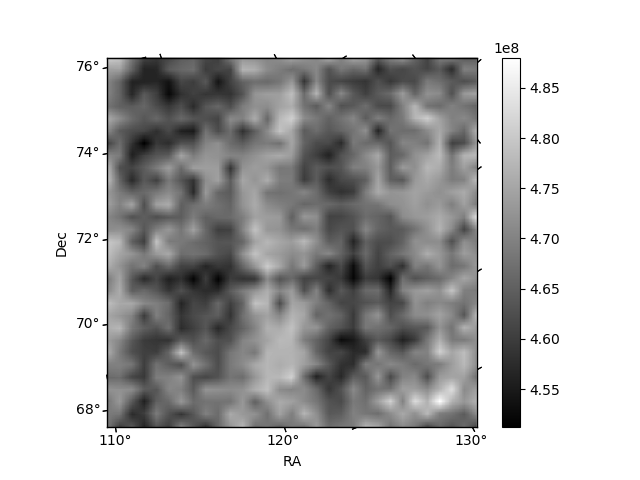
Histogram calculated using DETX and DETY for each event in the final _common_clean file
| Quadrant A | 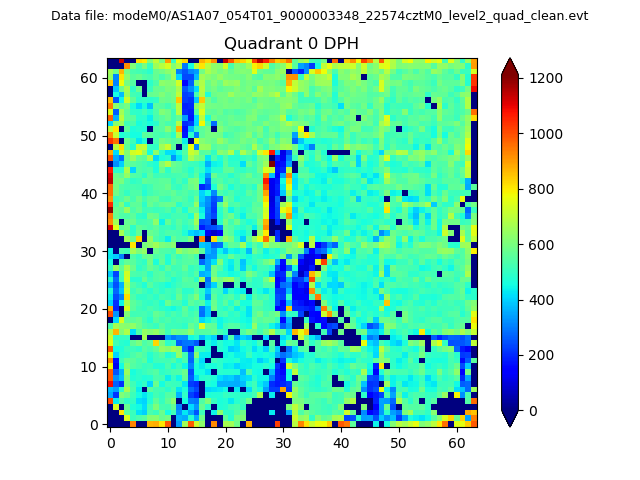 |
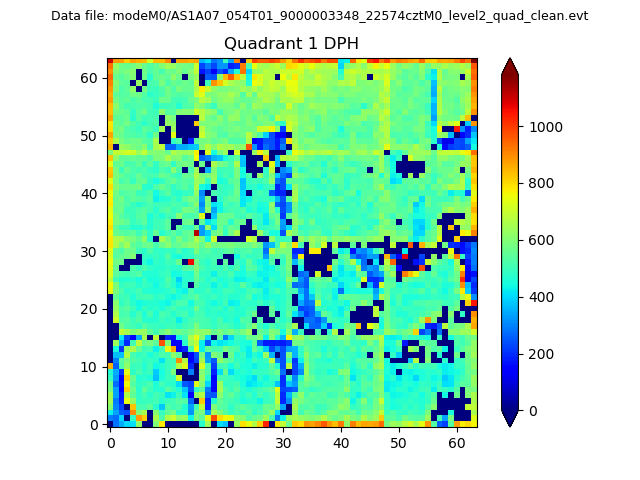 |
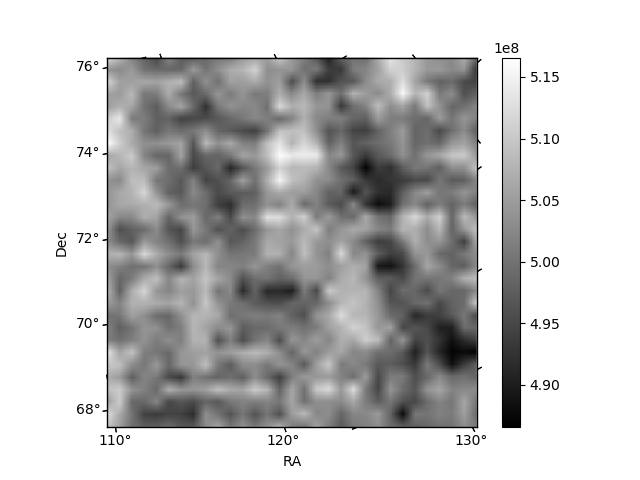
Quadrant B |
|---|---|---|---|
| Quadrant D | 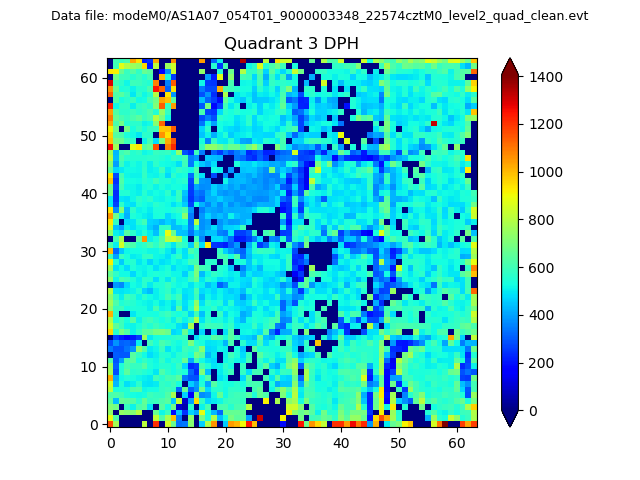 |
 |
Quadrant C |
| Plot type | Count rate plots | Images |
|---|---|---|
| Comparison with Poisson distribution Blue bars denote a histogram of data divided into 1 sec bins. Red curve is a Poisson curve with rate = median count rate of data. |
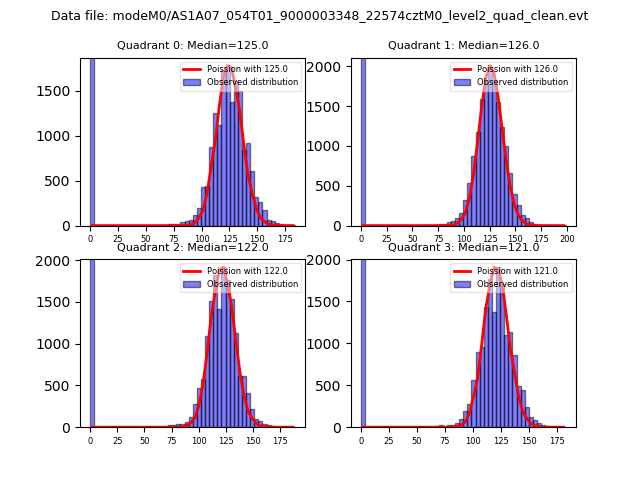 |
 |
| Quadrant-wise count rates Data is divided into 100 sec bins |
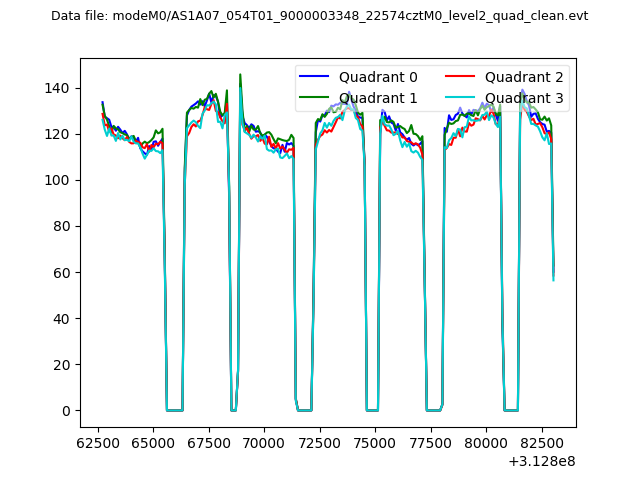 |
|
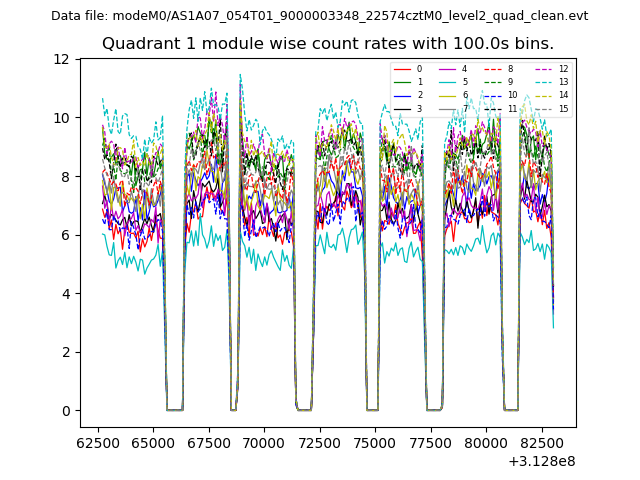
| Module-wise count rates for Quadrant A Data is divided into 100 sec bins |
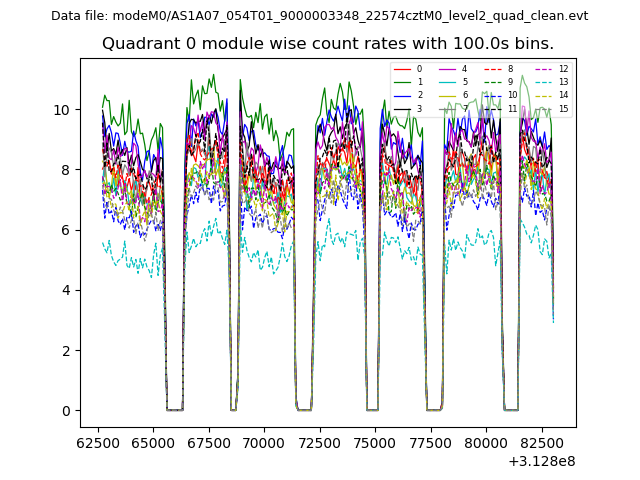 |
 |
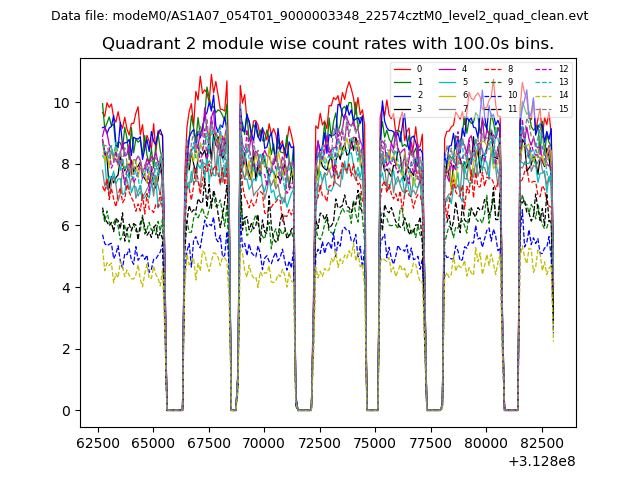
| Module-wise count rates for Quadrant B Data is divided into 100 sec bins |
 |
 |
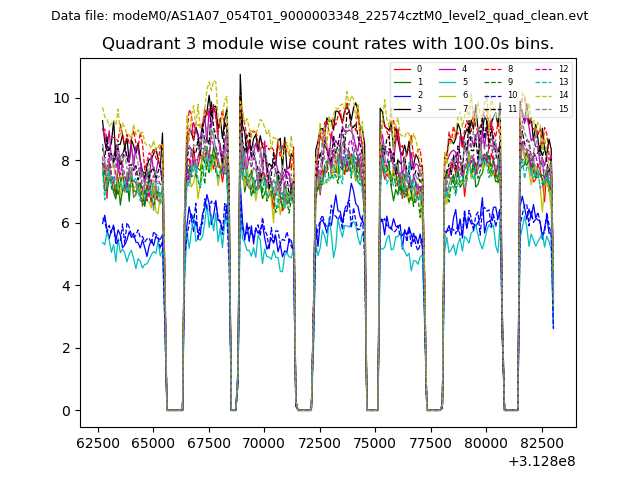
| Module-wise count rates for Quadrant C Data is divided into 100 sec bins |
 |
 |
| Module-wise count rates for Quadrant D Data is divided into 100 sec bins |
 |
 |
| Parameter | Plot |
|---|---|
| CZT HV Monitor | 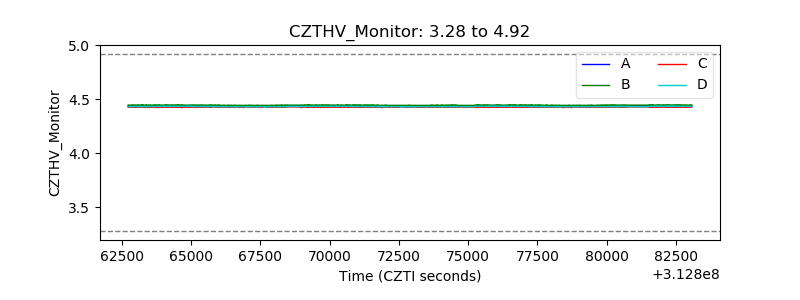 |
| D_VDD | 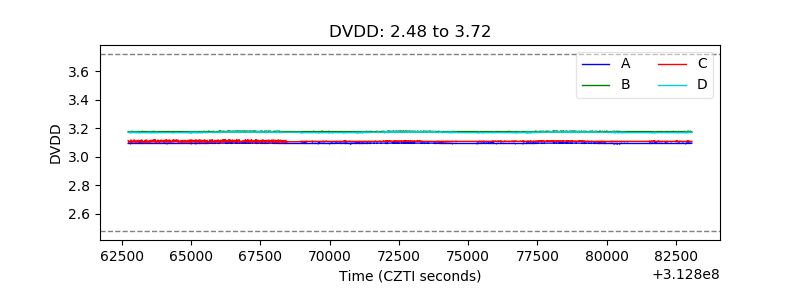 |
| Temperature 1 | 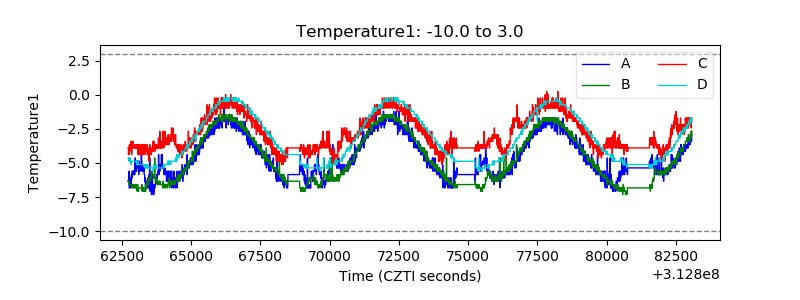 |
| Veto HV Monitor |  |
| Veto LLD |  |
| Alpha Counter | 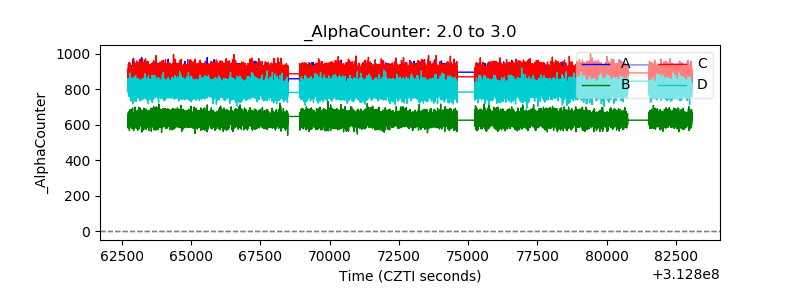 |
| _CPM_Rate | 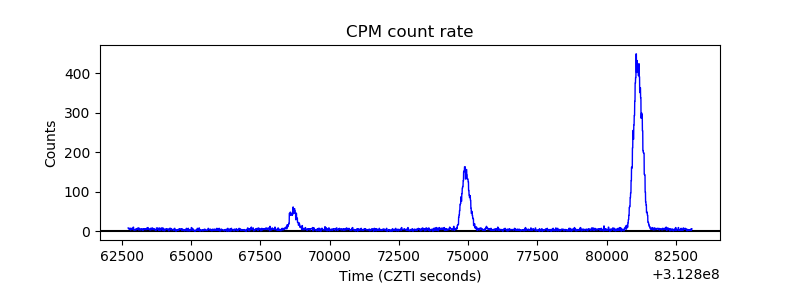 |
| CZT Counter | 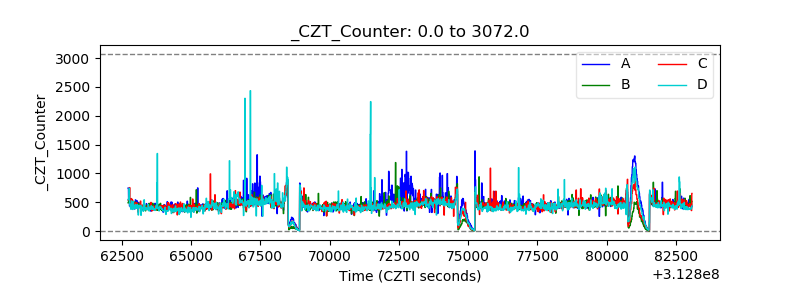 |
| +2.5 Volts monitor |  |
| +5 Volts monitor |  |
| _ROLL_ROT | 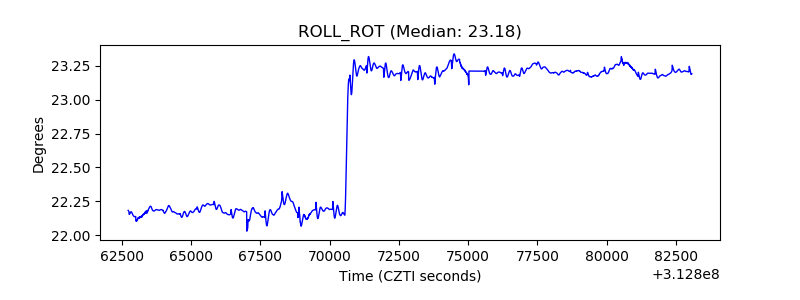 |
| _Roll_DEC | 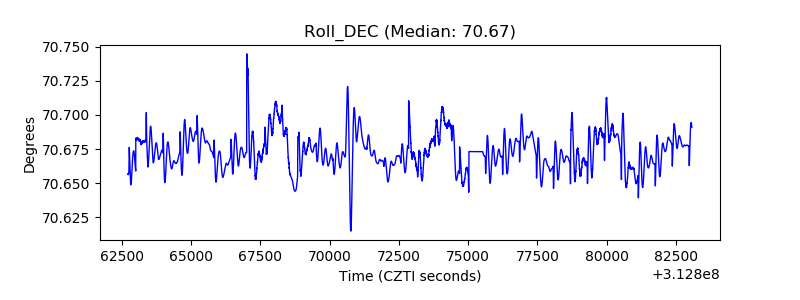 |
| _Roll_RA | 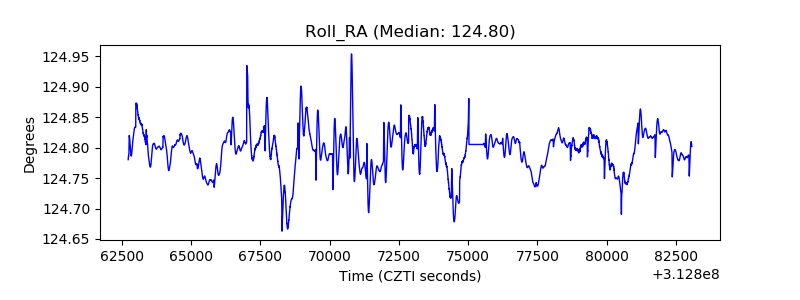 |
| Veto Counter | 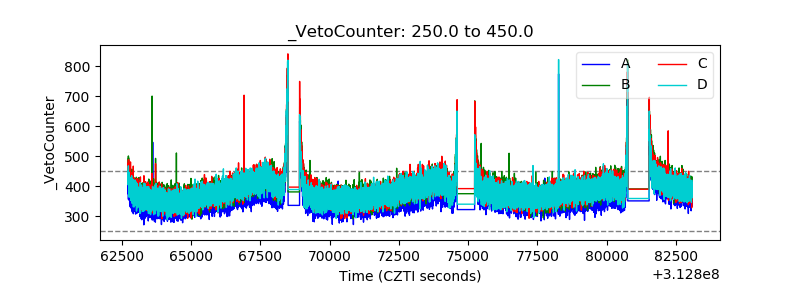 |