| Param | Original file | Final file |
|---|---|---|
| Filename | modeM0/AS1A07_054T01_9000003348_22577cztM0_level2.evt | modeM0/AS1A07_054T01_9000003348_22577cztM0_level2_quad_clean.evt |
| Size (bytes) | 447,307,200 | 102,450,240 |
| Size | 426.6 MB | 97.7 MB |
| Events in quadrant A | 3,188,416 | 677,045 |
| Events in quadrant B | 3,287,191 | 676,405 |
| Events in quadrant C | 3,171,896 | 645,231 |
| Events in quadrant D | 3,452,905 | 646,015 |
| Mode M9 | |||
|---|---|---|---|
| Quadrant | BADHDUFLAG | Total packets | Discarded packets |
| A | 0 | 11 | 0 |
| B | 0 | 11 | 0 |
| C | 0 | 11 | 0 |
| D | 0 | 11 | 0 |
| Mode SS | |||
|---|---|---|---|
| Quadrant | BADHDUFLAG | Total packets | Discarded packets |
| A | 0 | 132 | 0 |
| B | 0 | 132 | 0 |
| C | 0 | 132 | 0 |
| D | 0 | 132 | 0 |
| Mode M0 | |||
|---|---|---|---|
| Quadrant | BADHDUFLAG | Total packets | Discarded packets |
| A | 0 | 13641 | 1 |
| B | 0 | 13856 | 1 |
| C | 0 | 13564 | 1 |
| D | 0 | 14551 | 1 |
| Quadrant | Total seconds | Saturated seconds | Saturation percentage |
|---|---|---|---|
| A | 6573 | 51 | 0.775901% |
| B | 6574 | 50 | 0.760572% |
| C | 6574 | 72 | 1.095224% |
| D | 6574 | 47 | 0.714938% |
Noise dominated data is calculated using 1-second bins in cleaned event files. If a bin has >2000 counts, and if more than 50% of those come from <1% of pixels, then it is considered to be noise-dominated and hence unusable.
| Quadrant | # 1 sec bins | Bins with >0 counts | Bins with >2000 counts | High rate bins dominated by noise | Noise dominated (total time) | Noise dominated (detector-on time) | Marked lightcurve |
|---|---|---|---|---|---|---|---|
| A | 7648 | 6574 | 0 | 0 | 0.00% | 0.00% | 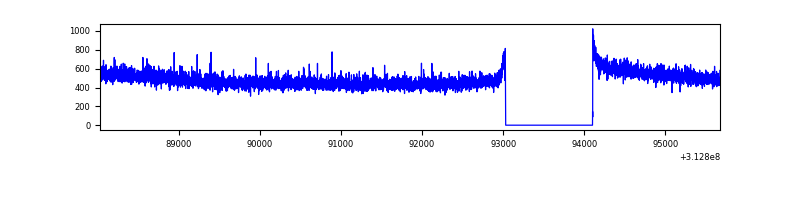 |
| B | 7649 | 6575 | 0 | 0 | 0.00% | 0.00% | 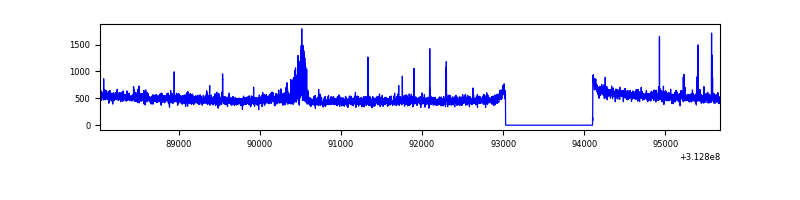 |
| C | 7649 | 6575 | 0 | 0 | 0.00% | 0.00% | 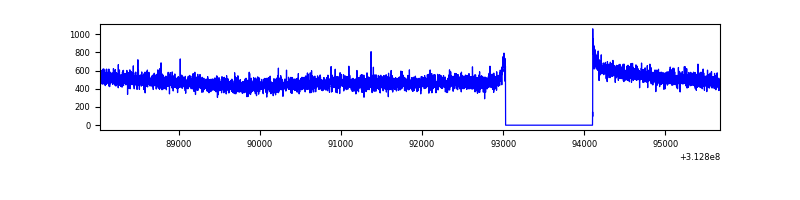 |
| D | 7649 | 6575 | 6 | 6 | 0.08% | 0.09% | 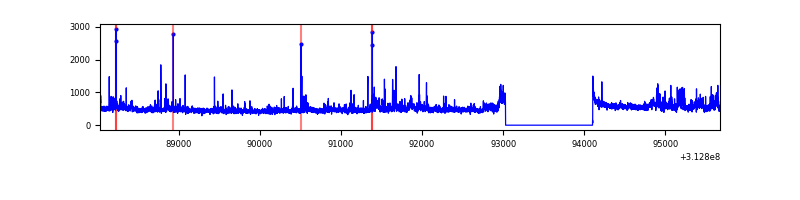 |
Top three noisy pixels from each quadrant. If the there are fewer than three noisy pixels in the level2.evt file, extra rows are filled as -1
| Pixel properties | Quadrant properties | ||||||
|---|---|---|---|---|---|---|---|
| Quadrant | DetID | PixID | Counts | Sigma | Mean | Median | Sigma |
| A | 13 | 34 | 13525 | 77.26 | 821 | 806 | 164.6 |
| A | 13 | 254 | 10768 | 60.51 | 821 | 806 | 164.6 |
| A | 0 | 226 | 7177 | 38.7 | 821 | 806 | 164.6 |
| B | 15 | 33 | 77121 | 506.23 | 807 | 789 | 150.8 |
| B | 12 | 111 | 18035 | 114.37 | 807 | 789 | 150.8 |
| B | 11 | 111 | 16201 | 102.21 | 807 | 789 | 150.8 |
| C | 14 | 238 | 125316 | 688.32 | 776 | 780 | 180.9 |
| C | 10 | 222 | 16483 | 86.79 | 776 | 780 | 180.9 |
| C | 13 | 61 | 5593 | 26.6 | 776 | 780 | 180.9 |
| D | 1 | 52 | 213635 | 1099.8 | 794 | 769 | 193.5 |
| D | 12 | 33 | 182068 | 936.71 | 794 | 769 | 193.5 |
| D | 2 | 234 | 27261 | 136.87 | 794 | 769 | 193.5 |
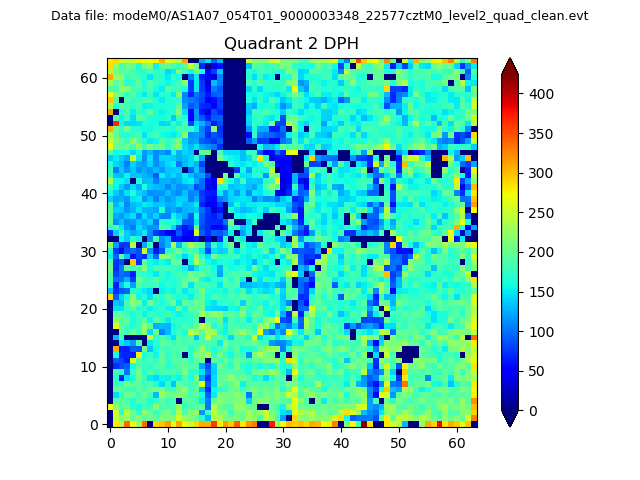
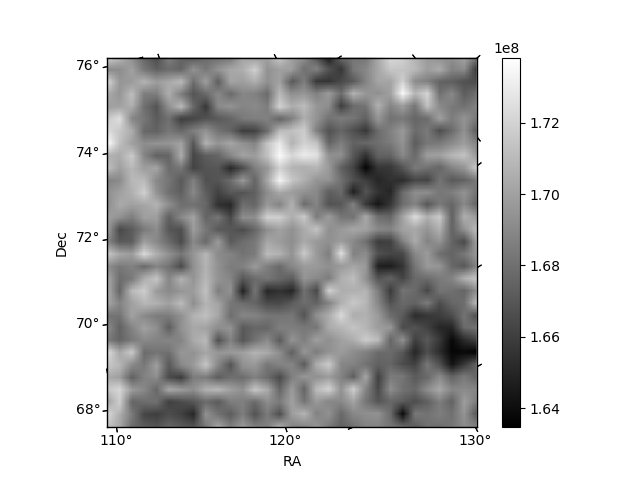
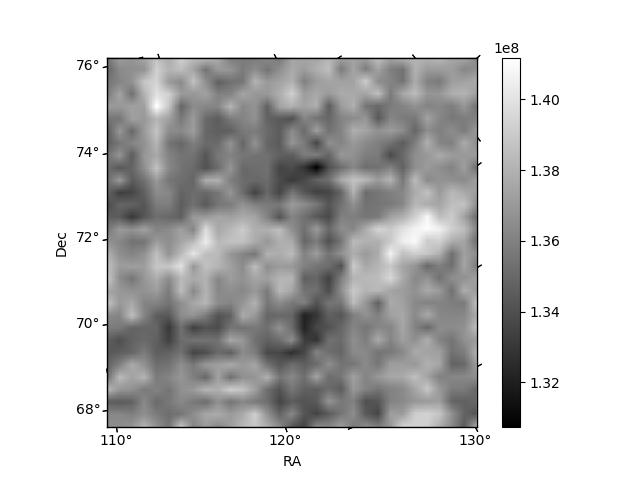
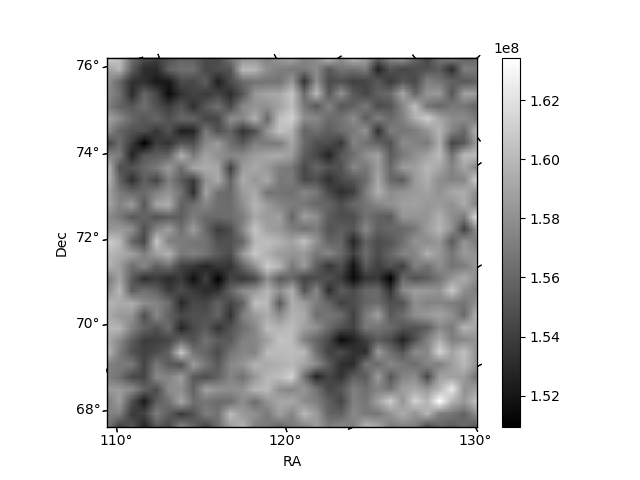
Histogram calculated using DETX and DETY for each event in the final _common_clean file
| Quadrant A | 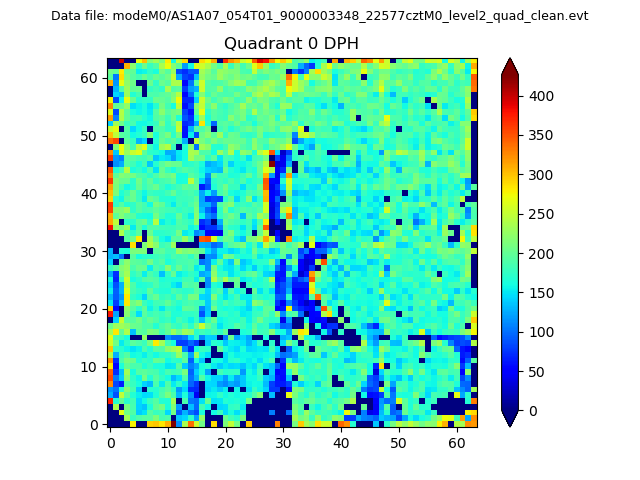 |
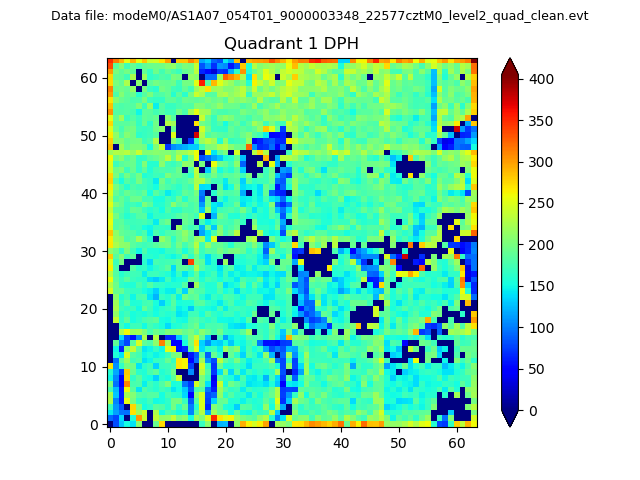 |
Quadrant B |
|---|---|---|---|
| Quadrant D | 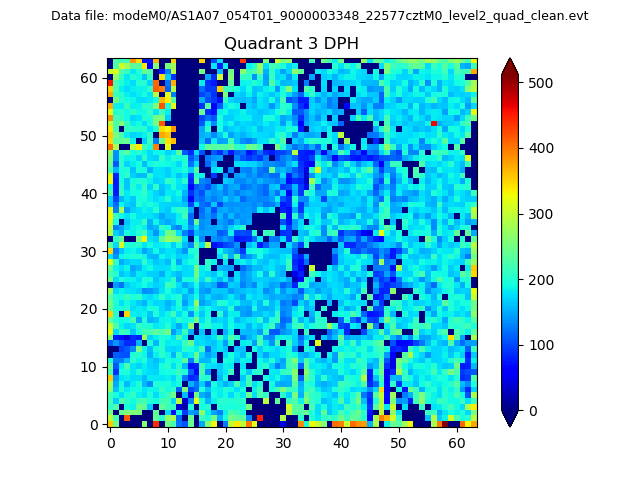 |
 |
Quadrant C |
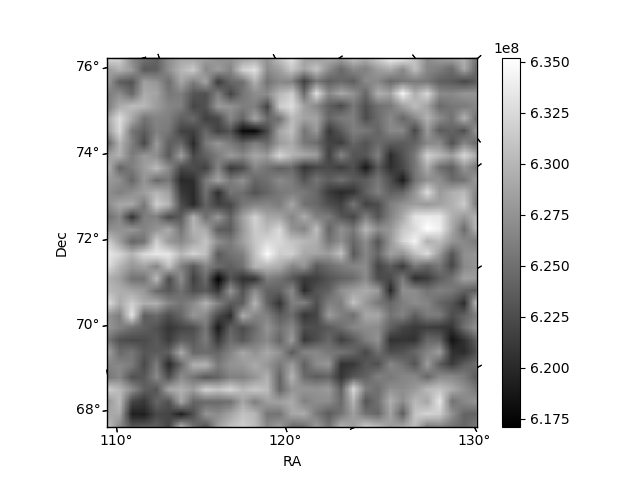
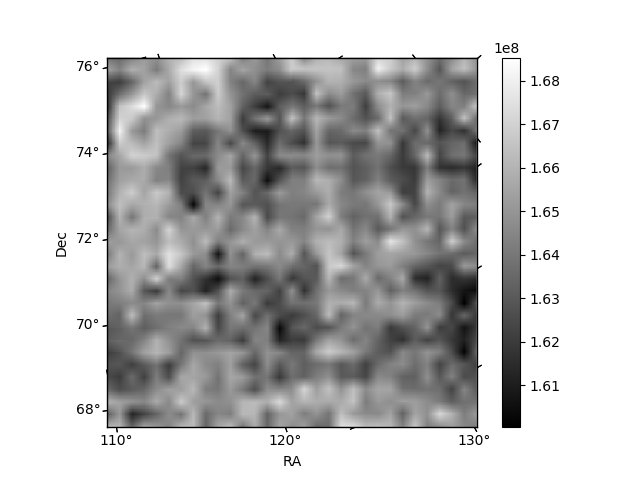
| Plot type | Count rate plots | Images |
|---|---|---|
| Comparison with Poisson distribution Blue bars denote a histogram of data divided into 1 sec bins. Red curve is a Poisson curve with rate = median count rate of data. |
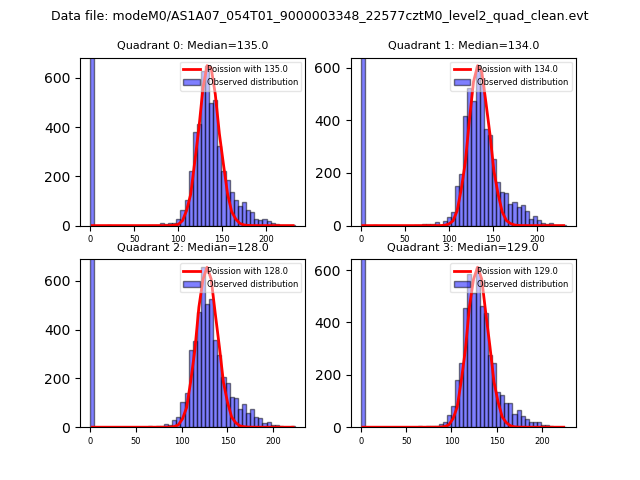 |
 |
| Quadrant-wise count rates Data is divided into 100 sec bins |
 |
|
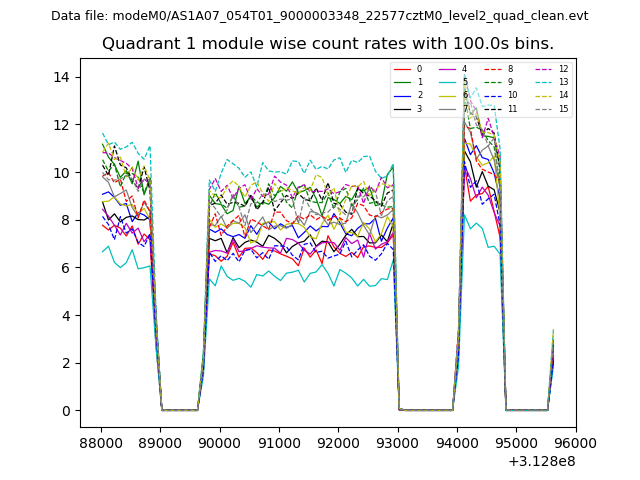
| Module-wise count rates for Quadrant A Data is divided into 100 sec bins |
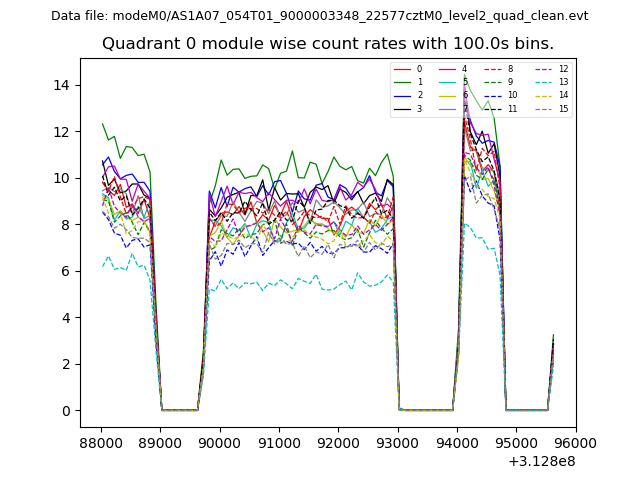 |
 |
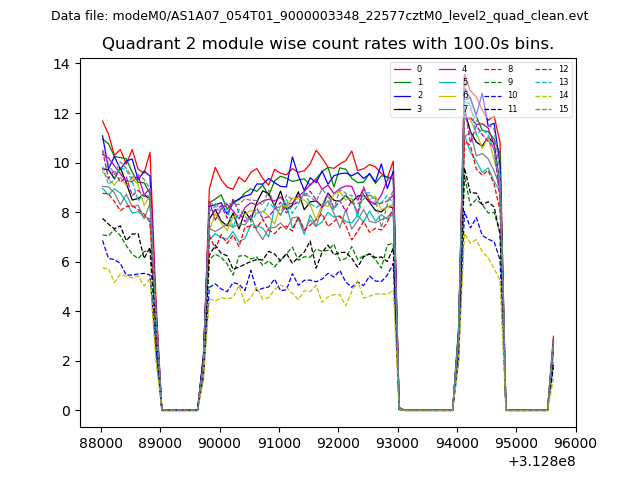
| Module-wise count rates for Quadrant B Data is divided into 100 sec bins |
 |
 |
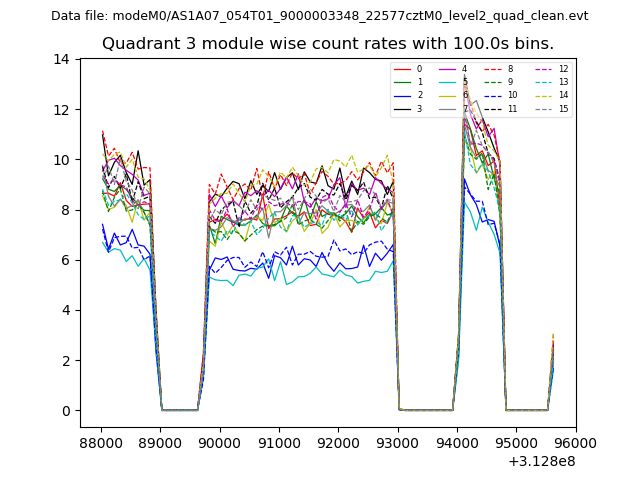
| Module-wise count rates for Quadrant C Data is divided into 100 sec bins |
 |
 |
| Module-wise count rates for Quadrant D Data is divided into 100 sec bins |
 |
 |
| Parameter | Plot |
|---|---|
| CZT HV Monitor | 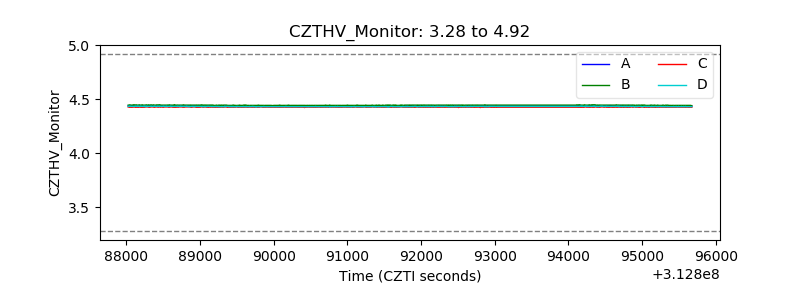 |
| D_VDD | 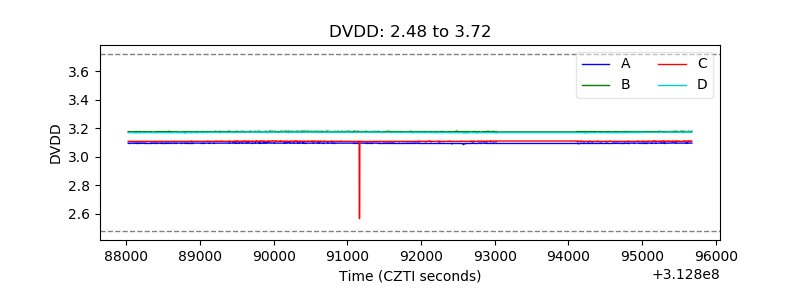 |
| Temperature 1 | 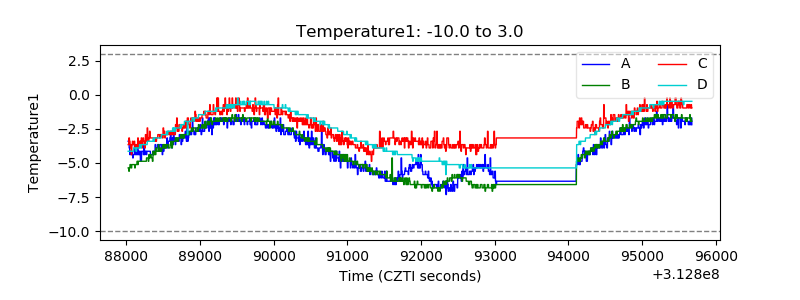 |
| Veto HV Monitor |  |
| Veto LLD | 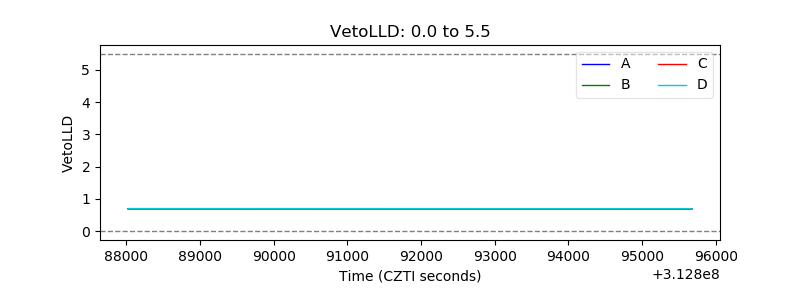 |
| Alpha Counter | 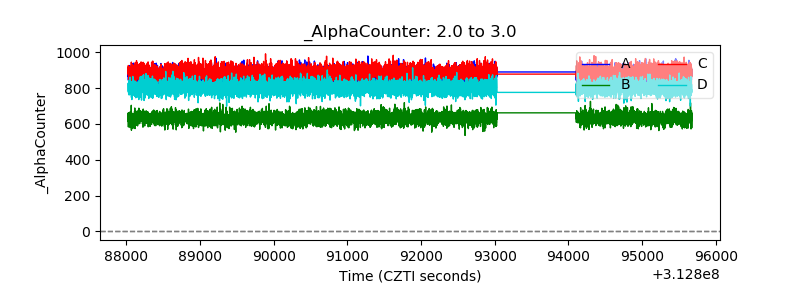 |
| _CPM_Rate | 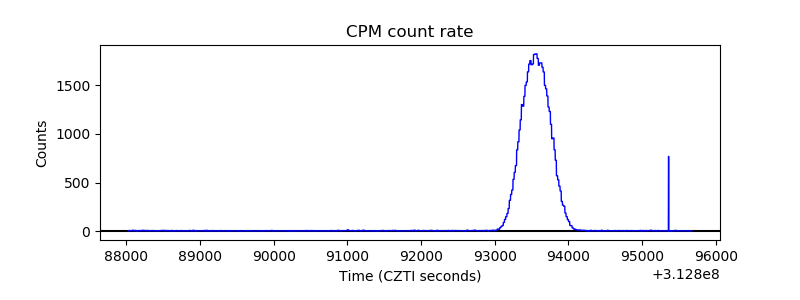 |
| CZT Counter | 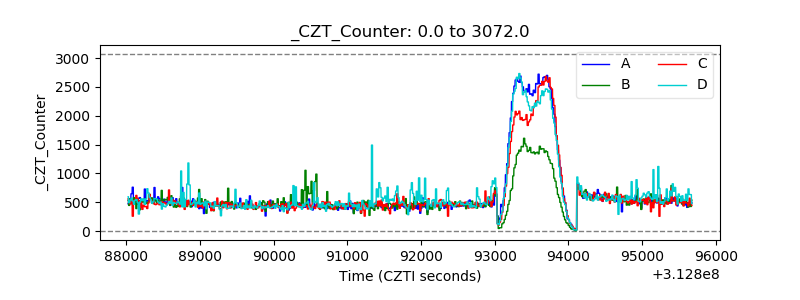 |
| +2.5 Volts monitor | 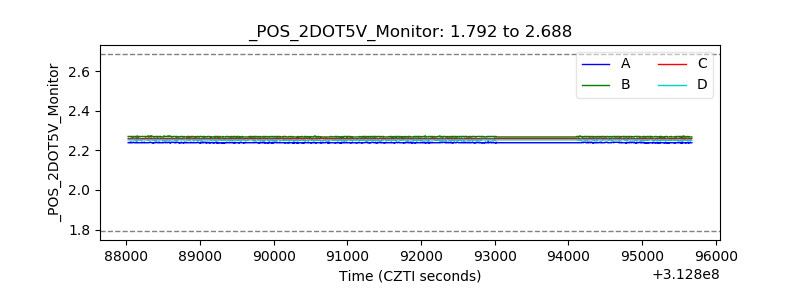 |
| +5 Volts monitor |  |
| _ROLL_ROT | 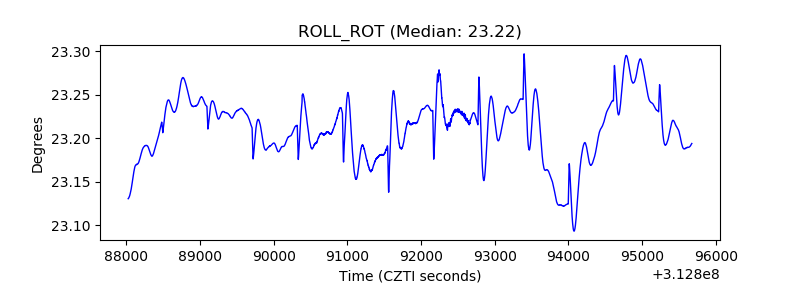 |
| _Roll_DEC | 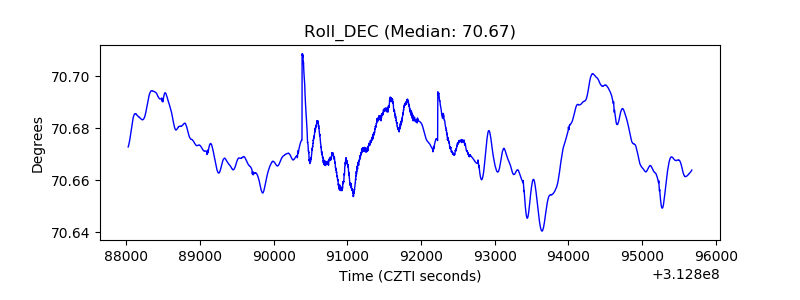 |
| _Roll_RA | 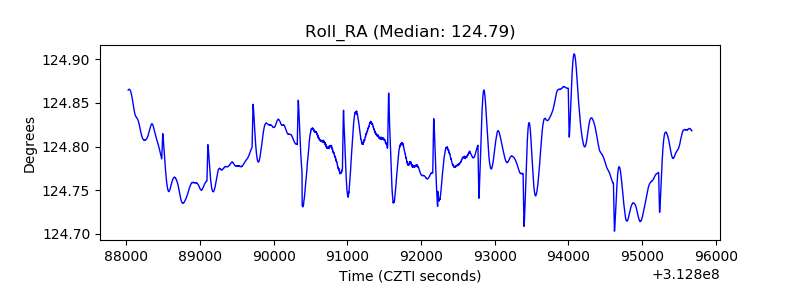 |
| Veto Counter | 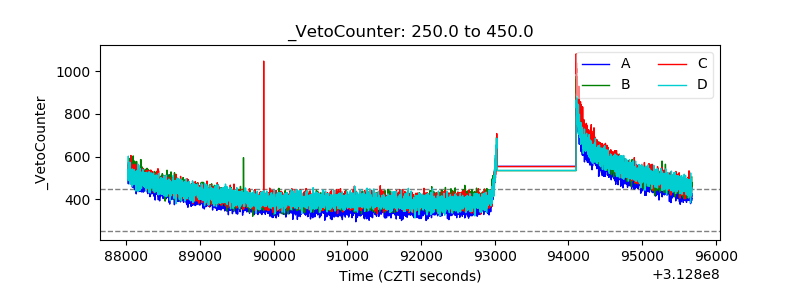 |