| Param | Original file | Final file |
|---|---|---|
| Filename | modeM0/AS1A07_054T01_9000003348_22579cztM0_level2.evt | modeM0/AS1A07_054T01_9000003348_22579cztM0_level2_quad_clean.evt |
| Size (bytes) | 483,359,040 | 101,309,760 |
| Size | 461.0 MB | 96.6 MB |
| Events in quadrant A | 3,146,632 | 679,731 |
| Events in quadrant B | 3,206,020 | 677,117 |
| Events in quadrant C | 3,341,699 | 651,240 |
| Events in quadrant D | 4,530,265 | 634,146 |
| Mode M9 | |||
|---|---|---|---|
| Quadrant | BADHDUFLAG | Total packets | Discarded packets |
| A | 0 | 13 | 0 |
| B | 0 | 13 | 0 |
| C | 0 | 13 | 0 |
| D | 0 | 13 | 0 |
| Mode SS | |||
|---|---|---|---|
| Quadrant | BADHDUFLAG | Total packets | Discarded packets |
| A | 0 | 124 | 0 |
| B | 0 | 124 | 0 |
| C | 0 | 124 | 0 |
| D | 0 | 124 | 0 |
| Mode M0 | |||
|---|---|---|---|
| Quadrant | BADHDUFLAG | Total packets | Discarded packets |
| A | 0 | 13322 | 1 |
| B | 0 | 13589 | 1 |
| C | 0 | 13916 | 1 |
| D | 0 | 17695 | 1 |
| Quadrant | Total seconds | Saturated seconds | Saturation percentage |
|---|---|---|---|
| A | 6100 | 62 | 1.016393% |
| B | 6100 | 66 | 1.081967% |
| C | 6100 | 110 | 1.803279% |
| D | 6099 | 351 | 5.755042% |
Noise dominated data is calculated using 1-second bins in cleaned event files. If a bin has >2000 counts, and if more than 50% of those come from <1% of pixels, then it is considered to be noise-dominated and hence unusable.
| Quadrant | # 1 sec bins | Bins with >0 counts | Bins with >2000 counts | High rate bins dominated by noise | Noise dominated (total time) | Noise dominated (detector-on time) | Marked lightcurve |
|---|---|---|---|---|---|---|---|
| A | 7390 | 6101 | 0 | 0 | 0.00% | 0.00% | 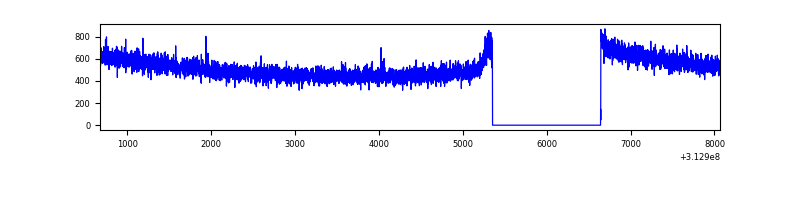 |
| B | 7390 | 6101 | 0 | 0 | 0.00% | 0.00% | 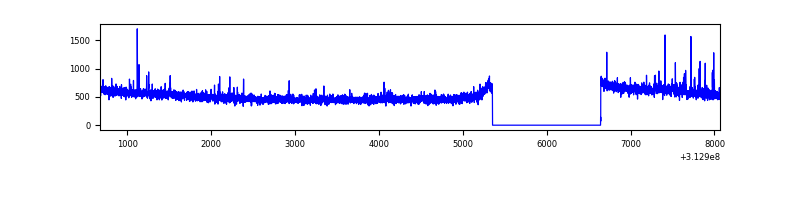 |
| C | 7390 | 6101 | 0 | 0 | 0.00% | 0.00% | 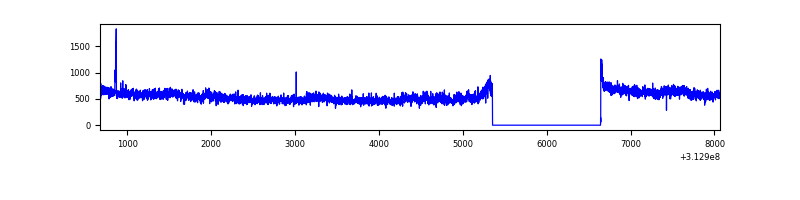 |
| D | 7389 | 6100 | 289 | 289 | 3.91% | 4.74% | 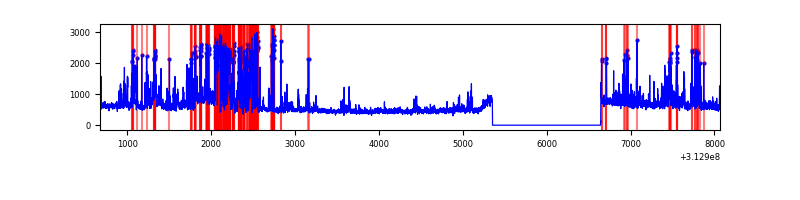 |
Top three noisy pixels from each quadrant. If the there are fewer than three noisy pixels in the level2.evt file, extra rows are filled as -1
| Pixel properties | Quadrant properties | ||||||
|---|---|---|---|---|---|---|---|
| Quadrant | DetID | PixID | Counts | Sigma | Mean | Median | Sigma |
| A | 13 | 254 | 10074 | 57.81 | 815 | 799 | 160.5 |
| A | 0 | 226 | 7141 | 39.53 | 815 | 799 | 160.5 |
| A | 3 | 137 | 6399 | 34.9 | 815 | 799 | 160.5 |
| B | 12 | 111 | 16886 | 108.66 | 805 | 788 | 148.1 |
| B | 0 | 245 | 15992 | 102.63 | 805 | 788 | 148.1 |
| B | 0 | 190 | 15002 | 95.95 | 805 | 788 | 148.1 |
| C | 10 | 222 | 133630 | 738.42 | 786 | 791 | 179.9 |
| C | 14 | 238 | 126405 | 698.26 | 786 | 791 | 179.9 |
| C | 10 | 22 | 12439 | 64.75 | 786 | 791 | 179.9 |
| D | 1 | 52 | 1347604 | 7211.04 | 790 | 771 | 186.8 |
| D | 12 | 33 | 52185 | 275.27 | 790 | 771 | 186.8 |
| D | 12 | 227 | 39474 | 207.22 | 790 | 771 | 186.8 |
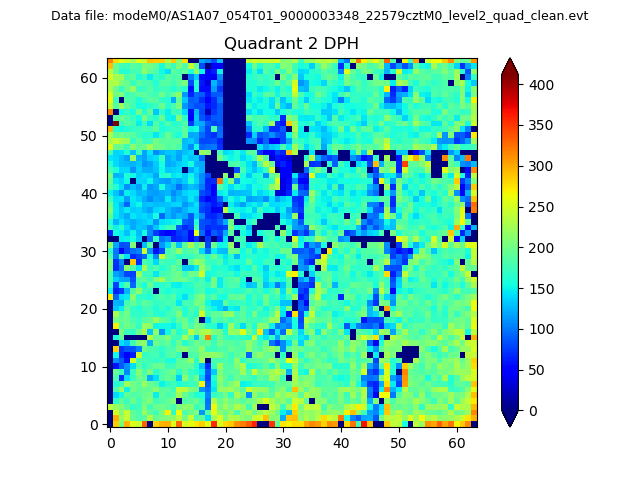
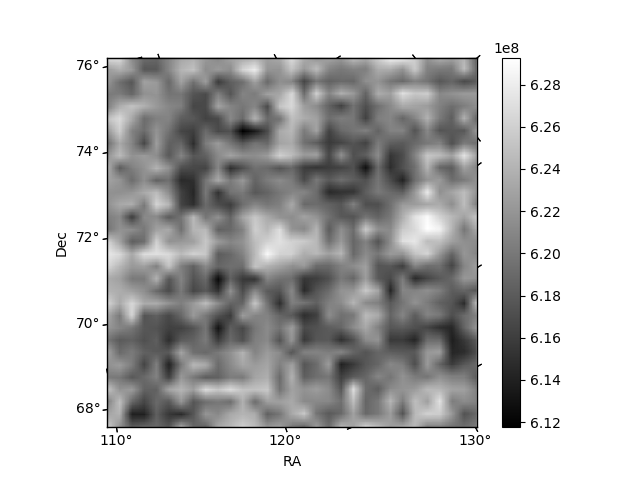
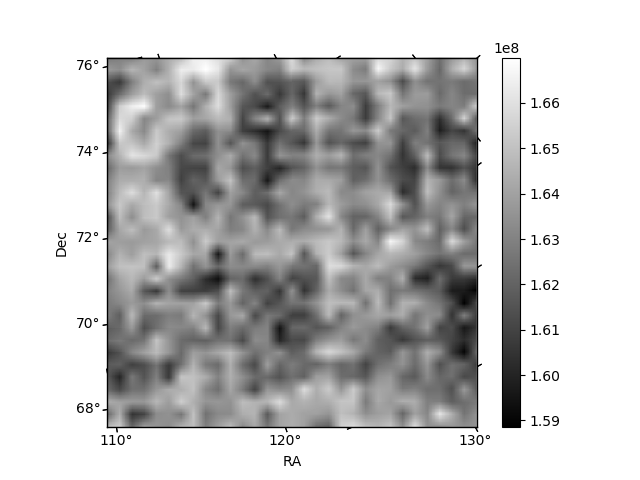
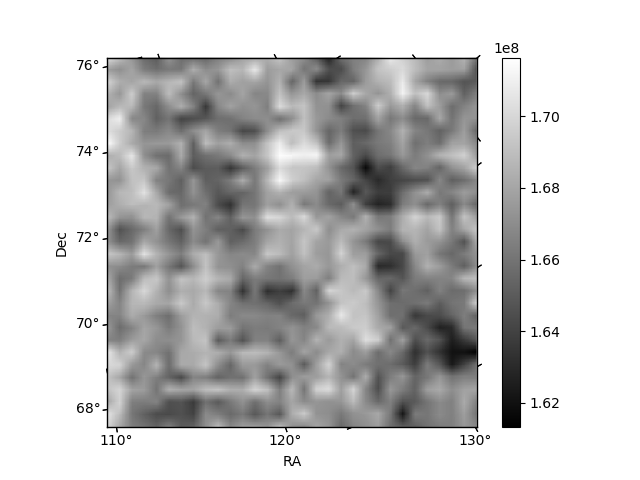
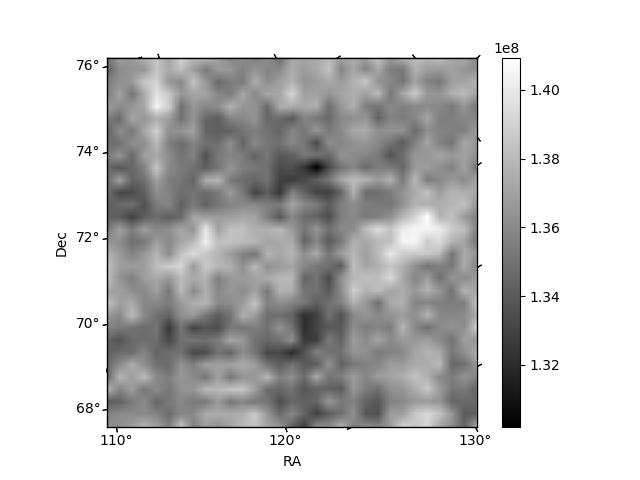
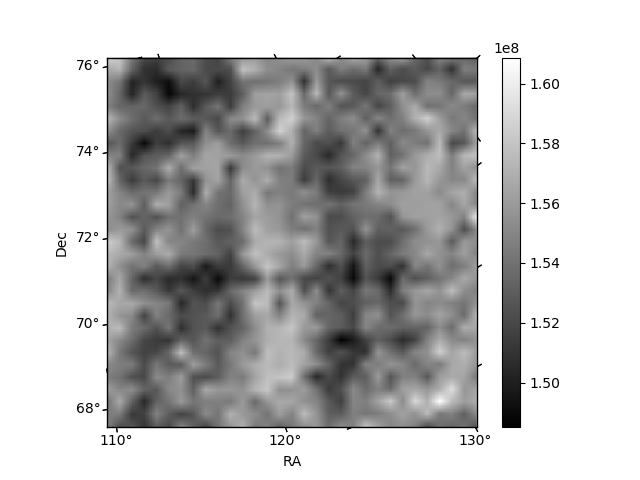
Histogram calculated using DETX and DETY for each event in the final _common_clean file
| Quadrant A | 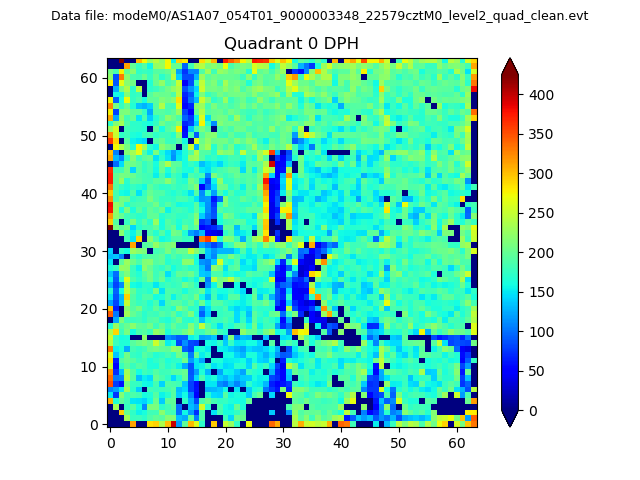 |
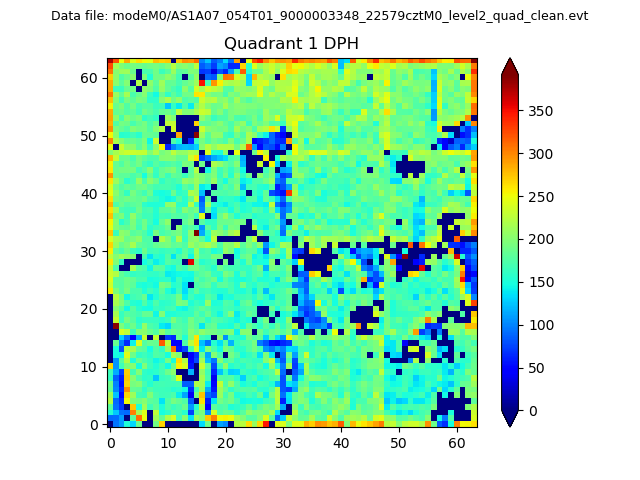 |
Quadrant B |
|---|---|---|---|
| Quadrant D | 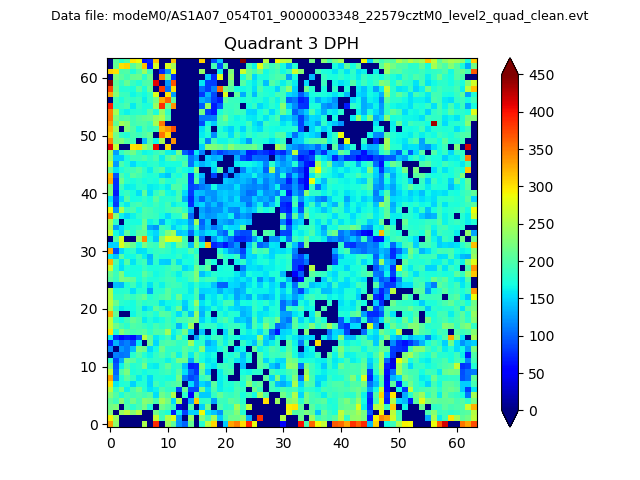 |
 |
Quadrant C |
| Plot type | Count rate plots | Images |
|---|---|---|
| Comparison with Poisson distribution Blue bars denote a histogram of data divided into 1 sec bins. Red curve is a Poisson curve with rate = median count rate of data. |
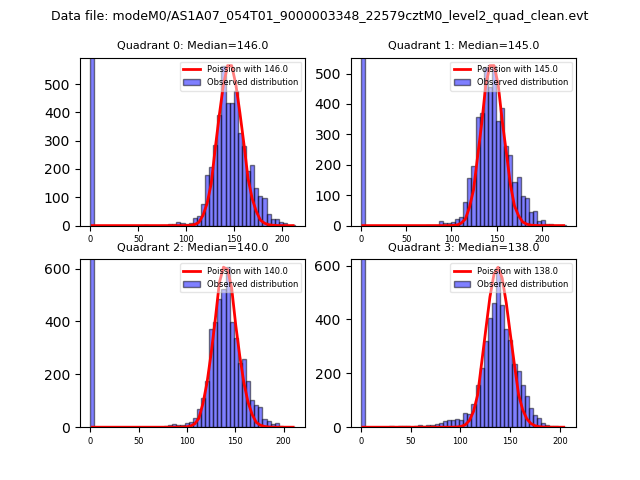 |
 |
| Quadrant-wise count rates Data is divided into 100 sec bins |
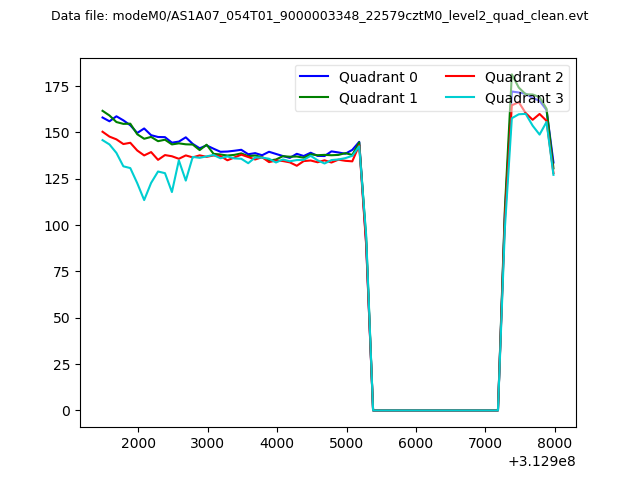 |
|
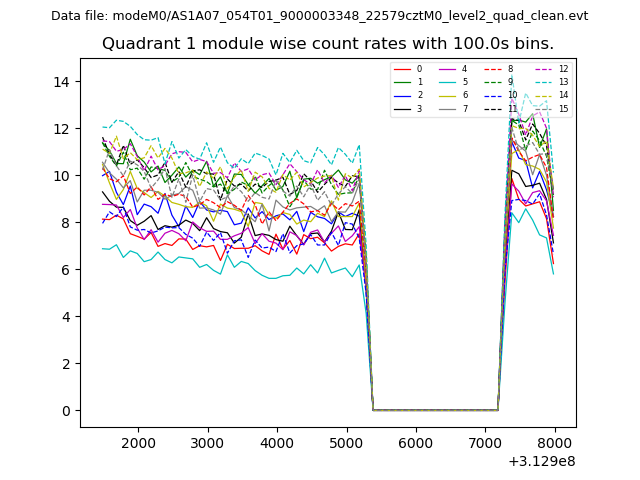
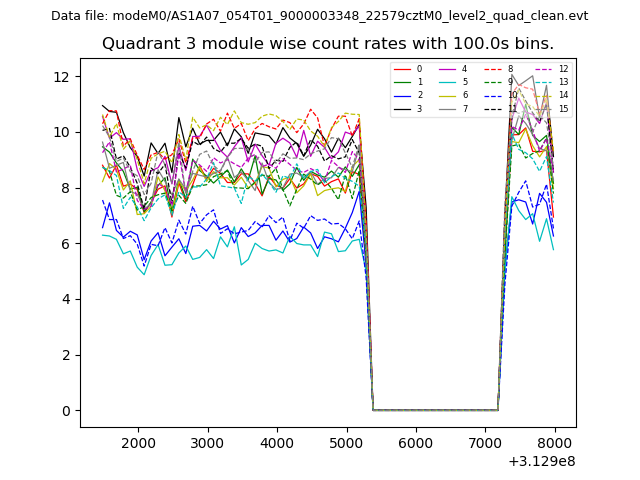
| Module-wise count rates for Quadrant A Data is divided into 100 sec bins |
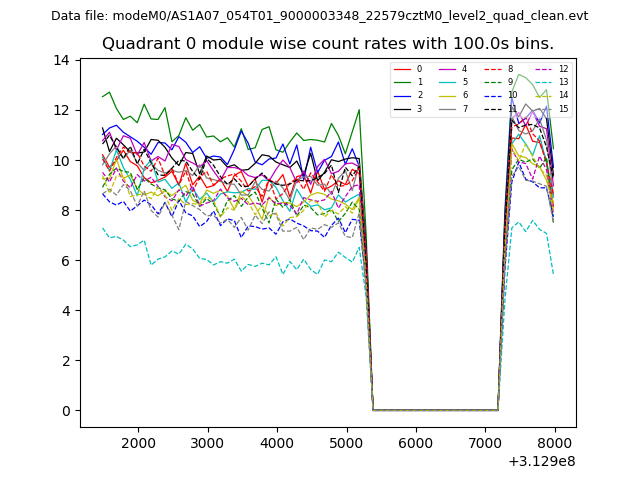 |
 |
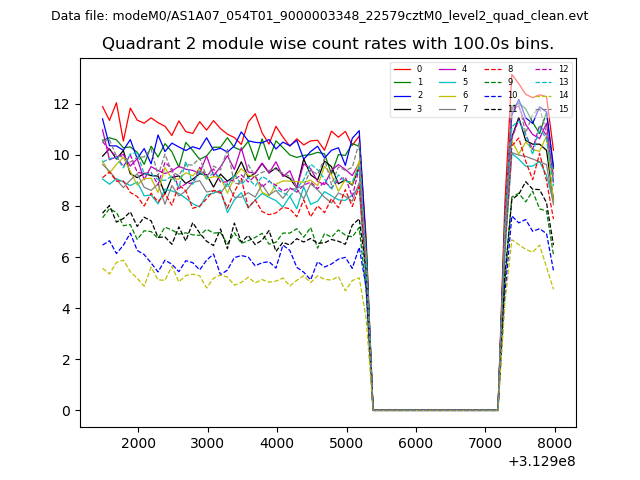
| Module-wise count rates for Quadrant B Data is divided into 100 sec bins |
 |
 |
| Module-wise count rates for Quadrant C Data is divided into 100 sec bins |
 |
 |
| Module-wise count rates for Quadrant D Data is divided into 100 sec bins |
 |
 |
| Parameter | Plot |
|---|---|
| CZT HV Monitor | 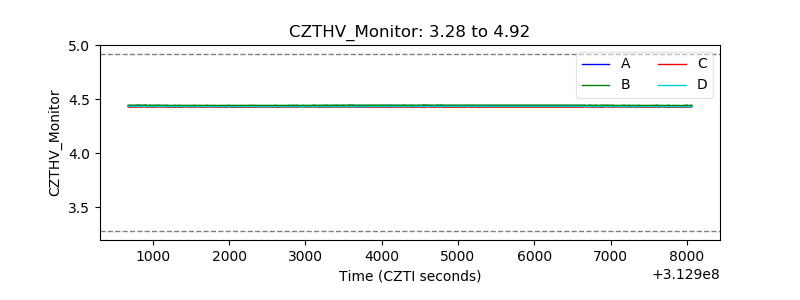 |
| D_VDD | 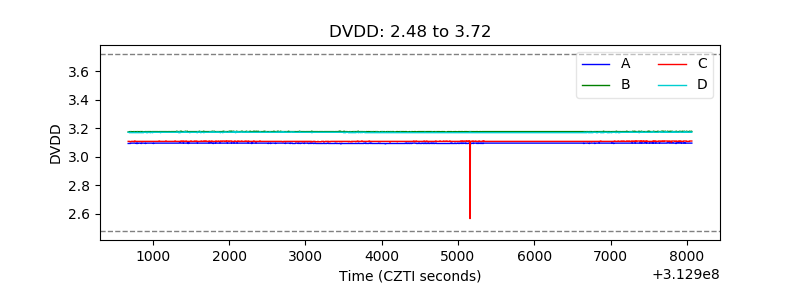 |
| Temperature 1 | 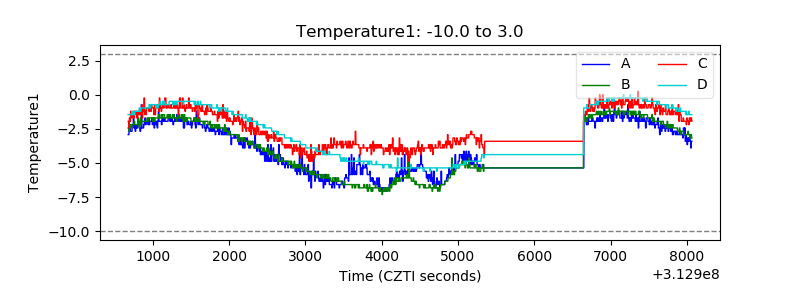 |
| Veto HV Monitor | 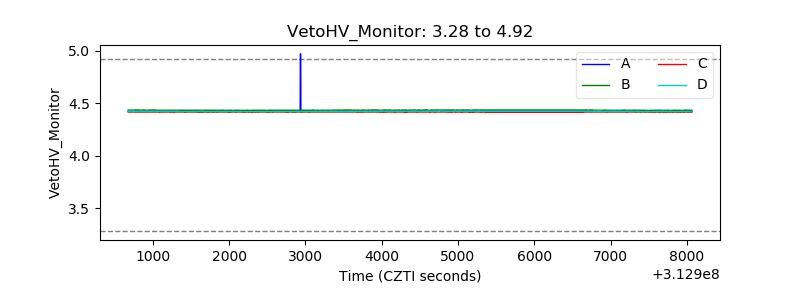 |
| Veto LLD |  |
| Alpha Counter | 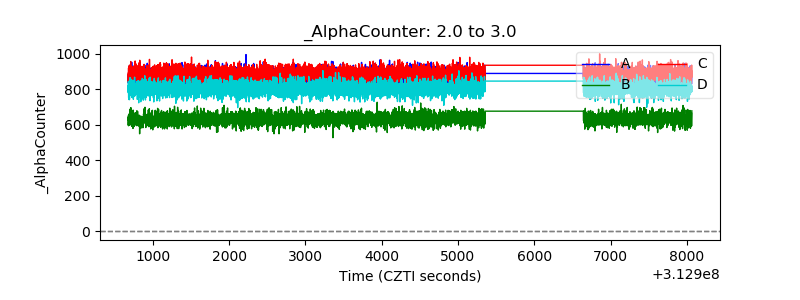 |
| _CPM_Rate | 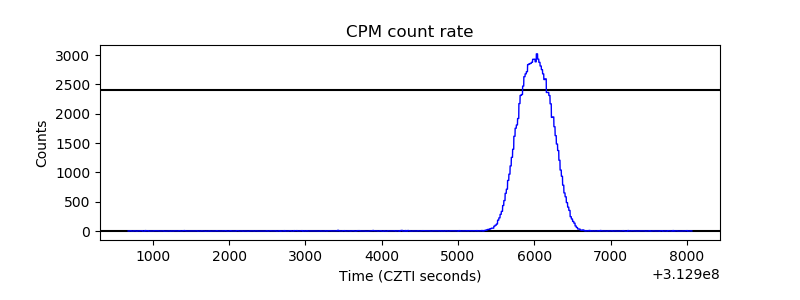 |
| CZT Counter | 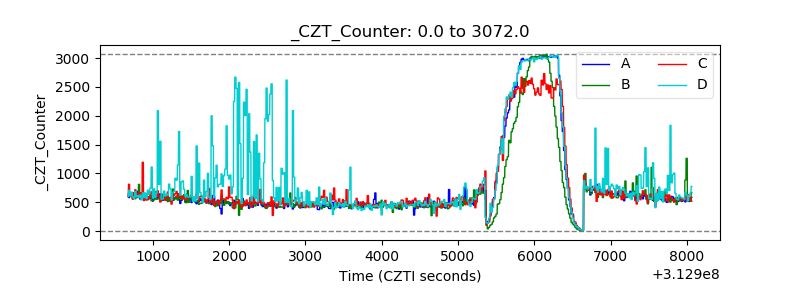 |
| +2.5 Volts monitor |  |
| +5 Volts monitor | 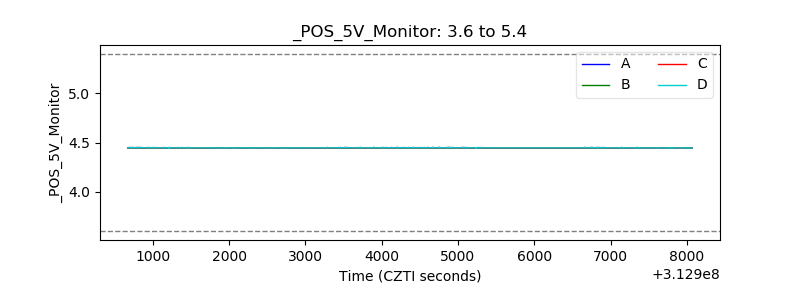 |
| _ROLL_ROT | 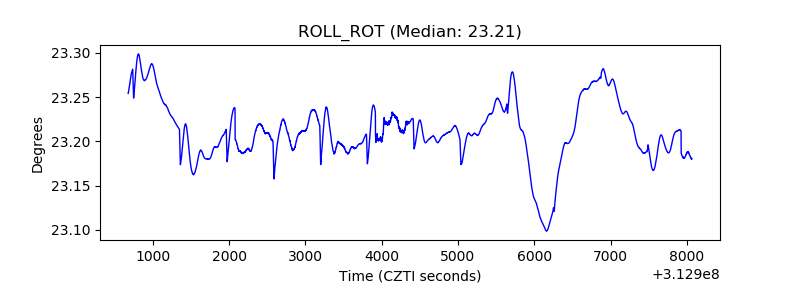 |
| _Roll_DEC | 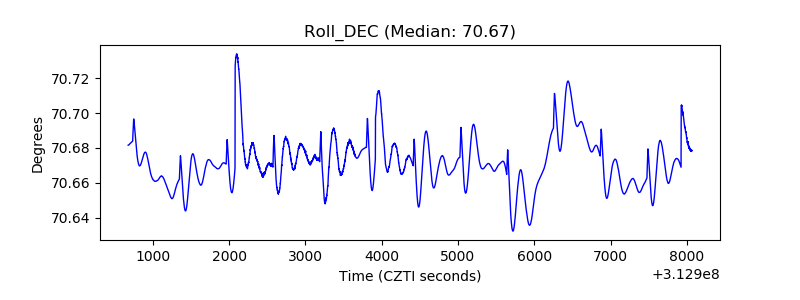 |
| _Roll_RA | 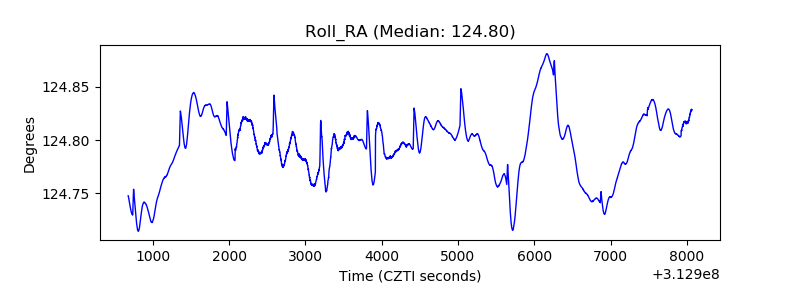 |
| Veto Counter | 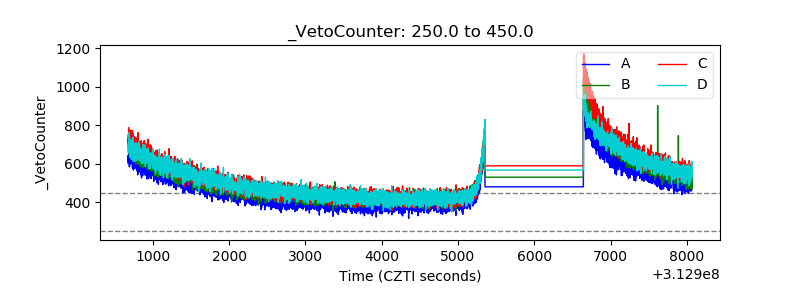 |