| Param | Original file | Final file |
|---|---|---|
| Filename | modeM0/AS1A07_054T01_9000003348_22581cztM0_level2.evt | modeM0/AS1A07_054T01_9000003348_22581cztM0_level2_quad_clean.evt |
| Size (bytes) | 465,261,120 | 130,740,480 |
| Size | 443.7 MB | 124.7 MB |
| Events in quadrant A | 3,149,555 | 894,132 |
| Events in quadrant B | 3,712,475 | 895,054 |
| Events in quadrant C | 3,326,292 | 879,862 |
| Events in quadrant D | 3,482,868 | 859,853 |
| Mode M9 | |||
|---|---|---|---|
| Quadrant | BADHDUFLAG | Total packets | Discarded packets |
| A | 0 | 17 | 0 |
| B | 0 | 18 | 0 |
| C | 0 | 18 | 0 |
| D | 0 | 18 | 0 |
| Mode SS | |||
|---|---|---|---|
| Quadrant | BADHDUFLAG | Total packets | Discarded packets |
| A | 0 | 126 | 0 |
| B | 0 | 126 | 0 |
| C | 0 | 126 | 0 |
| D | 0 | 126 | 0 |
| Mode M0 | |||
|---|---|---|---|
| Quadrant | BADHDUFLAG | Total packets | Discarded packets |
| A | 0 | 13359 | 2 |
| B | 0 | 15241 | 3 |
| C | 0 | 13848 | 2 |
| D | 0 | 14562 | 2 |
| Quadrant | Total seconds | Saturated seconds | Saturation percentage |
|---|---|---|---|
| A | 6173 | 78 | 1.263567% |
| B | 6172 | 237 | 3.839922% |
| C | 6172 | 147 | 2.381724% |
| D | 6172 | 149 | 2.414128% |
Noise dominated data is calculated using 1-second bins in cleaned event files. If a bin has >2000 counts, and if more than 50% of those come from <1% of pixels, then it is considered to be noise-dominated and hence unusable.
| Quadrant | # 1 sec bins | Bins with >0 counts | Bins with >2000 counts | High rate bins dominated by noise | Noise dominated (total time) | Noise dominated (detector-on time) | Marked lightcurve |
|---|---|---|---|---|---|---|---|
| A | 7478 | 6174 | 0 | 0 | 0.00% | 0.00% | 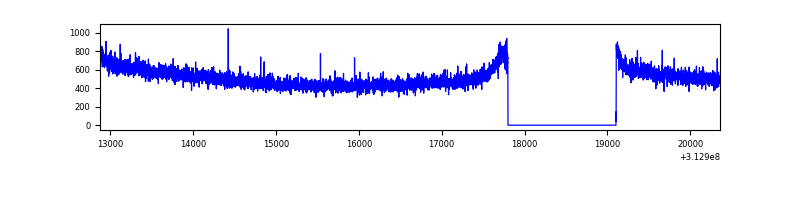 |
| B | 7477 | 6173 | 32 | 32 | 0.43% | 0.52% | 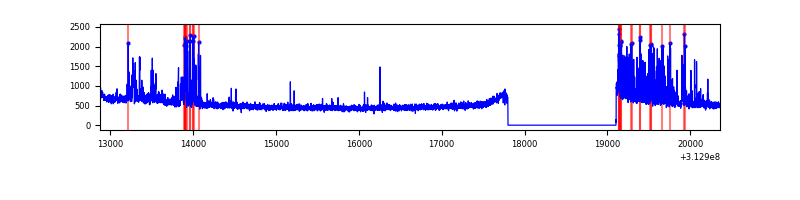 |
| C | 7477 | 6173 | 0 | 0 | 0.00% | 0.00% | 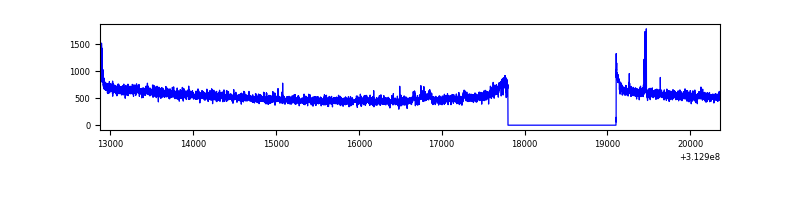 |
| D | 7477 | 6173 | 63 | 63 | 0.84% | 1.02% | 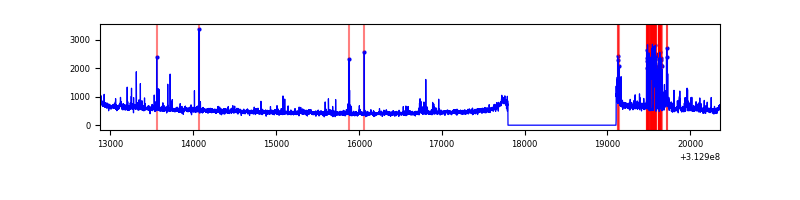 |
Top three noisy pixels from each quadrant. If the there are fewer than three noisy pixels in the level2.evt file, extra rows are filled as -1
| Pixel properties | Quadrant properties | ||||||
|---|---|---|---|---|---|---|---|
| Quadrant | DetID | PixID | Counts | Sigma | Mean | Median | Sigma |
| A | 13 | 254 | 10585 | 60.57 | 816 | 801 | 161.5 |
| A | 0 | 226 | 7060 | 38.75 | 816 | 801 | 161.5 |
| A | 3 | 137 | 6232 | 33.62 | 816 | 801 | 161.5 |
| B | 15 | 33 | 451007 | 3002.62 | 811 | 792 | 149.9 |
| B | 0 | 245 | 28631 | 185.67 | 811 | 792 | 149.9 |
| B | 0 | 228 | 28269 | 183.25 | 811 | 792 | 149.9 |
| C | 14 | 238 | 128147 | 692.43 | 801 | 806 | 183.9 |
| C | 10 | 222 | 50883 | 272.3 | 801 | 806 | 183.9 |
| C | 0 | 10 | 12745 | 64.92 | 801 | 806 | 183.9 |
| D | 1 | 52 | 316969 | 1629.6 | 807 | 785 | 194.0 |
| D | 13 | 172 | 34293 | 172.7 | 807 | 785 | 194.0 |
| D | 1 | 239 | 29023 | 145.54 | 807 | 785 | 194.0 |
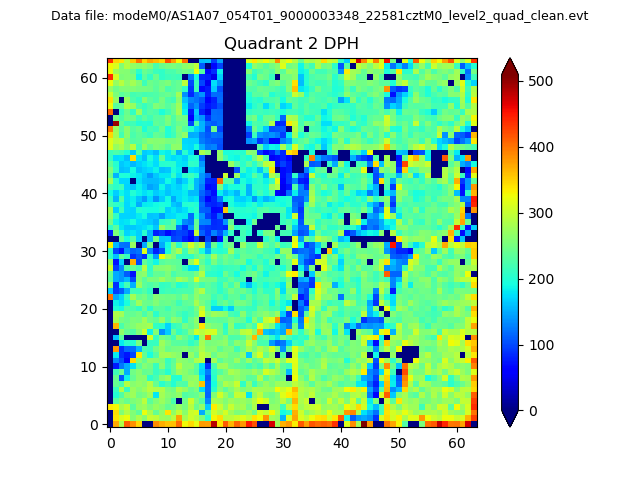
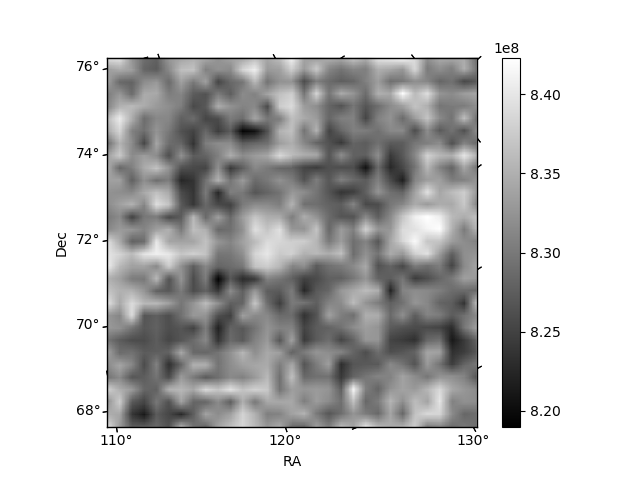
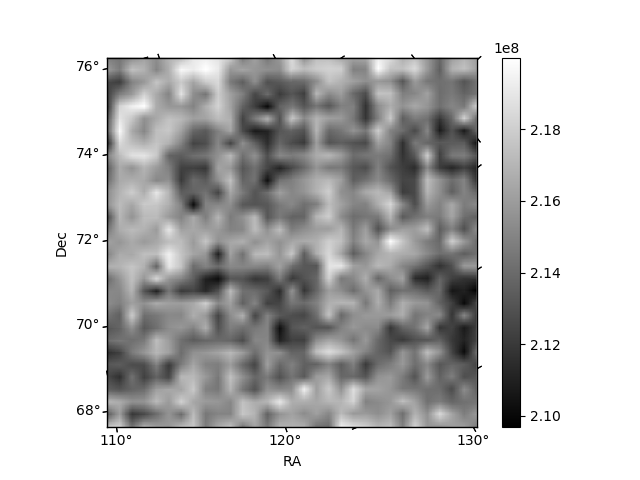
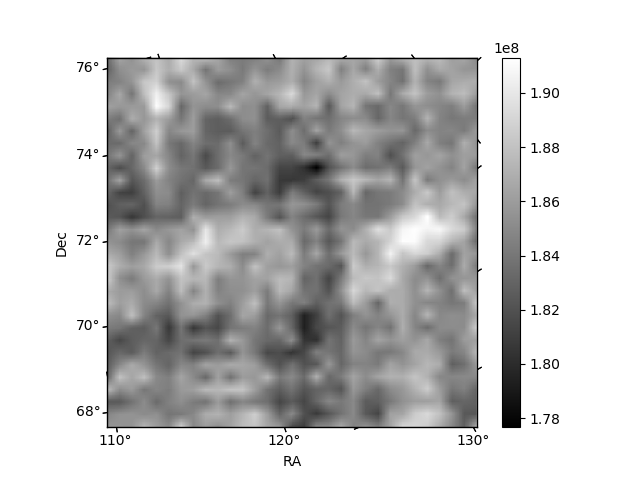
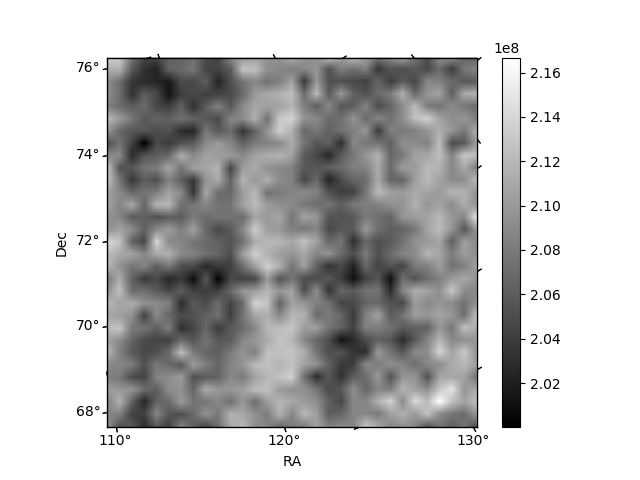
Histogram calculated using DETX and DETY for each event in the final _common_clean file
| Quadrant A | 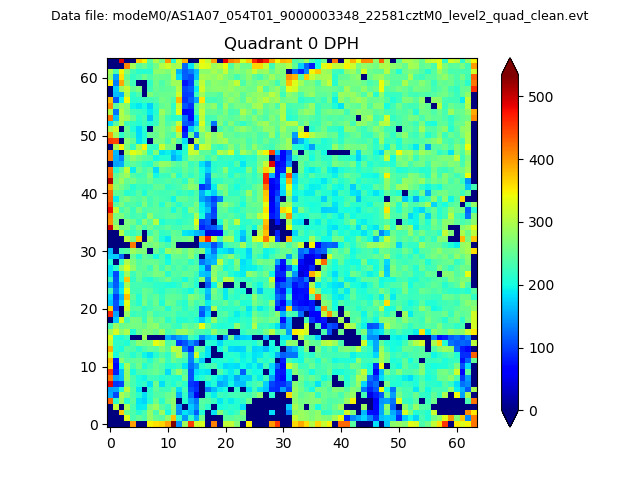 |
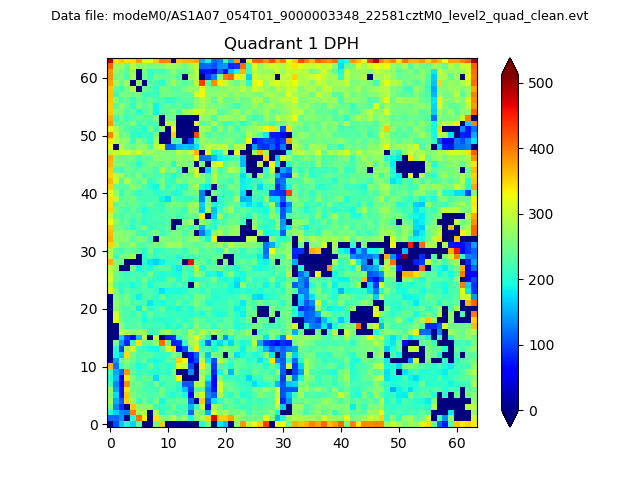 |
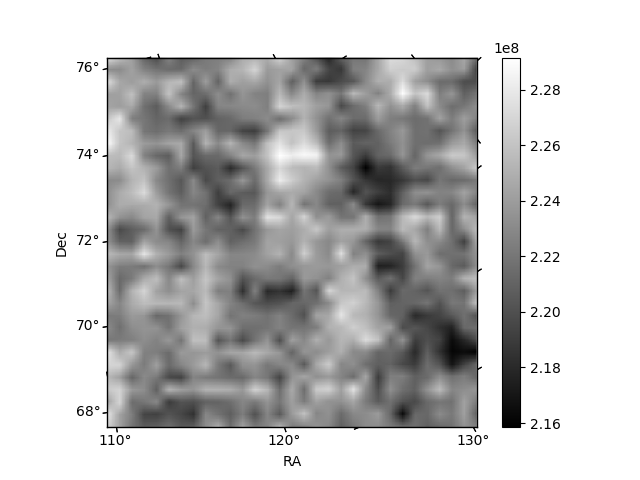
Quadrant B |
|---|---|---|---|
| Quadrant D | 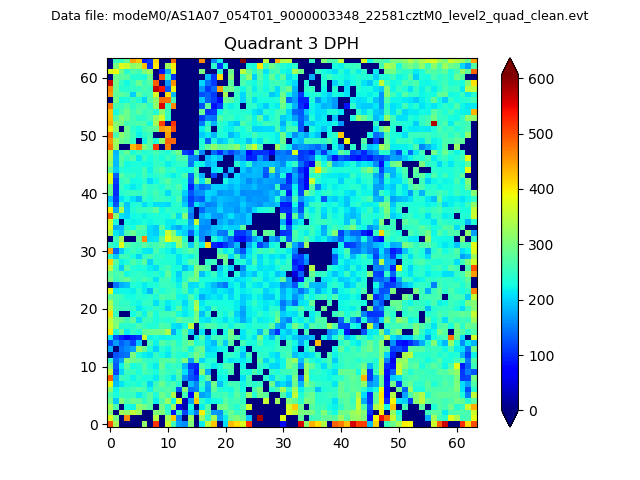 |
 |
Quadrant C |
| Plot type | Count rate plots | Images |
|---|---|---|
| Comparison with Poisson distribution Blue bars denote a histogram of data divided into 1 sec bins. Red curve is a Poisson curve with rate = median count rate of data. |
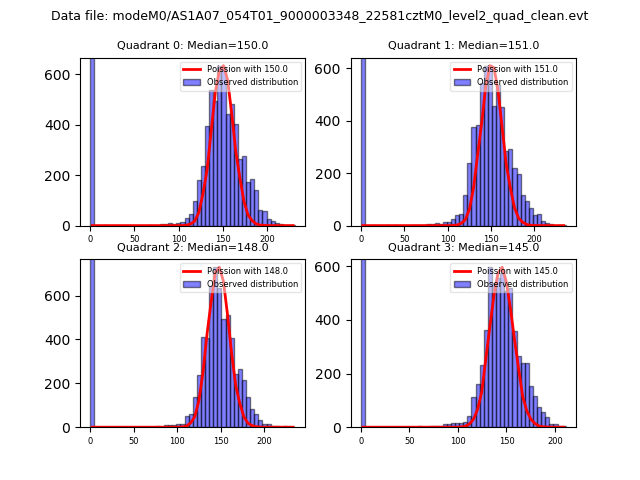 |
 |
| Quadrant-wise count rates Data is divided into 100 sec bins |
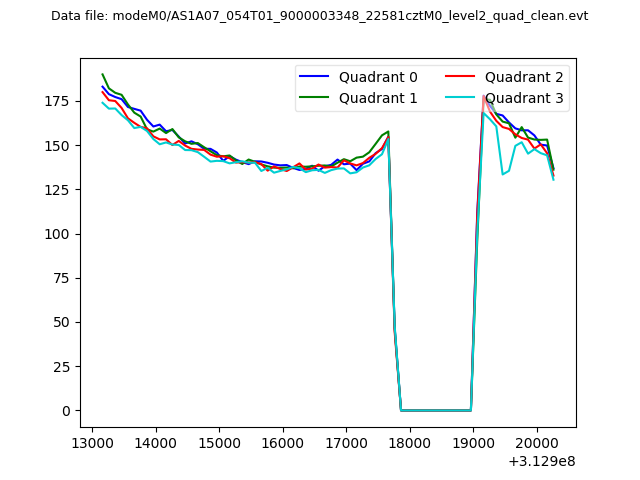 |
|
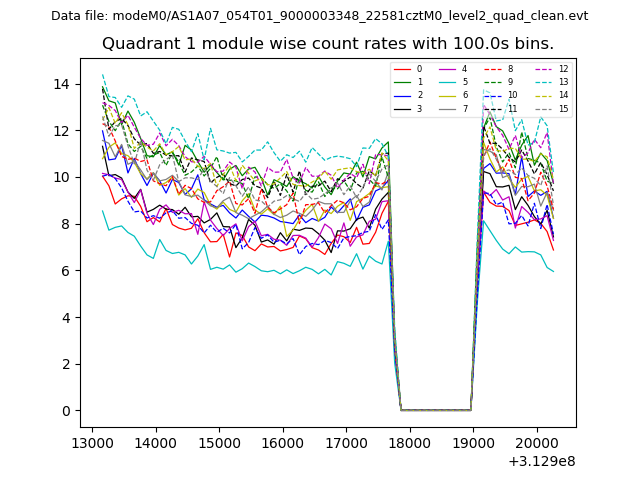
| Module-wise count rates for Quadrant A Data is divided into 100 sec bins |
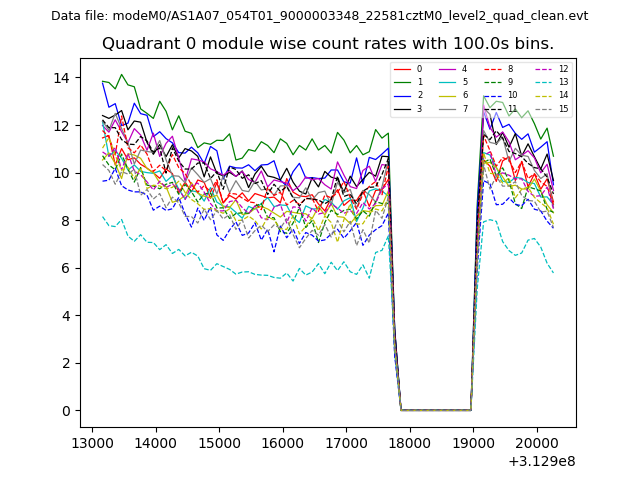 |
 |
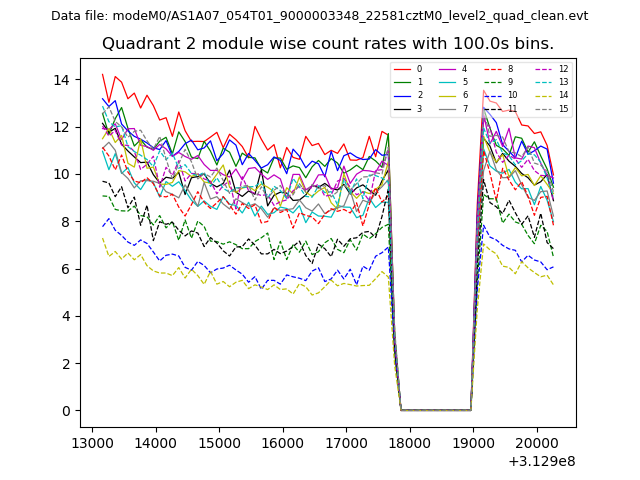
| Module-wise count rates for Quadrant B Data is divided into 100 sec bins |
 |
 |
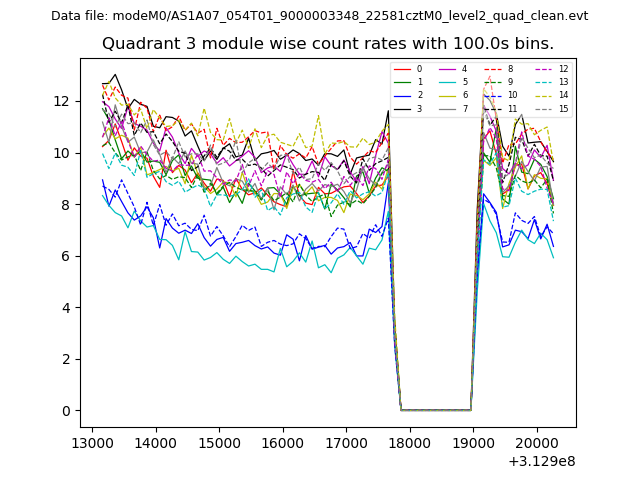
| Module-wise count rates for Quadrant C Data is divided into 100 sec bins |
 |
 |
| Module-wise count rates for Quadrant D Data is divided into 100 sec bins |
 |
 |
| Parameter | Plot |
|---|---|
| CZT HV Monitor | 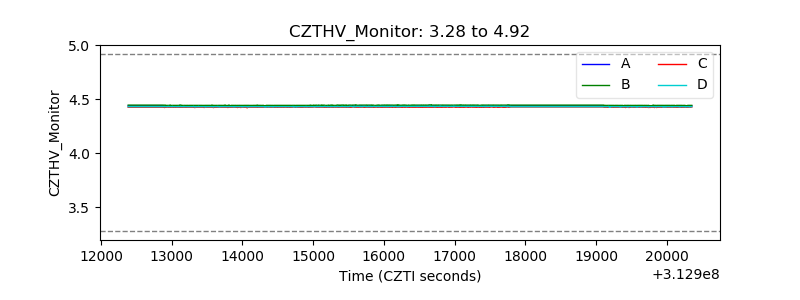 |
| D_VDD | 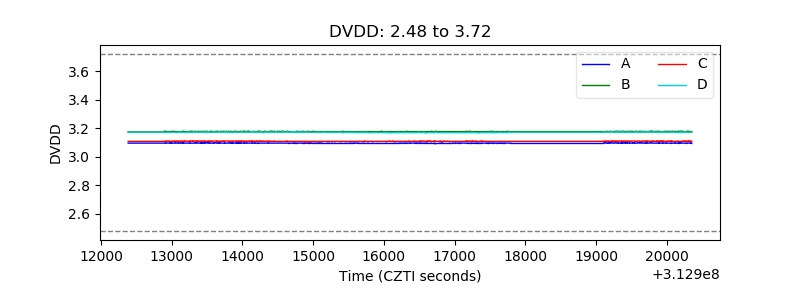 |
| Temperature 1 | 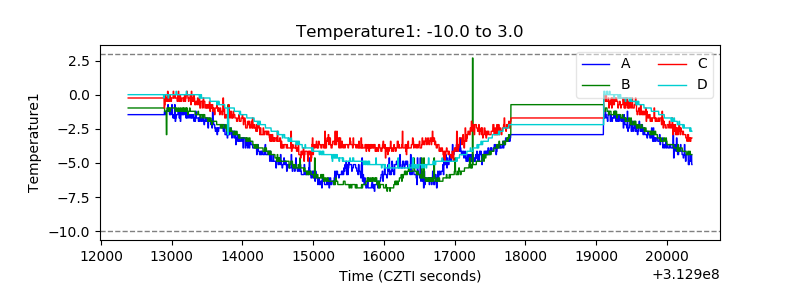 |
| Veto HV Monitor |  |
| Veto LLD | 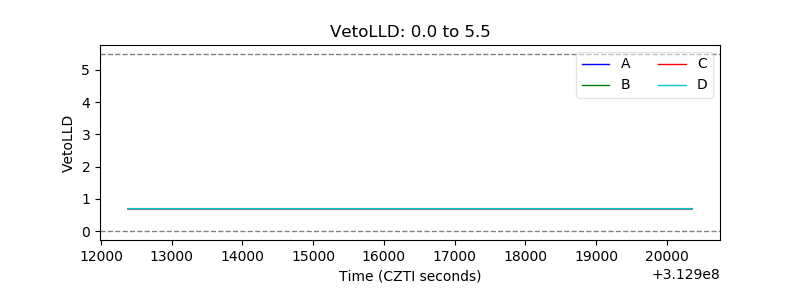 |
| Alpha Counter | 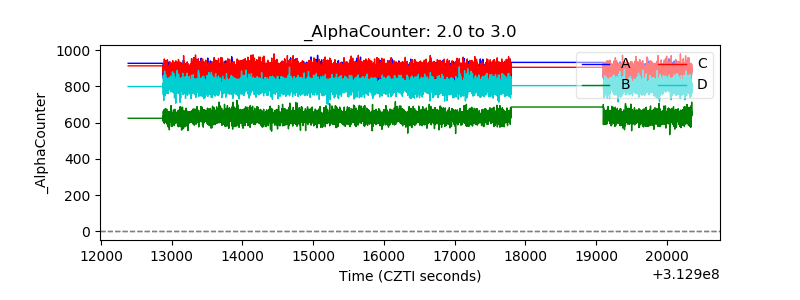 |
| _CPM_Rate | 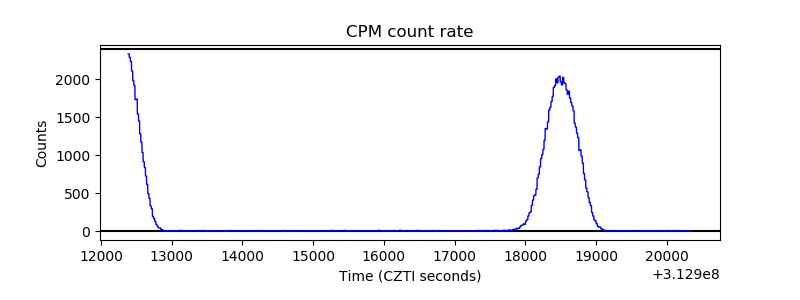 |
| CZT Counter | 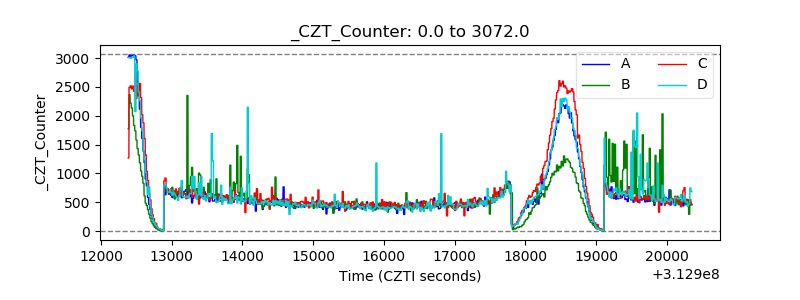 |
| +2.5 Volts monitor | 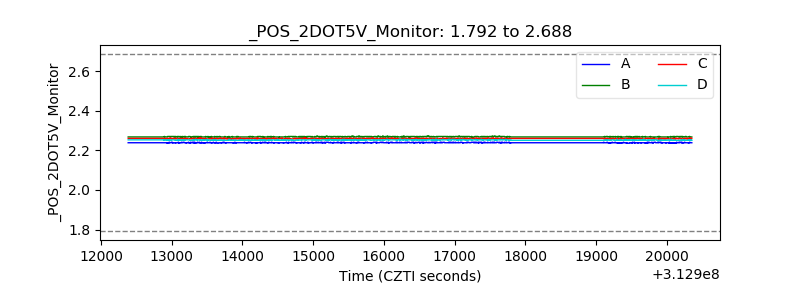 |
| +5 Volts monitor |  |
| _ROLL_ROT | 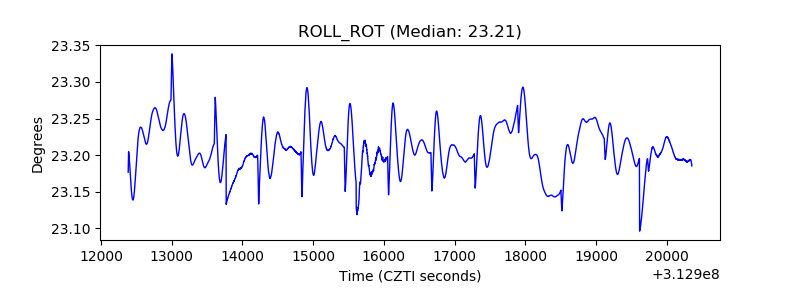 |
| _Roll_DEC | 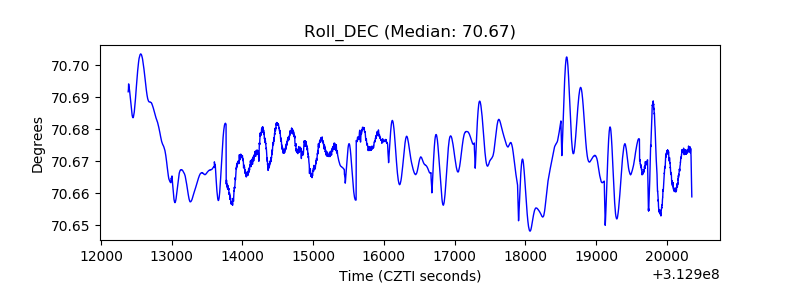 |
| _Roll_RA | 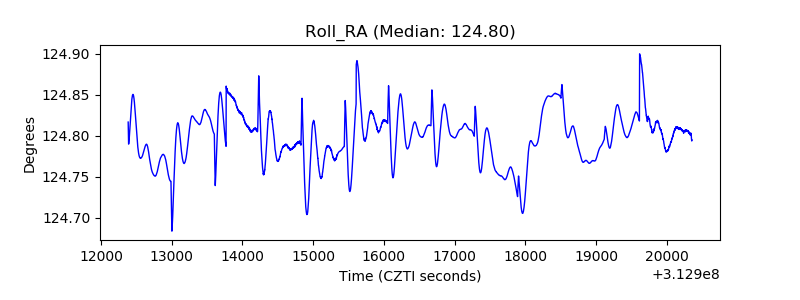 |
| Veto Counter | 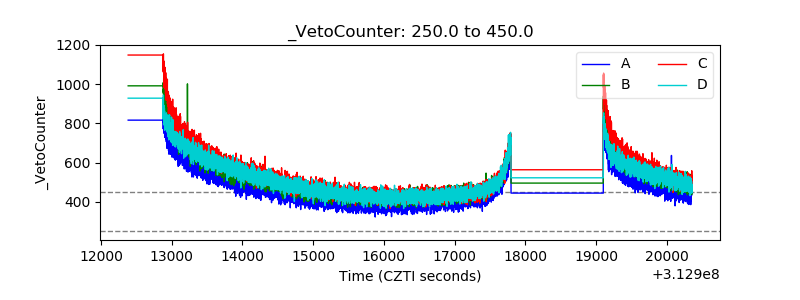 |