| Param | Original file | Final file |
|---|---|---|
| Filename | modeM0/AS1A07_054T01_9000003348_22582cztM0_level2.evt | modeM0/AS1A07_054T01_9000003348_22582cztM0_level2_quad_clean.evt |
| Size (bytes) | 165,850,560 | 45,221,760 |
| Size | 158.2 MB | 43.1 MB |
| Events in quadrant A | 1,039,215 | 312,698 |
| Events in quadrant B | 1,367,237 | 310,382 |
| Events in quadrant C | 1,109,413 | 306,080 |
| Events in quadrant D | 1,367,386 | 293,401 |
| Mode M9 | |||
|---|---|---|---|
| Quadrant | BADHDUFLAG | Total packets | Discarded packets |
| A | 0 | 3 | 0 |
| B | 0 | 4 | 0 |
| C | 0 | 4 | 0 |
| D | 0 | 4 | 0 |
| Mode SS | |||
|---|---|---|---|
| Quadrant | BADHDUFLAG | Total packets | Discarded packets |
| A | 0 | 40 | 0 |
| B | 0 | 40 | 0 |
| C | 0 | 40 | 0 |
| D | 0 | 40 | 0 |
| Mode M0 | |||
|---|---|---|---|
| Quadrant | BADHDUFLAG | Total packets | Discarded packets |
| A | 0 | 4306 | 1 |
| B | 0 | 5399 | 1 |
| C | 0 | 4509 | 1 |
| D | 0 | 5371 | 1 |
| Quadrant | Total seconds | Saturated seconds | Saturation percentage |
|---|---|---|---|
| A | 2020 | 6 | 0.297030% |
| B | 2020 | 109 | 5.396040% |
| C | 2020 | 32 | 1.584158% |
| D | 2020 | 93 | 4.603960% |
Noise dominated data is calculated using 1-second bins in cleaned event files. If a bin has >2000 counts, and if more than 50% of those come from <1% of pixels, then it is considered to be noise-dominated and hence unusable.
| Quadrant | # 1 sec bins | Bins with >0 counts | Bins with >2000 counts | High rate bins dominated by noise | Noise dominated (total time) | Noise dominated (detector-on time) | Marked lightcurve |
|---|---|---|---|---|---|---|---|
| A | 2020 | 2020 | 0 | 0 | 0.00% | 0.00% | 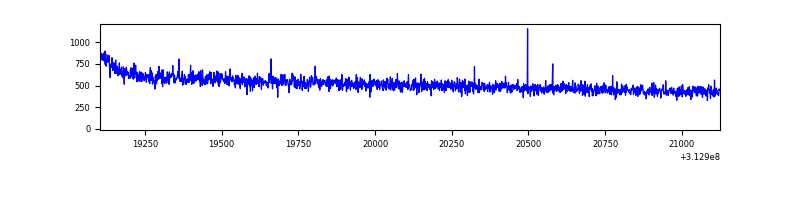 |
| B | 2020 | 2020 | 18 | 18 | 0.89% | 0.89% | 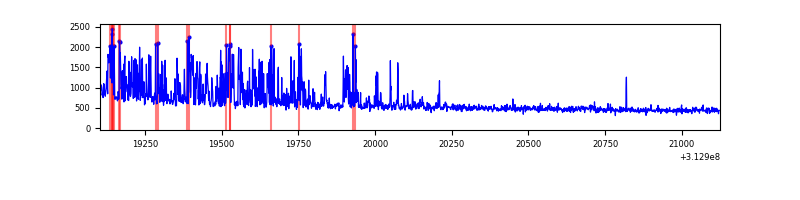 |
| C | 2020 | 2020 | 0 | 0 | 0.00% | 0.00% | 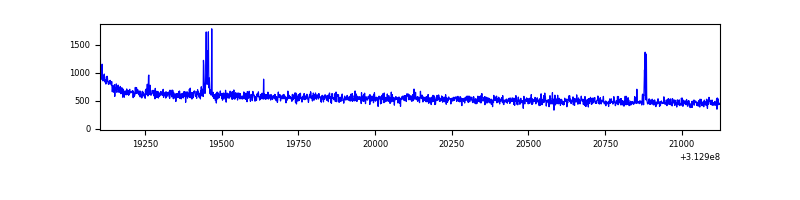 |
| D | 2020 | 2020 | 59 | 59 | 2.92% | 2.92% | 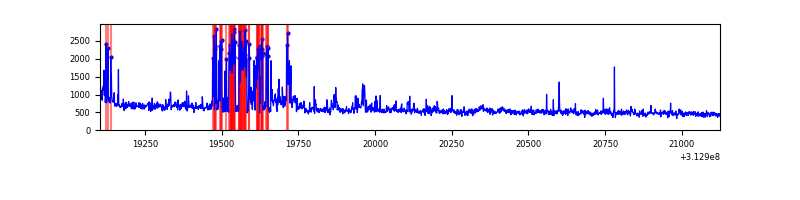 |
Top three noisy pixels from each quadrant. If the there are fewer than three noisy pixels in the level2.evt file, extra rows are filled as -1
| Pixel properties | Quadrant properties | ||||||
|---|---|---|---|---|---|---|---|
| Quadrant | DetID | PixID | Counts | Sigma | Mean | Median | Sigma |
| A | 13 | 254 | 3792 | 64.5 | 269 | 263 | 54.7 |
| A | 0 | 226 | 2386 | 38.8 | 269 | 263 | 54.7 |
| A | 3 | 137 | 1996 | 31.67 | 269 | 263 | 54.7 |
| B | 15 | 33 | 291321 | 5701.88 | 265 | 259 | 51.0 |
| B | 15 | 35 | 18412 | 355.62 | 265 | 259 | 51.0 |
| B | 0 | 190 | 8755 | 166.44 | 265 | 259 | 51.0 |
| C | 14 | 238 | 42861 | 672.11 | 267 | 268 | 63.4 |
| C | 0 | 207 | 11470 | 176.76 | 267 | 268 | 63.4 |
| C | 10 | 222 | 4970 | 74.2 | 267 | 268 | 63.4 |
| D | 1 | 52 | 305792 | 4622.5 | 266 | 258 | 66.1 |
| D | 1 | 239 | 19005 | 283.63 | 266 | 258 | 66.1 |
| D | 2 | 153 | 15457 | 229.95 | 266 | 258 | 66.1 |
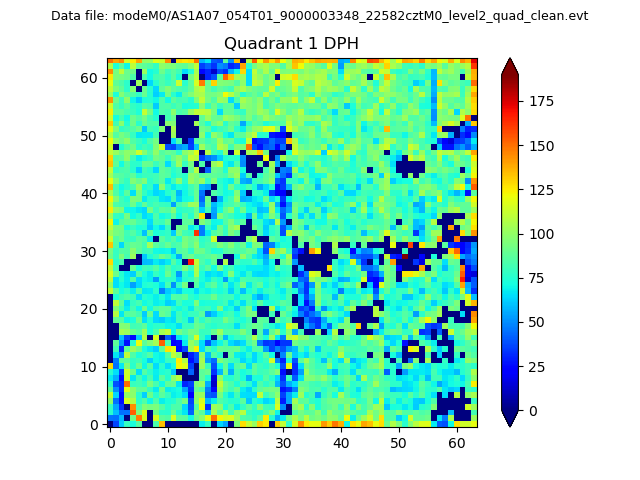
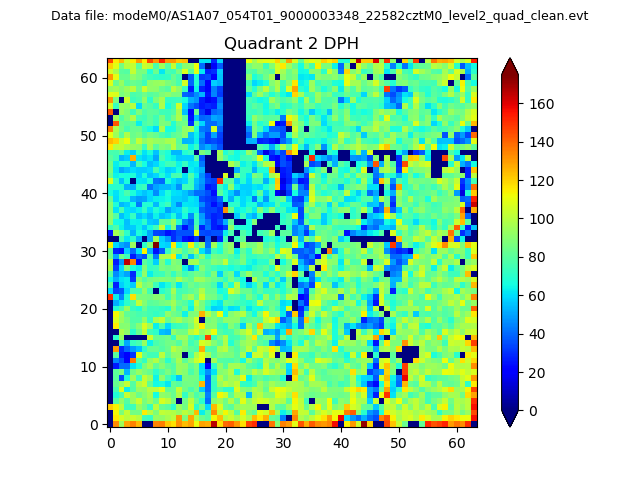
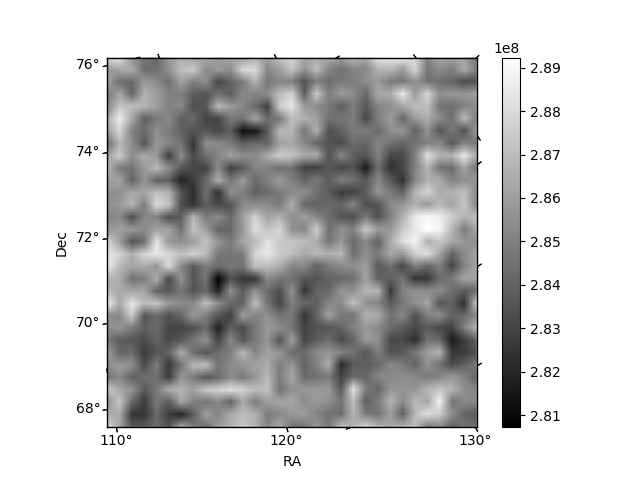
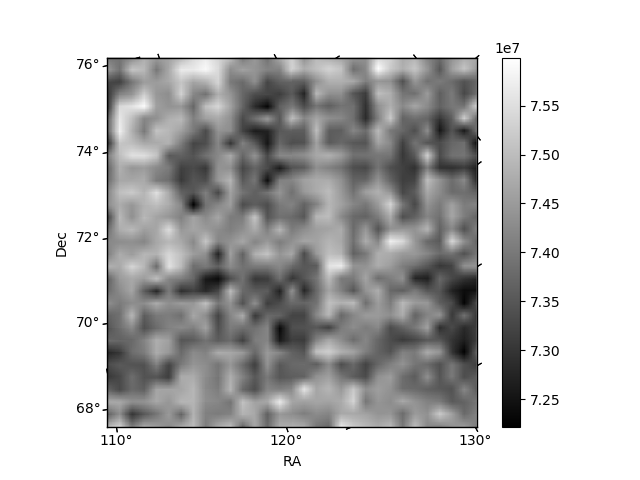
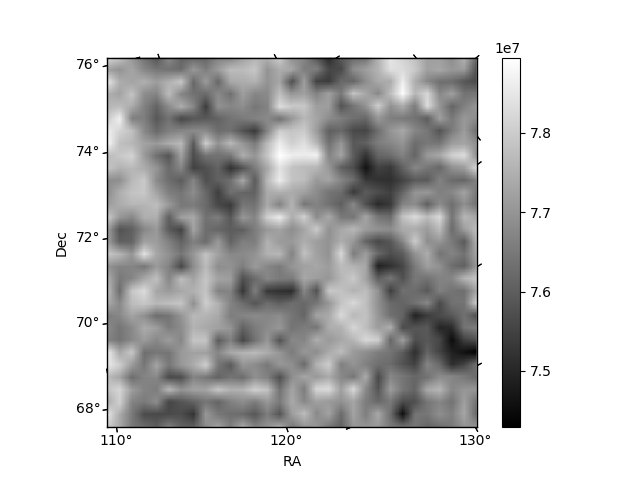
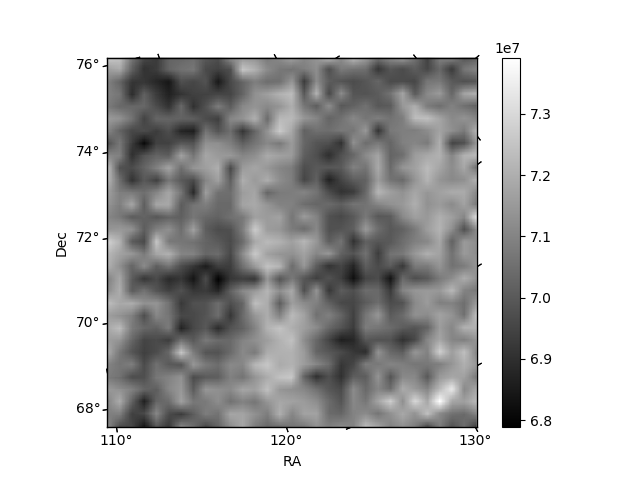
Histogram calculated using DETX and DETY for each event in the final _common_clean file
| Quadrant A |  |
 |
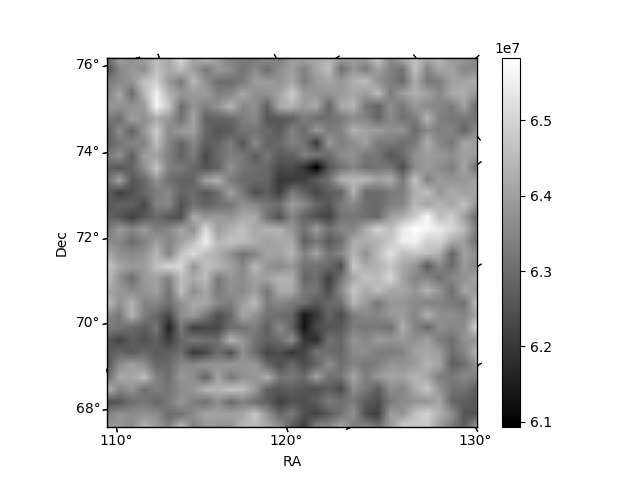
Quadrant B |
|---|---|---|---|
| Quadrant D | 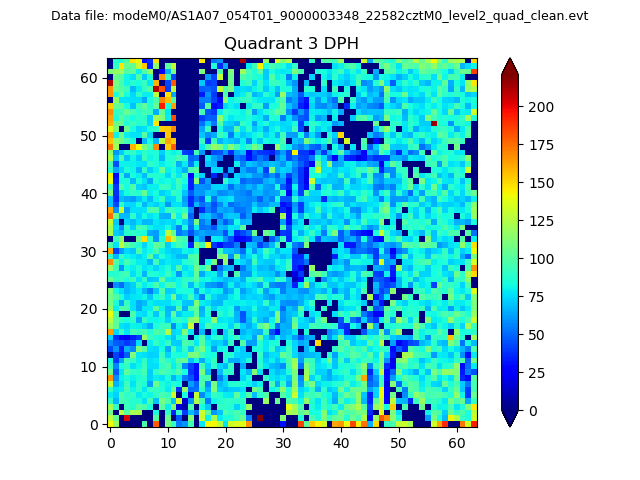 |
 |
Quadrant C |
| Plot type | Count rate plots | Images |
|---|---|---|
| Comparison with Poisson distribution Blue bars denote a histogram of data divided into 1 sec bins. Red curve is a Poisson curve with rate = median count rate of data. |
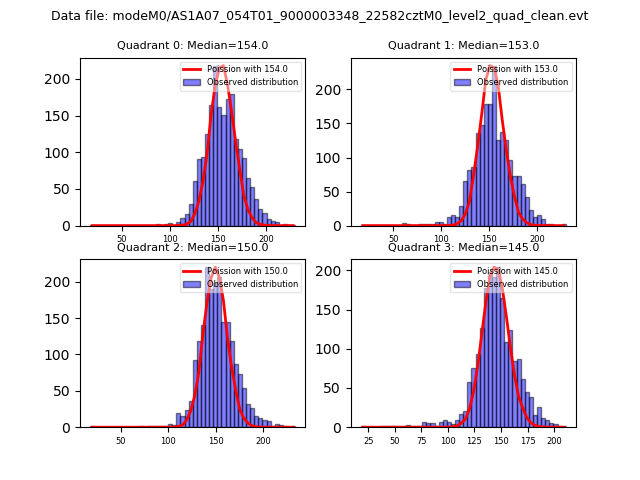 |
 |
| Quadrant-wise count rates Data is divided into 100 sec bins |
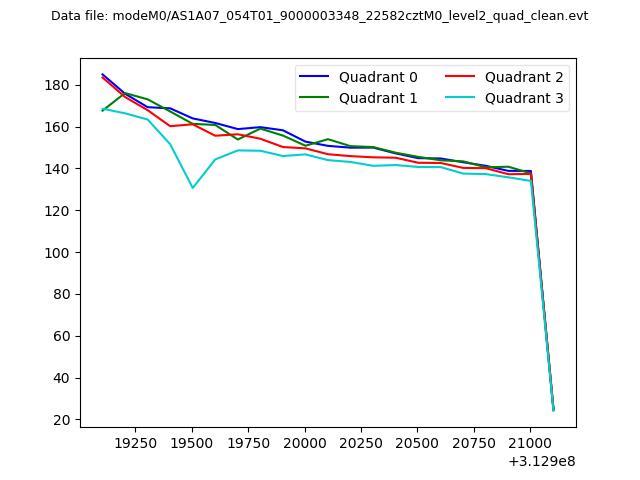 |
|
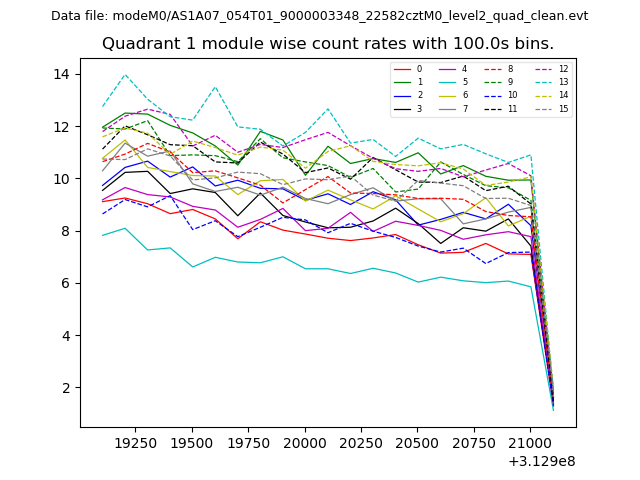
| Module-wise count rates for Quadrant A Data is divided into 100 sec bins |
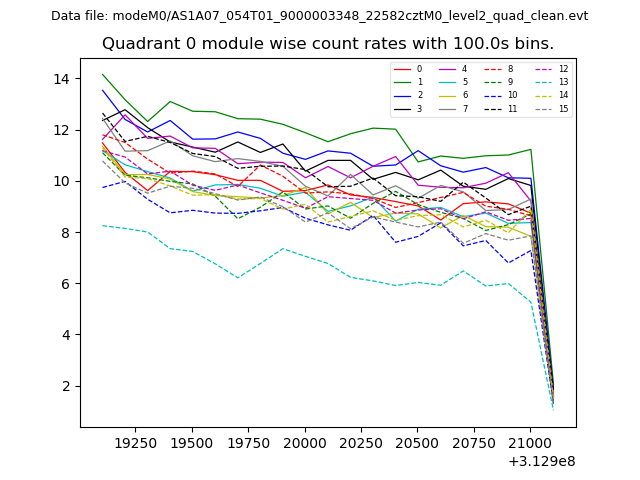 |
 |
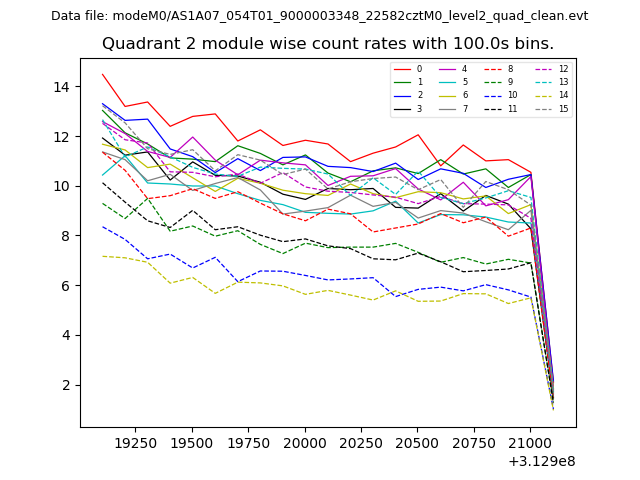
| Module-wise count rates for Quadrant B Data is divided into 100 sec bins |
 |
 |
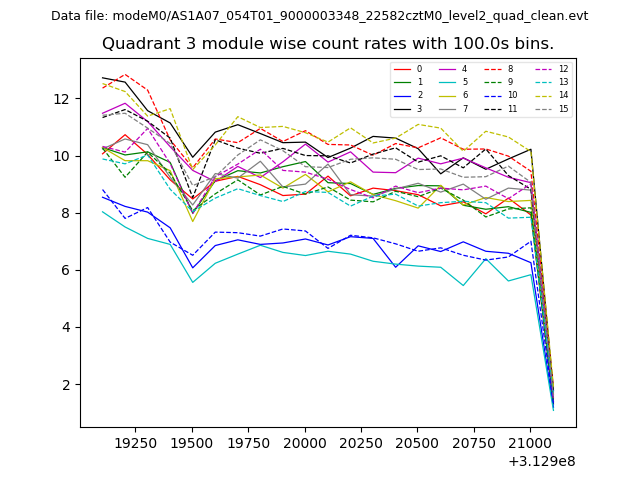
| Module-wise count rates for Quadrant C Data is divided into 100 sec bins |
 |
 |
| Module-wise count rates for Quadrant D Data is divided into 100 sec bins |
 |
 |
| Parameter | Plot |
|---|---|
| CZT HV Monitor | 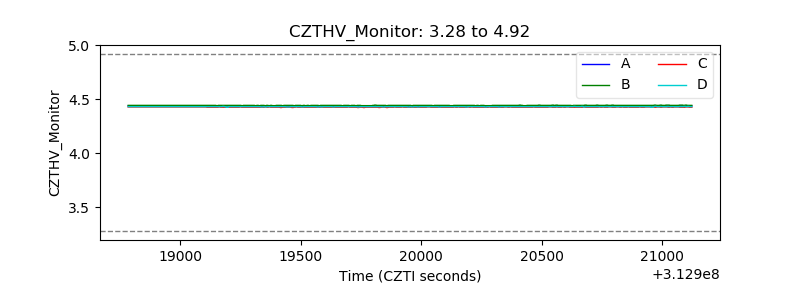 |
| D_VDD | 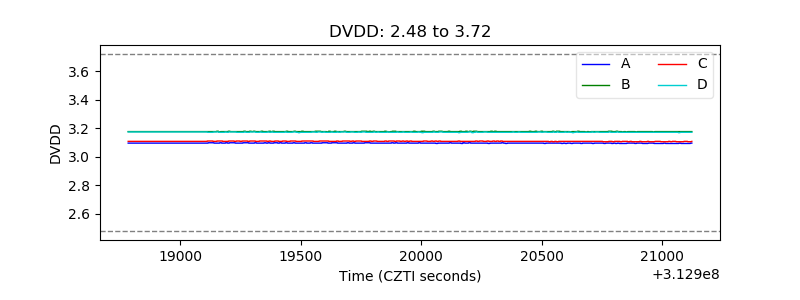 |
| Temperature 1 | 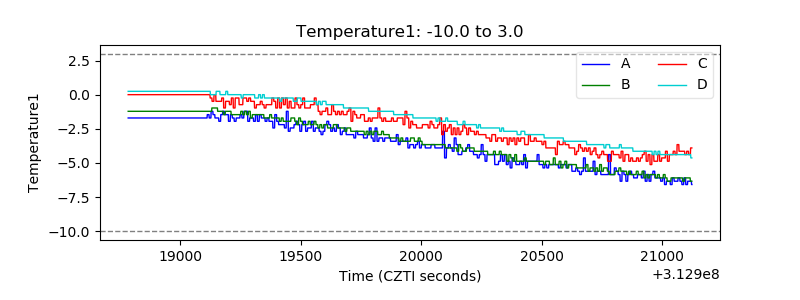 |
| Veto HV Monitor |  |
| Veto LLD | 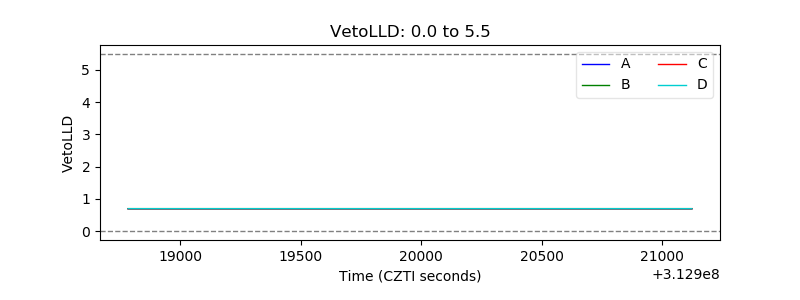 |
| Alpha Counter | 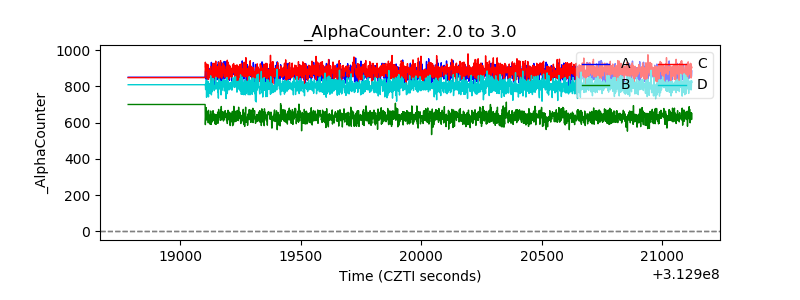 |
| _CPM_Rate |  |
| CZT Counter | 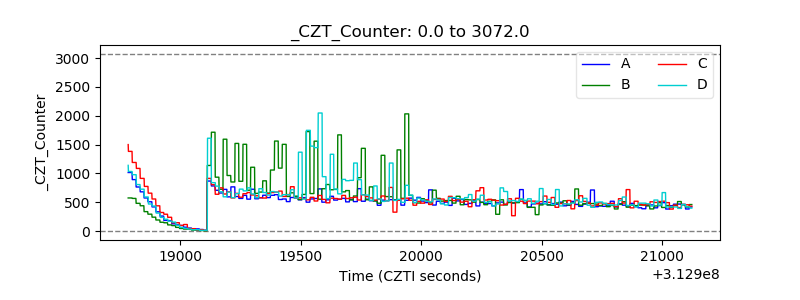 |
| +2.5 Volts monitor |  |
| +5 Volts monitor |  |
| _ROLL_ROT | 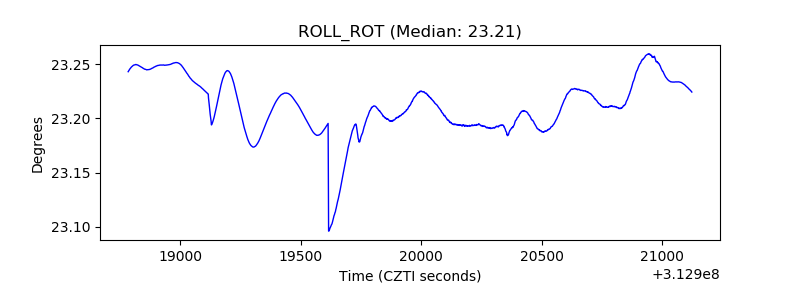 |
| _Roll_DEC | 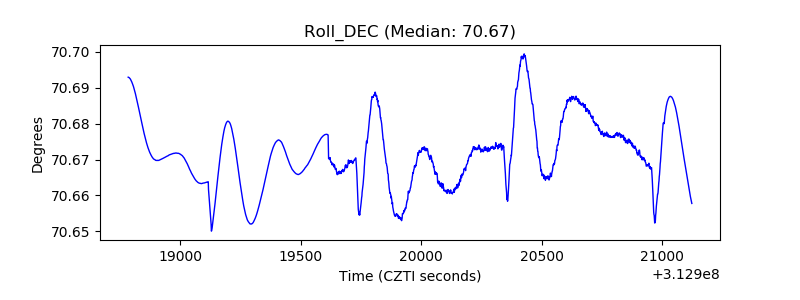 |
| _Roll_RA | 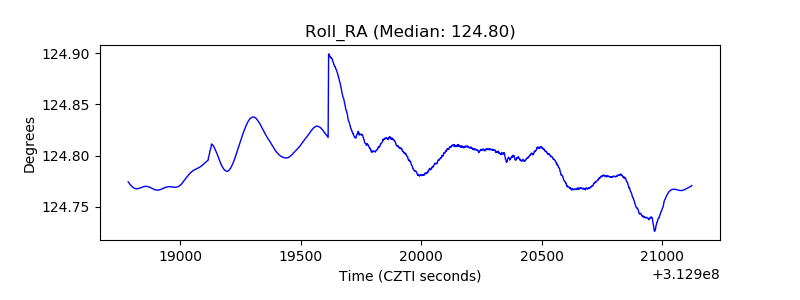 |
| Veto Counter | 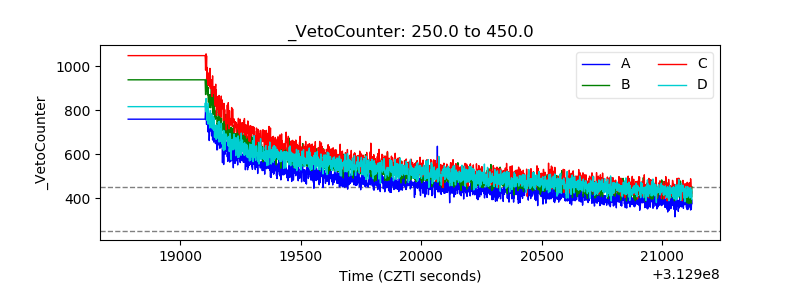 |