| Param | Original file | Final file |
|---|---|---|
| Filename | modeM0/AS1C05_002T01_9000003352cztM0_level2.fits | modeM0/AS1C05_002T01_9000003352cztM0_level2_quad_clean.evt |
| Size (bytes) | 146,900,160 | 163,062,720 |
| Size | 140.1 MB | 155.5 MB |
| Events in quadrant A | 886,918 | 998,641 |
| Events in quadrant B | 855,322 | 1,006,229 |
| Events in quadrant C | 873,250 | 967,124 |
| Events in quadrant D | 752,086 | 884,714 |
| Mode SS | |||
|---|---|---|---|
| Quadrant | BADHDUFLAG | Total packets | Discarded packets |
| A | 0 | 316 | 0 |
| B | 0 | 316 | 0 |
| C | 0 | 316 | 0 |
| D | 0 | 316 | 0 |
| Mode M9 | |||
|---|---|---|---|
| Quadrant | BADHDUFLAG | Total packets | Discarded packets |
| A | 0 | 8 | 0 |
| B | 0 | 8 | 0 |
| C | 0 | 8 | 0 |
| D | 0 | 8 | 0 |
| Mode M0 | |||
|---|---|---|---|
| Quadrant | BADHDUFLAG | Total packets | Discarded packets |
| A | 0 | 32008 | 0 |
| B | 0 | 32466 | 0 |
| C | 0 | 32296 | 0 |
| D | 0 | 40784 | 0 |
| Quadrant | Total seconds | Saturated seconds | Saturation percentage |
|---|---|---|---|
| A | 15681 | 56 | 0.357120% |
| B | 15681 | 99 | 0.631337% |
| C | 15681 | 160 | 1.020343% |
| D | 15681 | 467 | 2.978126% |
Noise dominated data is calculated using 1-second bins in cleaned event files. If a bin has >2000 counts, and if more than 50% of those come from <1% of pixels, then it is considered to be noise-dominated and hence unusable.
| Quadrant | # 1 sec bins | Bins with >0 counts | Bins with >2000 counts | High rate bins dominated by noise | Noise dominated (total time) | Noise dominated (detector-on time) | Marked lightcurve |
|---|---|---|---|---|---|---|---|
| A | 16431 | 15681 | 0 | 0 | 0.00% | 0.00% |  |
| B | 16431 | 15681 | 0 | 0 | 0.00% | 0.00% |  |
| C | 16431 | 15681 | 0 | 0 | 0.00% | 0.00% |  |
| D | 16431 | 15679 | 0 | 0 | 0.00% | 0.00% |  |
Top three noisy pixels from each quadrant. If the there are fewer than three noisy pixels in the level2.evt file, extra rows are filled as -1
| Pixel properties | Quadrant properties | ||||||
|---|---|---|---|---|---|---|---|
| Quadrant | DetID | PixID | Counts | Sigma | Mean | Median | Sigma |
| A | 0 | 29 | 828 | 10.07 | 231 | 217 | 60.7 |
| A | 7 | 110 | 724 | 8.36 | 231 | 217 | 60.7 |
| A | 9 | 19 | 653 | 7.19 | 231 | 217 | 60.7 |
| B | 2 | 9 | 699 | 10.44 | 226 | 215 | 46.4 |
| B | 3 | 17 | 579 | 7.85 | 226 | 215 | 46.4 |
| B | 2 | 8 | 576 | 7.79 | 226 | 215 | 46.4 |
| C | 1 | 81 | 700 | 8.01 | 230 | 215 | 60.5 |
| C | 1 | 80 | 670 | 7.52 | 230 | 215 | 60.5 |
| C | 12 | 241 | 615 | 6.61 | 230 | 215 | 60.5 |
| D | 3 | 14 | 560 | 6.21 | 214 | 196 | 58.6 |
| D | 7 | 3 | 557 | 6.16 | 214 | 196 | 58.6 |
| D | 6 | 231 | 532 | 5.73 | 214 | 196 | 58.6 |
Histogram calculated using DETX and DETY for each event in the final _common_clean file
| Quadrant A | 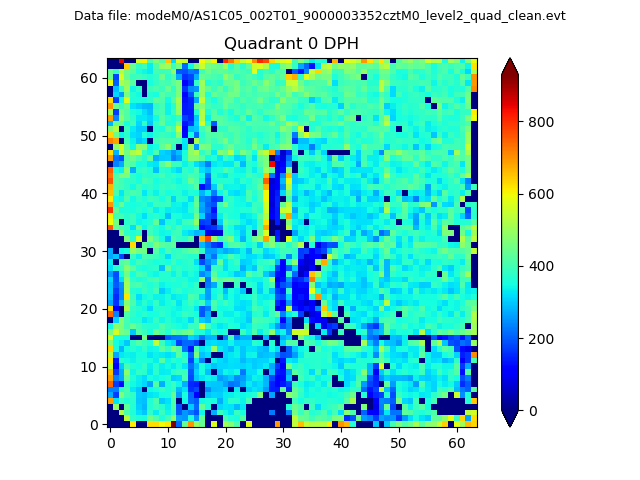 |
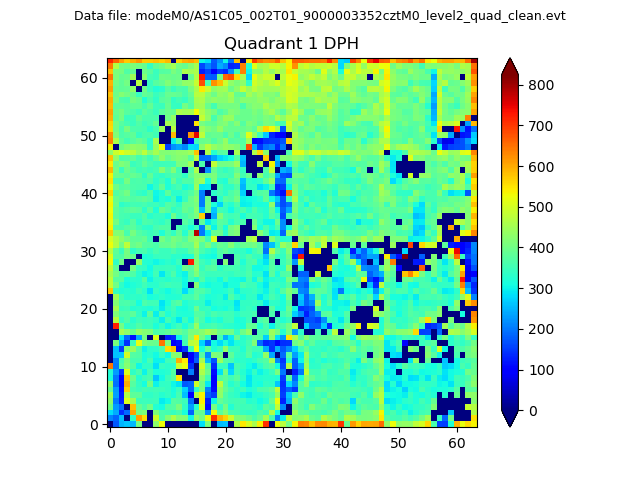 |
Quadrant B |
|---|---|---|---|
| Quadrant D | 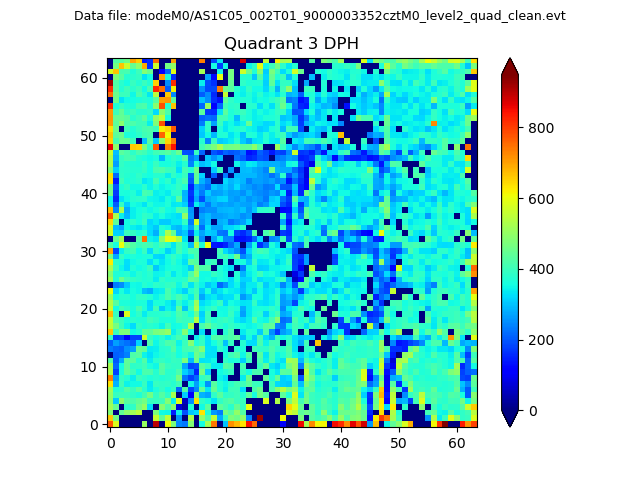 |
 |
Quadrant C |
| Plot type | Count rate plots | Images |
|---|---|---|
| Comparison with Poisson distribution Blue bars denote a histogram of data divided into 1 sec bins. Red curve is a Poisson curve with rate = median count rate of data. |
 |
 |
| Quadrant-wise count rates Data is divided into 100 sec bins |
 |
|
| Module-wise count rates for Quadrant A Data is divided into 100 sec bins |
 |
 |
| Module-wise count rates for Quadrant B Data is divided into 100 sec bins |
 |
 |
| Module-wise count rates for Quadrant C Data is divided into 100 sec bins |
 |
 |
| Module-wise count rates for Quadrant D Data is divided into 100 sec bins |
 |
 |
| Parameter | Plot |
|---|---|
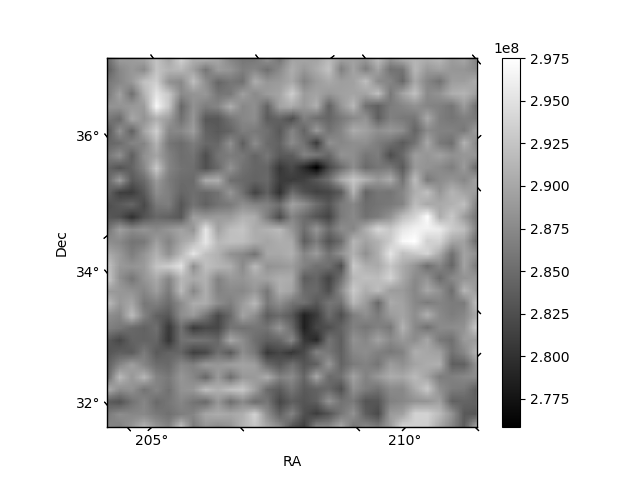
| CZT HV Monitor |  |
| D_VDD | 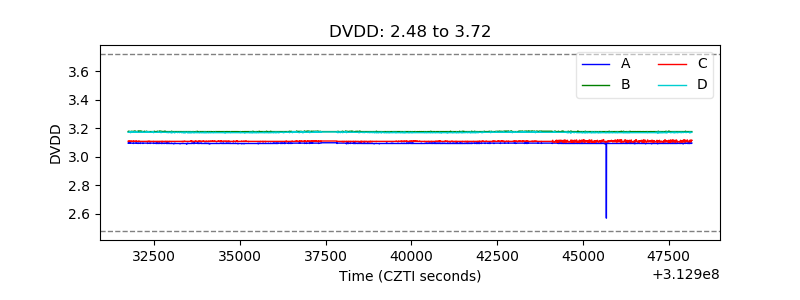 |
| Temperature 1 |  |
| Veto HV Monitor |  |
| Veto LLD |  |
| Alpha Counter |  |
| _CPM_Rate |  |
| CZT Counter |  |
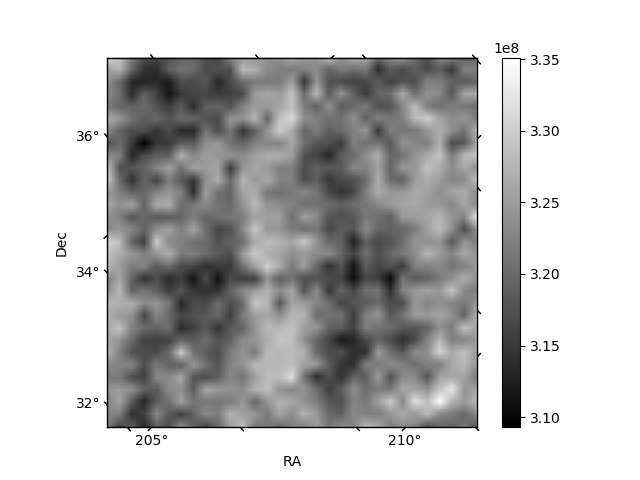
| +2.5 Volts monitor |  |
| +5 Volts monitor |  |
| _ROLL_ROT |  |
| _Roll_DEC |  |
| _Roll_RA |  |
| Veto Counter |  |