| Param | Original file | Final file |
|---|---|---|
| Filename | modeM0/AS1C05_002T01_9000003352_22583cztM0_level2.evt | modeM0/AS1C05_002T01_9000003352_22583cztM0_level2_quad_clean.evt |
| Size (bytes) | 91,321,920 | 5,218,560 |
| Size | 87.1 MB | 5.0 MB |
| Events in quadrant A | 578,814 | 17,092 |
| Events in quadrant B | 608,223 | 17,537 |
| Events in quadrant C | 601,275 | 17,094 |
| Events in quadrant D | 893,612 | 15,730 |
| Mode SS | |||
|---|---|---|---|
| Quadrant | BADHDUFLAG | Total packets | Discarded packets |
| A | 0 | 24 | 0 |
| B | 0 | 24 | 0 |
| C | 0 | 24 | 0 |
| D | 0 | 24 | 0 |
| Mode M0 | |||
|---|---|---|---|
| Quadrant | BADHDUFLAG | Total packets | Discarded packets |
| A | 0 | 2397 | 0 |
| B | 0 | 2466 | 0 |
| C | 0 | 2419 | 1 |
| D | 0 | 3407 | 0 |
| Quadrant | Total seconds | Saturated seconds | Saturation percentage |
|---|---|---|---|
| A | 1187 | 1 | 0.084246% |
| B | 1187 | 4 | 0.336984% |
| C | 1186 | 15 | 1.264755% |
| D | 1186 | 63 | 5.311973% |
Noise dominated data is calculated using 1-second bins in cleaned event files. If a bin has >2000 counts, and if more than 50% of those come from <1% of pixels, then it is considered to be noise-dominated and hence unusable.
| Quadrant | # 1 sec bins | Bins with >0 counts | Bins with >2000 counts | High rate bins dominated by noise | Noise dominated (total time) | Noise dominated (detector-on time) | Marked lightcurve |
|---|---|---|---|---|---|---|---|
| A | 1187 | 1187 | 0 | 0 | 0.00% | 0.00% |  |
| B | 1187 | 1187 | 0 | 0 | 0.00% | 0.00% | 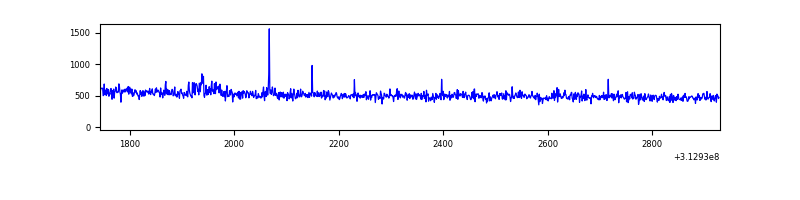 |
| C | 1186 | 1186 | 0 | 0 | 0.00% | 0.00% | 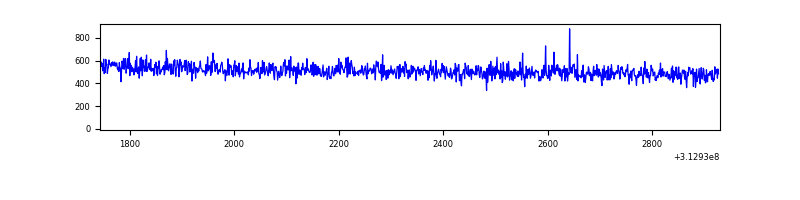 |
| D | 1186 | 1186 | 61 | 61 | 5.14% | 5.14% | 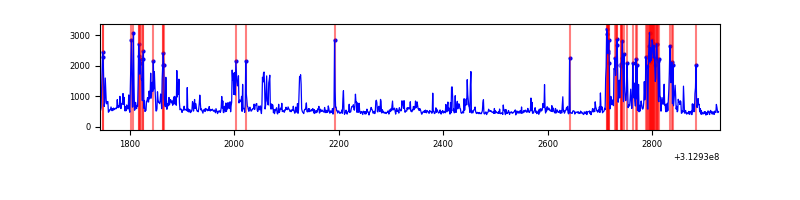 |
Top three noisy pixels from each quadrant. If the there are fewer than three noisy pixels in the level2.evt file, extra rows are filled as -1
| Pixel properties | Quadrant properties | ||||||
|---|---|---|---|---|---|---|---|
| Quadrant | DetID | PixID | Counts | Sigma | Mean | Median | Sigma |
| A | 13 | 254 | 2220 | 63.63 | 149 | 145 | 32.6 |
| A | 0 | 226 | 1294 | 35.24 | 149 | 145 | 32.6 |
| A | 3 | 137 | 1270 | 34.5 | 149 | 145 | 32.6 |
| B | 0 | 230 | 11914 | 381.21 | 150 | 147 | 30.9 |
| B | 0 | 190 | 5529 | 174.36 | 150 | 147 | 30.9 |
| B | 12 | 111 | 3429 | 106.32 | 150 | 147 | 30.9 |
| C | 14 | 238 | 23526 | 636.51 | 147 | 147 | 36.7 |
| C | 10 | 22 | 1824 | 45.66 | 147 | 147 | 36.7 |
| C | 13 | 61 | 1062 | 24.91 | 147 | 147 | 36.7 |
| D | 1 | 52 | 289844 | 7581.83 | 146 | 141 | 38.2 |
| D | 7 | 223 | 16113 | 418.0 | 146 | 141 | 38.2 |
| D | 13 | 172 | 11628 | 300.63 | 146 | 141 | 38.2 |
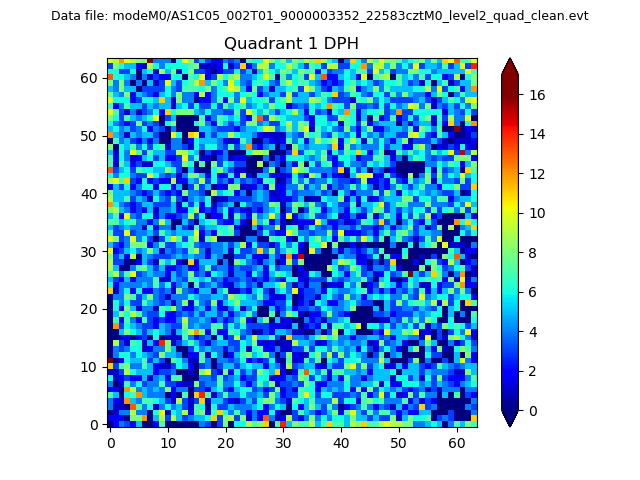
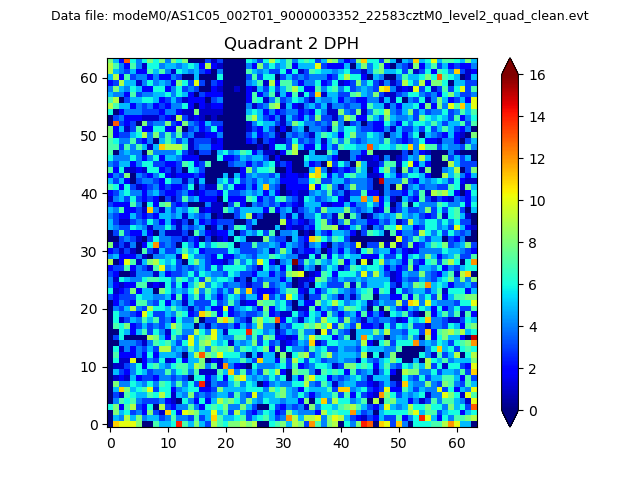
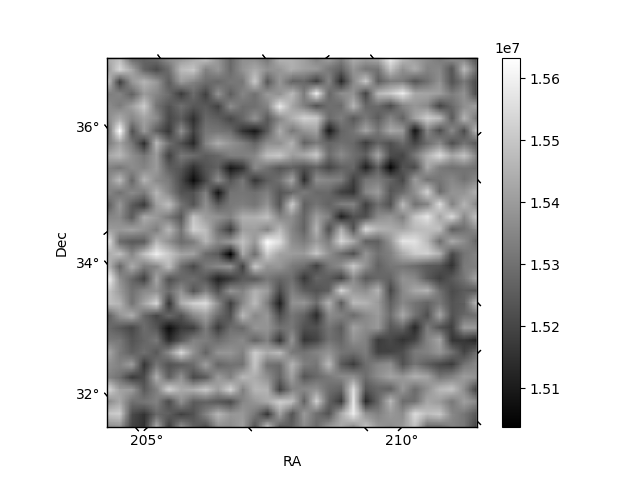
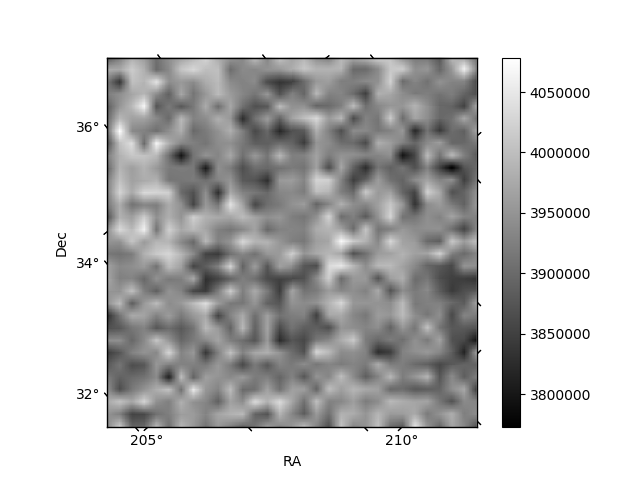
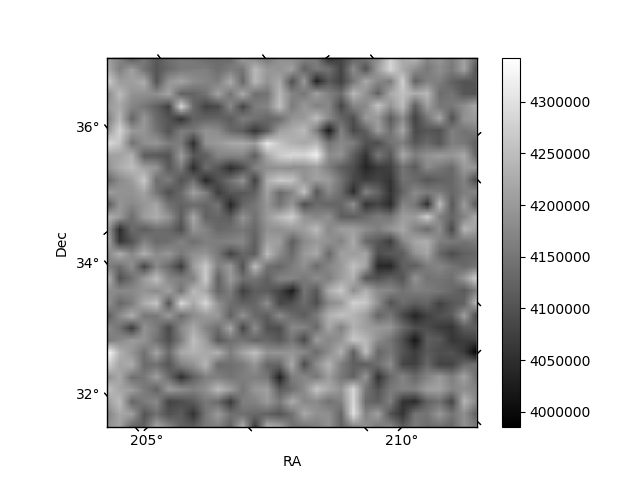
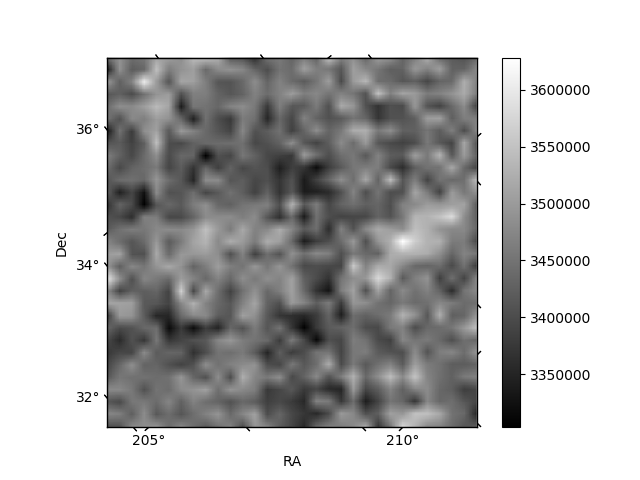
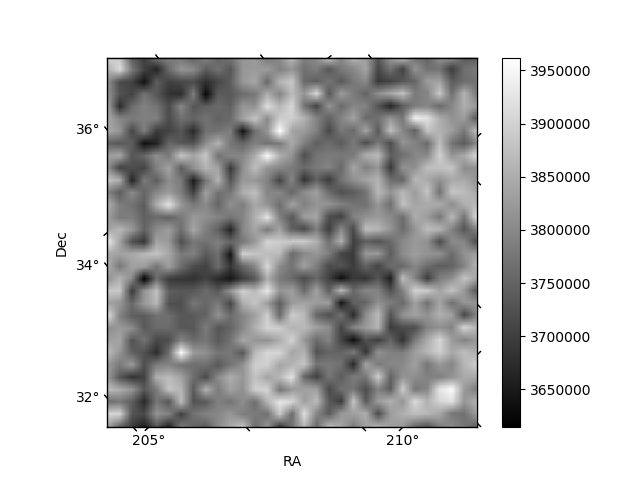
Histogram calculated using DETX and DETY for each event in the final _common_clean file
| Quadrant A | 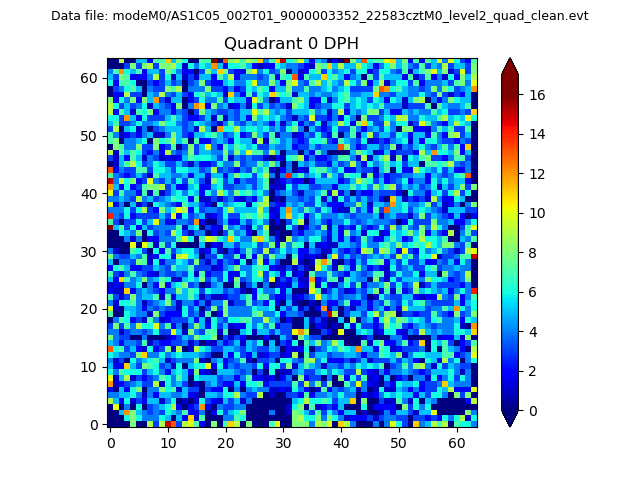 |
 |
Quadrant B |
|---|---|---|---|
| Quadrant D | 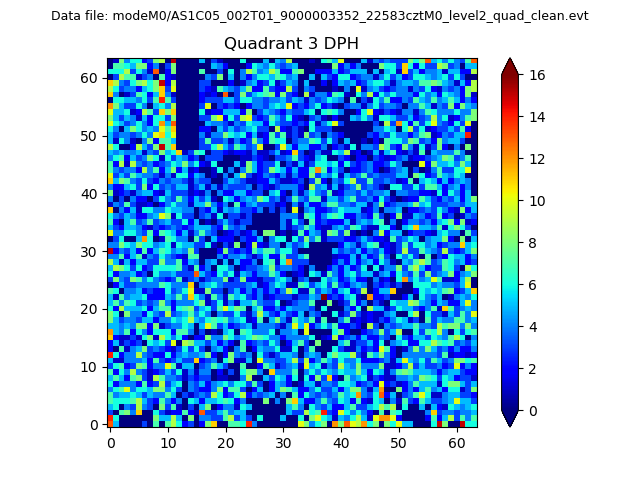 |
 |
Quadrant C |
| Plot type | Count rate plots | Images |
|---|---|---|
| Comparison with Poisson distribution Blue bars denote a histogram of data divided into 1 sec bins. Red curve is a Poisson curve with rate = median count rate of data. |
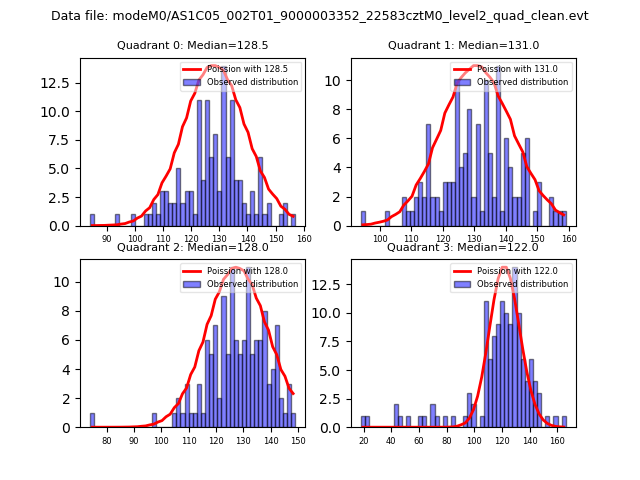 |
 |
| Quadrant-wise count rates Data is divided into 100 sec bins |
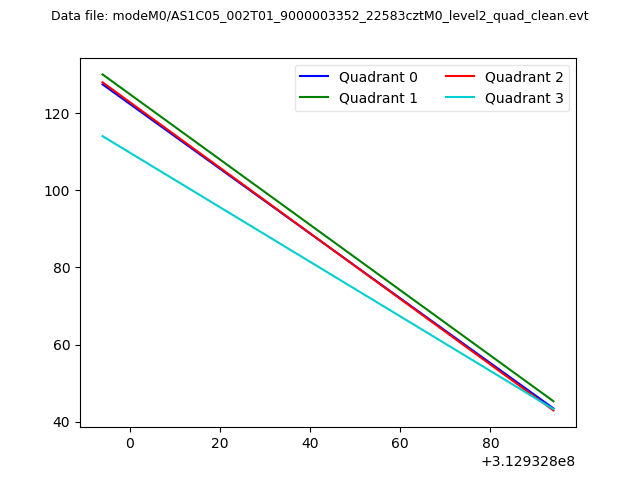 |
|
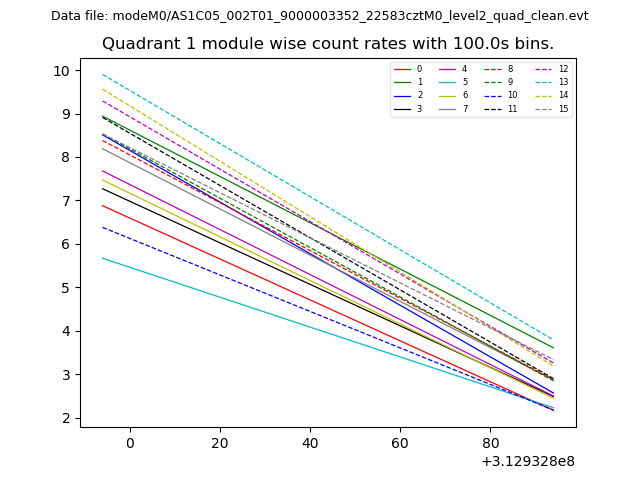
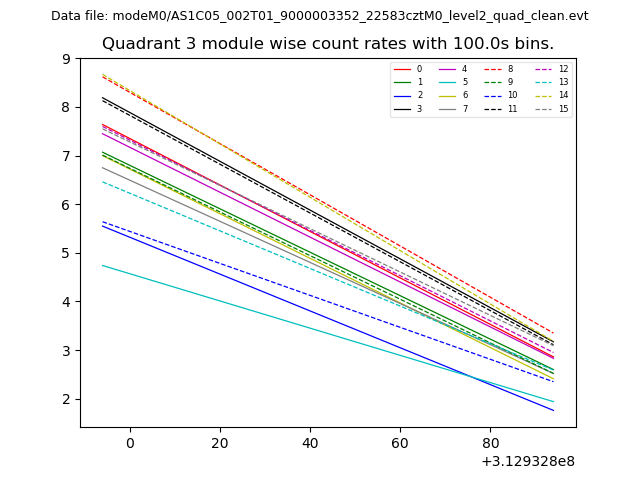
| Module-wise count rates for Quadrant A Data is divided into 100 sec bins |
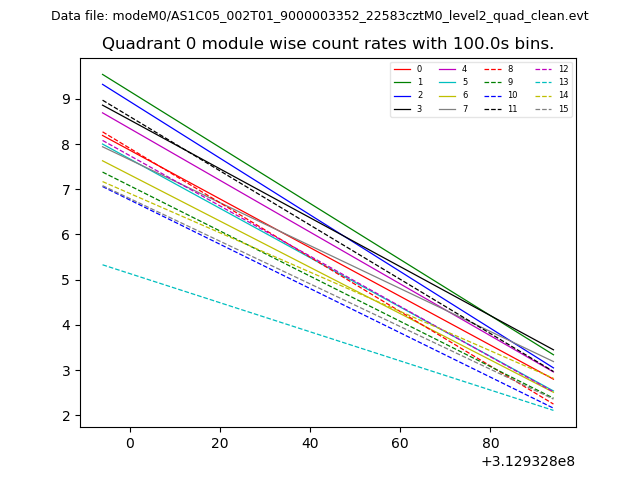 |
 |
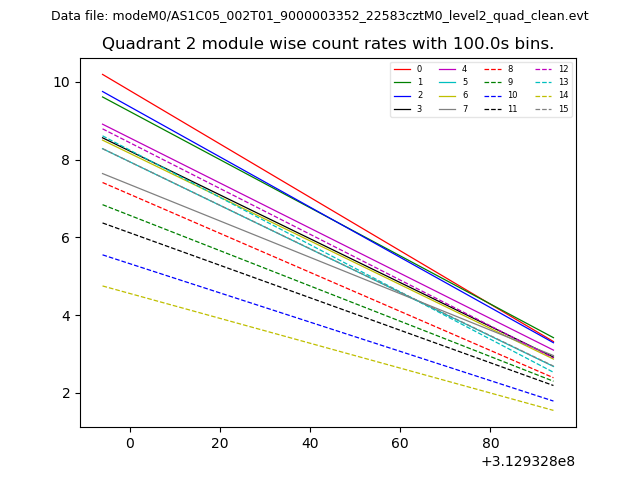
| Module-wise count rates for Quadrant B Data is divided into 100 sec bins |
 |
 |
| Module-wise count rates for Quadrant C Data is divided into 100 sec bins |
 |
 |
| Module-wise count rates for Quadrant D Data is divided into 100 sec bins |
 |
 |
| Parameter | Plot |
|---|---|
| CZT HV Monitor | 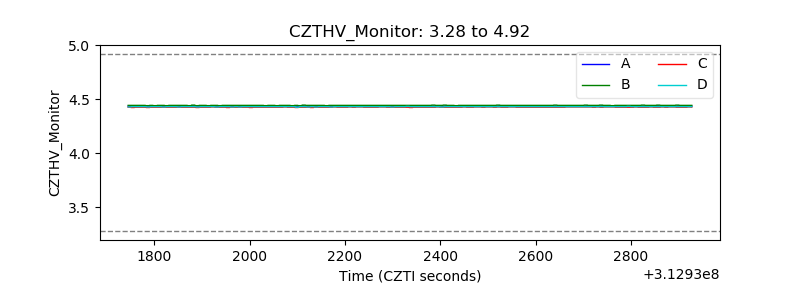 |
| D_VDD |  |
| Temperature 1 | 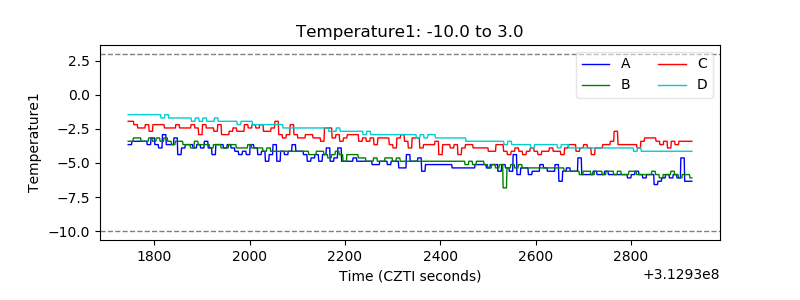 |
| Veto HV Monitor | 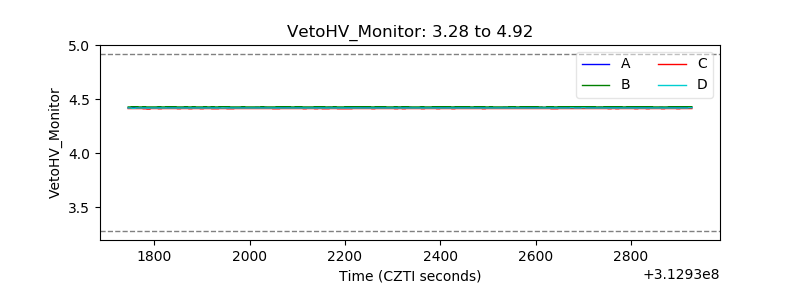 |
| Veto LLD | 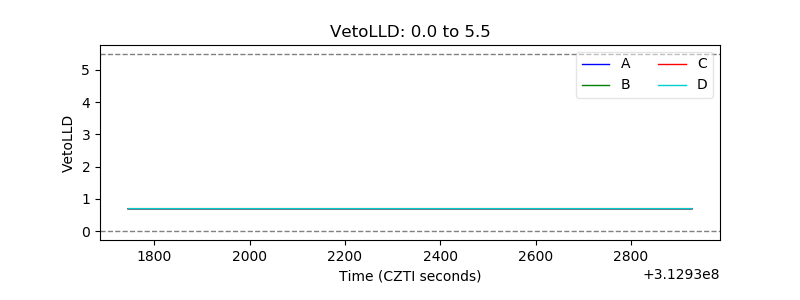 |
| Alpha Counter | 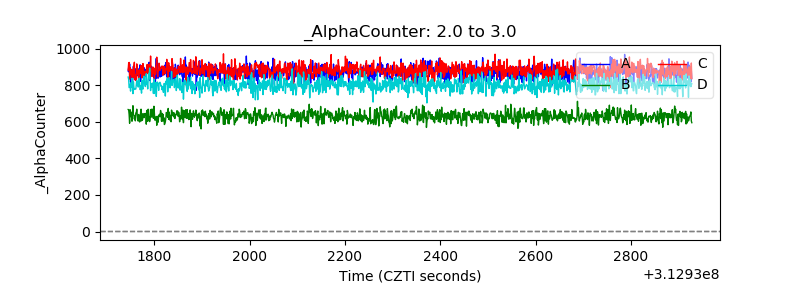 |
| _CPM_Rate | 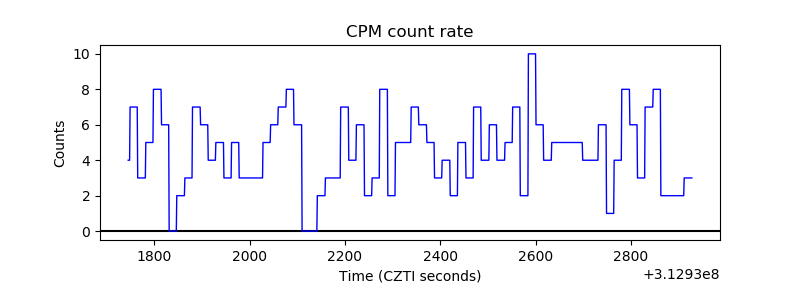 |
| CZT Counter | 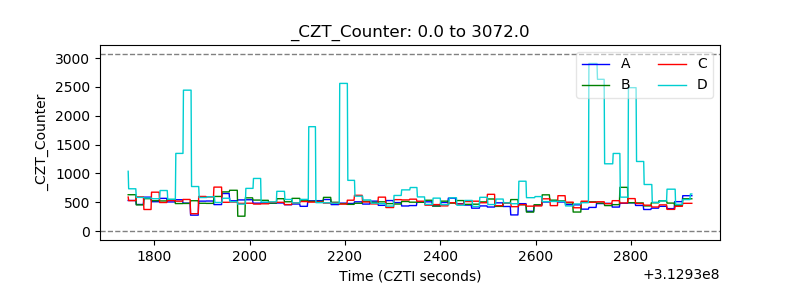 |
| +2.5 Volts monitor |  |
| +5 Volts monitor |  |
| _ROLL_ROT | 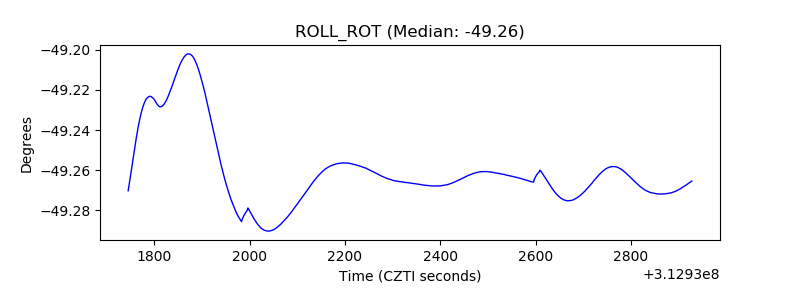 |
| _Roll_DEC | 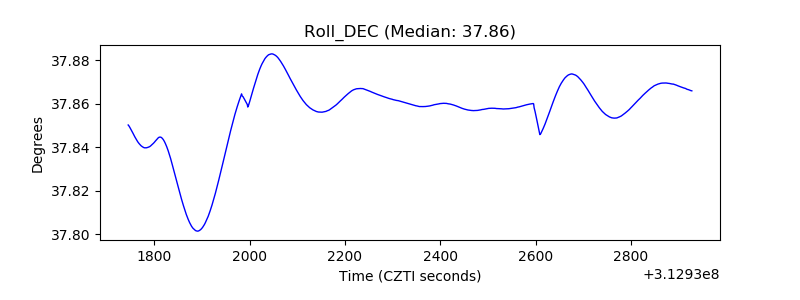 |
| _Roll_RA | 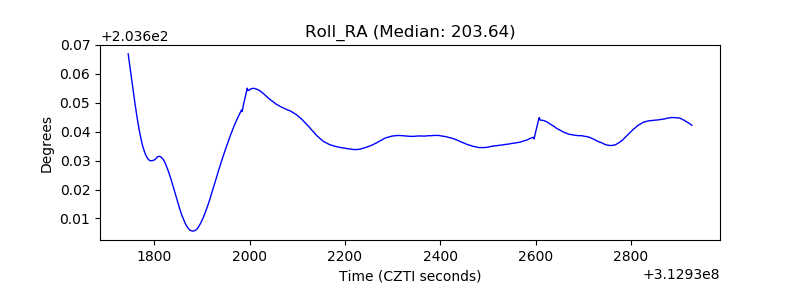 |
| Veto Counter | 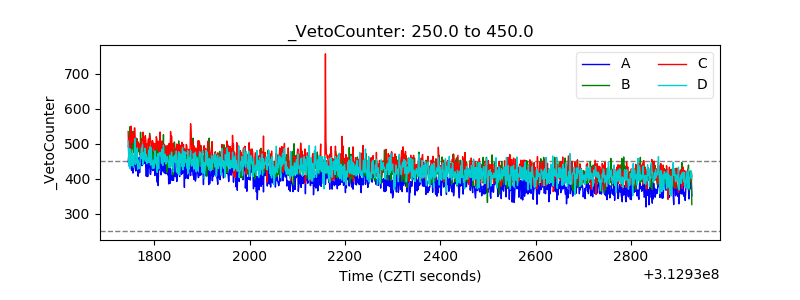 |