| Param | Original file | Final file |
|---|---|---|
| Filename | modeM0/AS1C05_002T01_9000003352_22584cztM0_level2.evt | modeM0/AS1C05_002T01_9000003352_22584cztM0_level2_quad_clean.evt |
| Size (bytes) | 485,997,120 | 88,928,640 |
| Size | 463.5 MB | 84.8 MB |
| Events in quadrant A | 3,287,477 | 553,035 |
| Events in quadrant B | 3,382,520 | 563,203 |
| Events in quadrant C | 3,393,074 | 549,038 |
| Events in quadrant D | 4,174,602 | 534,847 |
| Mode SS | |||
|---|---|---|---|
| Quadrant | BADHDUFLAG | Total packets | Discarded packets |
| A | 0 | 142 | 0 |
| B | 0 | 142 | 0 |
| C | 0 | 142 | 0 |
| D | 0 | 142 | 0 |
| Mode M9 | |||
|---|---|---|---|
| Quadrant | BADHDUFLAG | Total packets | Discarded packets |
| A | 0 | 5 | 0 |
| B | 0 | 5 | 0 |
| C | 0 | 5 | 0 |
| D | 0 | 5 | 0 |
| Mode M0 | |||
|---|---|---|---|
| Quadrant | BADHDUFLAG | Total packets | Discarded packets |
| A | 0 | 14477 | 1 |
| B | 0 | 14638 | 1 |
| C | 0 | 14595 | 1 |
| D | 0 | 17207 | 1 |
| Quadrant | Total seconds | Saturated seconds | Saturation percentage |
|---|---|---|---|
| A | 7083 | 29 | 0.409431% |
| B | 7083 | 46 | 0.649442% |
| C | 7082 | 94 | 1.327309% |
| D | 7082 | 229 | 3.233550% |
Noise dominated data is calculated using 1-second bins in cleaned event files. If a bin has >2000 counts, and if more than 50% of those come from <1% of pixels, then it is considered to be noise-dominated and hence unusable.
| Quadrant | # 1 sec bins | Bins with >0 counts | Bins with >2000 counts | High rate bins dominated by noise | Noise dominated (total time) | Noise dominated (detector-on time) | Marked lightcurve |
|---|---|---|---|---|---|---|---|
| A | 7533 | 7084 | 0 | 0 | 0.00% | 0.00% | 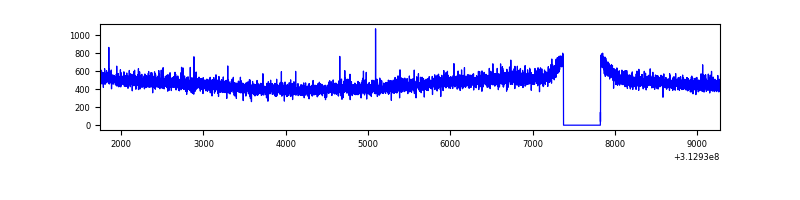 |
| B | 7533 | 7084 | 2 | 2 | 0.03% | 0.03% | 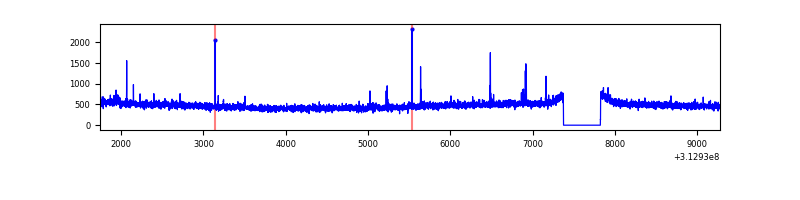 |
| C | 7532 | 7083 | 0 | 0 | 0.00% | 0.00% | 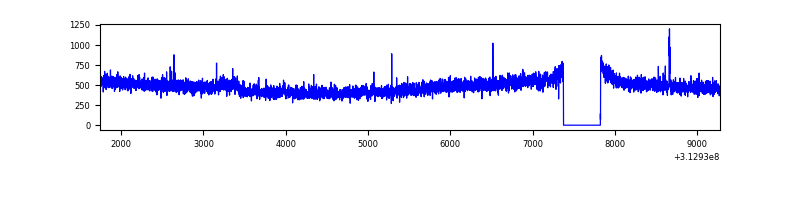 |
| D | 7532 | 7083 | 200 | 200 | 2.66% | 2.82% | 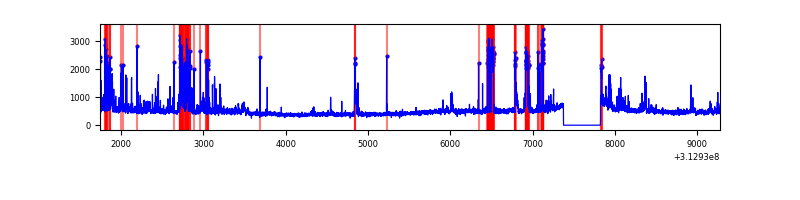 |
Top three noisy pixels from each quadrant. If the there are fewer than three noisy pixels in the level2.evt file, extra rows are filled as -1
| Pixel properties | Quadrant properties | ||||||
|---|---|---|---|---|---|---|---|
| Quadrant | DetID | PixID | Counts | Sigma | Mean | Median | Sigma |
| A | 13 | 254 | 11815 | 63.86 | 851 | 829 | 172.0 |
| A | 3 | 137 | 7410 | 38.25 | 851 | 829 | 172.0 |
| A | 0 | 226 | 7161 | 36.81 | 851 | 829 | 172.0 |
| B | 12 | 111 | 19769 | 116.74 | 850 | 827 | 162.3 |
| B | 11 | 111 | 17411 | 102.2 | 850 | 827 | 162.3 |
| B | 0 | 230 | 15605 | 91.07 | 850 | 827 | 162.3 |
| C | 14 | 238 | 132667 | 678.64 | 825 | 828 | 194.3 |
| C | 10 | 222 | 36228 | 182.22 | 825 | 828 | 194.3 |
| C | 10 | 22 | 8146 | 37.67 | 825 | 828 | 194.3 |
| D | 1 | 52 | 791729 | 3914.29 | 824 | 800 | 202.1 |
| D | 10 | 199 | 82208 | 402.89 | 824 | 800 | 202.1 |
| D | 12 | 227 | 63479 | 310.2 | 824 | 800 | 202.1 |
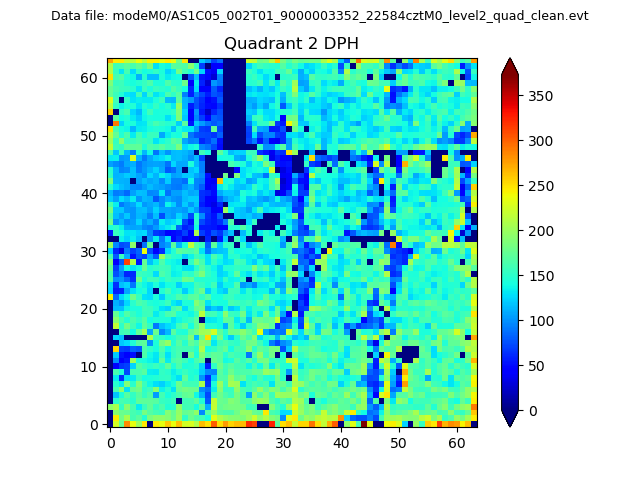
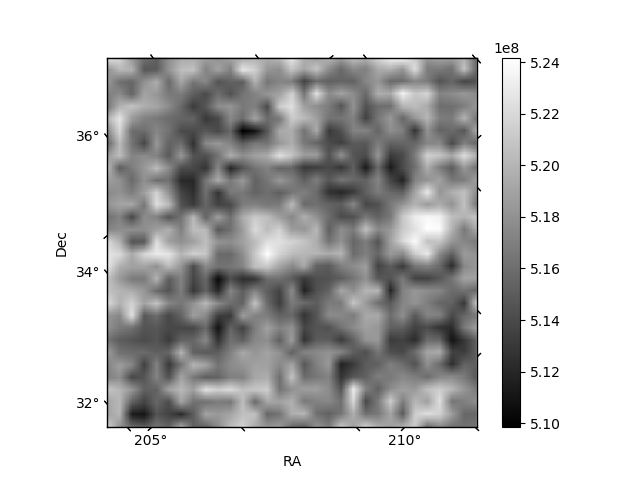
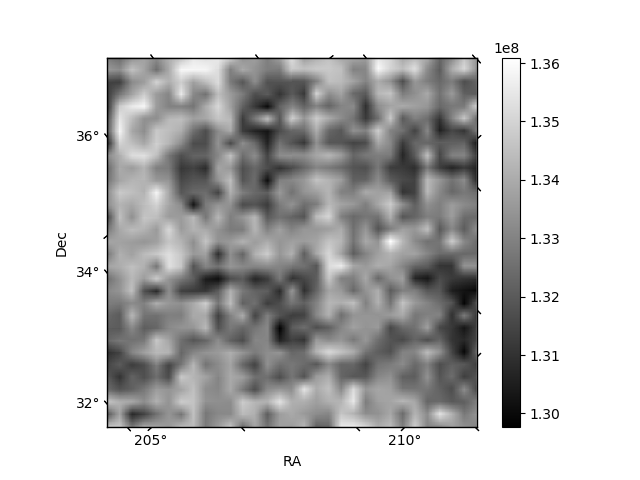
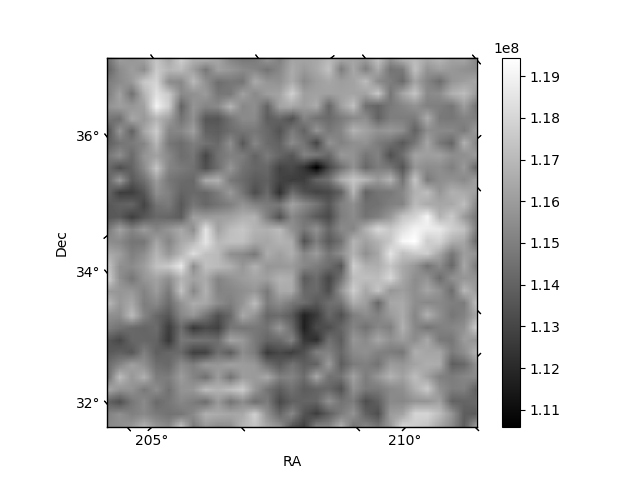
Histogram calculated using DETX and DETY for each event in the final _common_clean file
| Quadrant A | 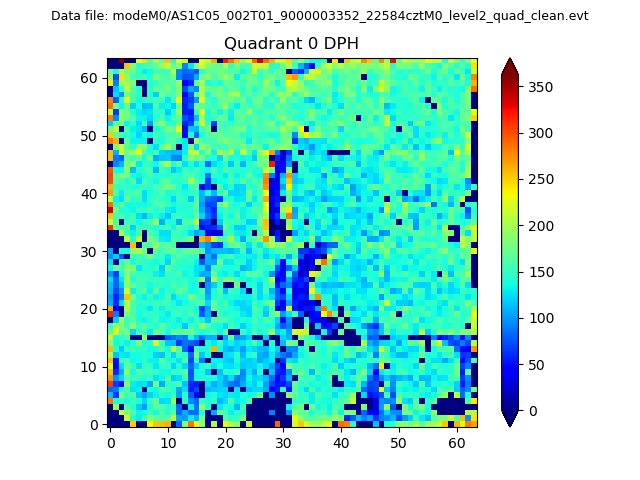 |
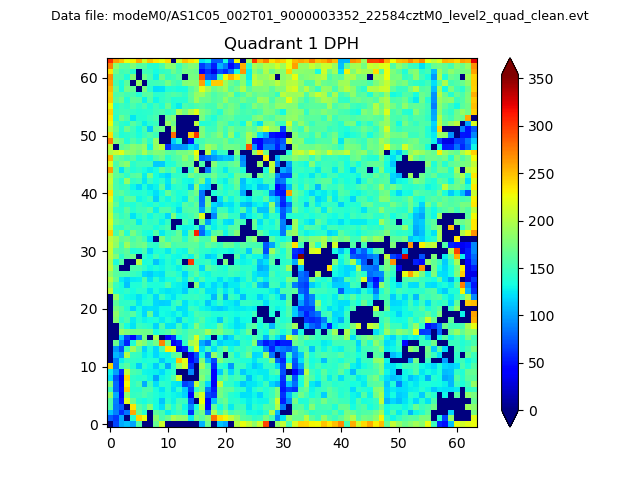 |
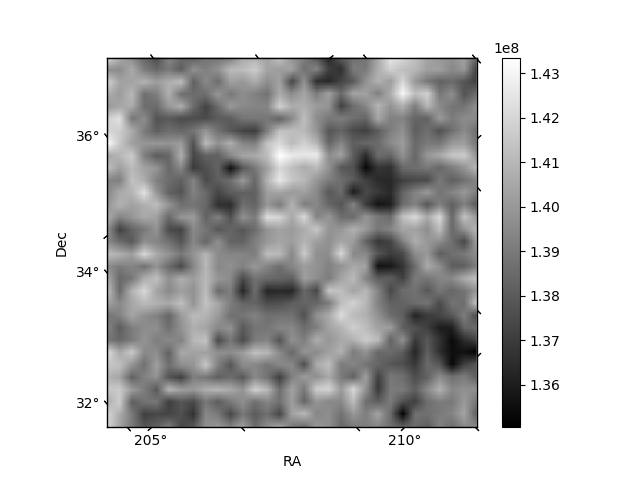
Quadrant B |
|---|---|---|---|
| Quadrant D | 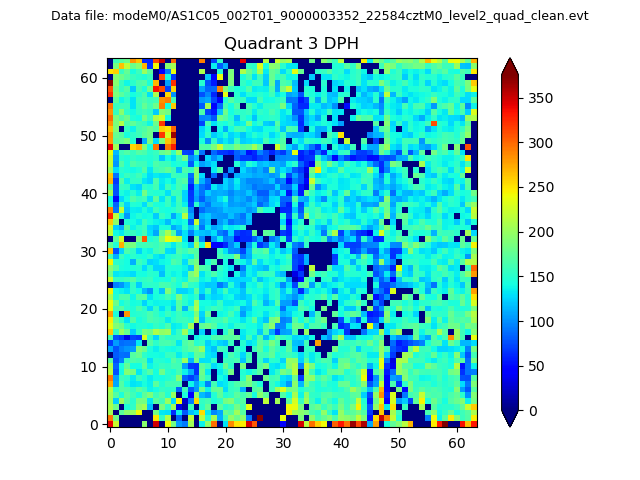 |
 |
Quadrant C |
| Plot type | Count rate plots | Images |
|---|---|---|
| Comparison with Poisson distribution Blue bars denote a histogram of data divided into 1 sec bins. Red curve is a Poisson curve with rate = median count rate of data. |
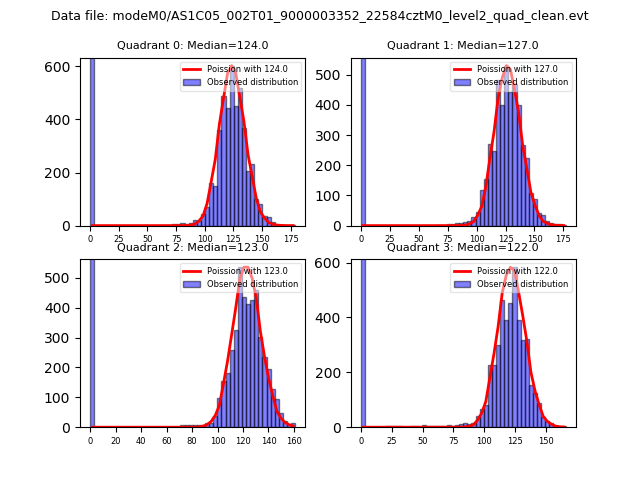 |
 |
| Quadrant-wise count rates Data is divided into 100 sec bins |
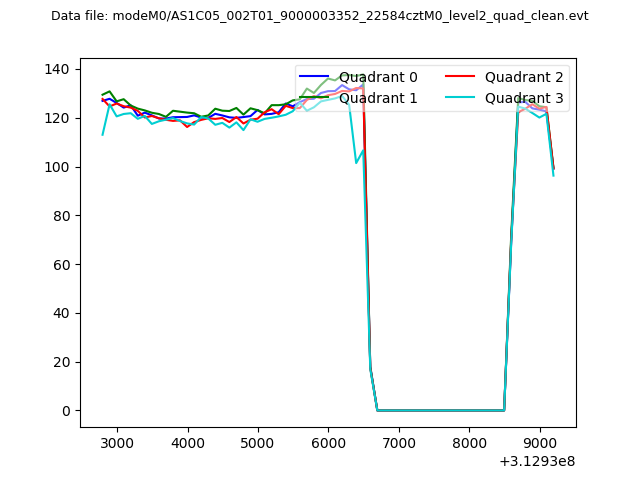 |
|
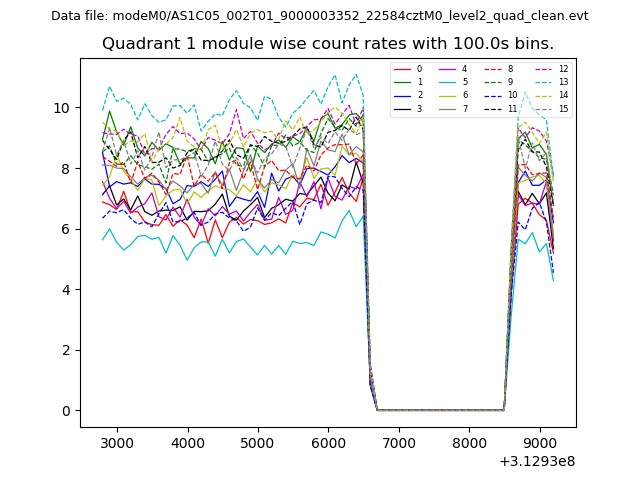
| Module-wise count rates for Quadrant A Data is divided into 100 sec bins |
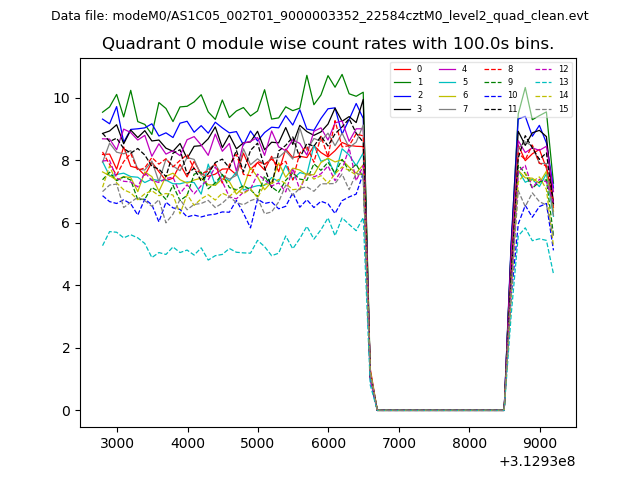 |
 |
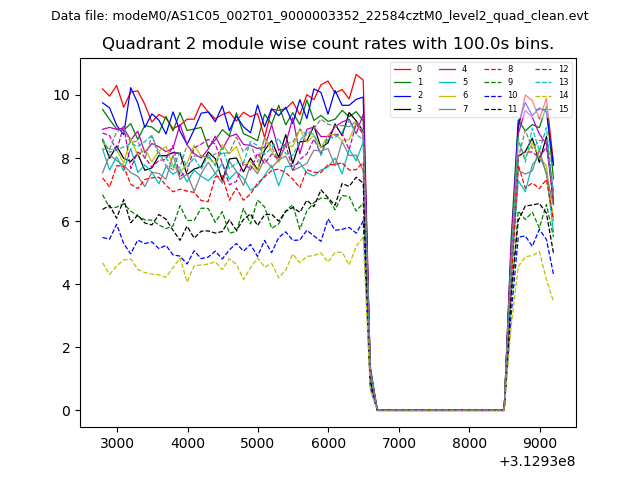
| Module-wise count rates for Quadrant B Data is divided into 100 sec bins |
 |
 |
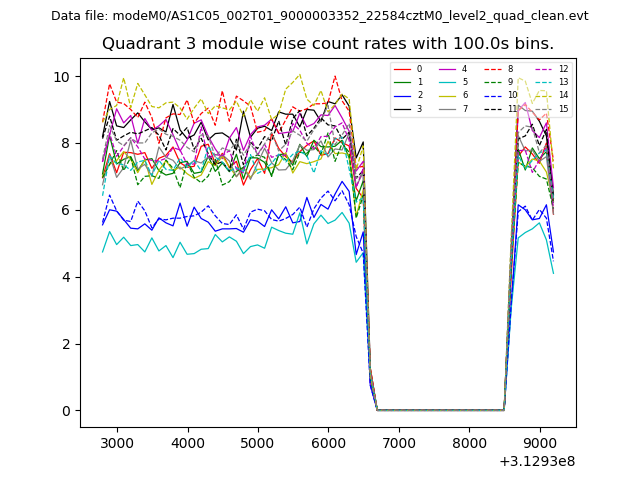
| Module-wise count rates for Quadrant C Data is divided into 100 sec bins |
 |
 |
| Module-wise count rates for Quadrant D Data is divided into 100 sec bins |
 |
 |
| Parameter | Plot |
|---|---|
| CZT HV Monitor | 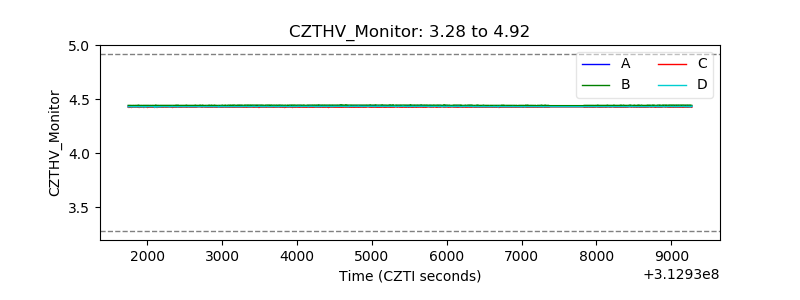 |
| D_VDD | 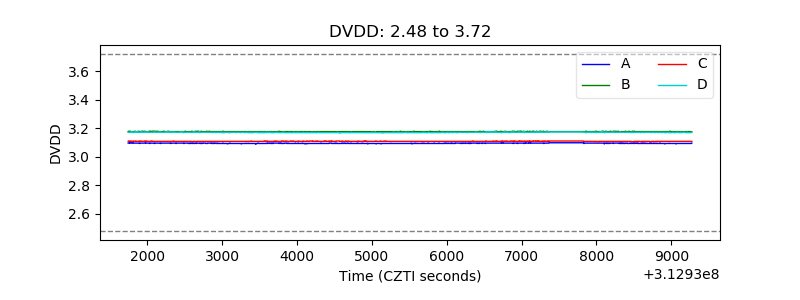 |
| Temperature 1 | 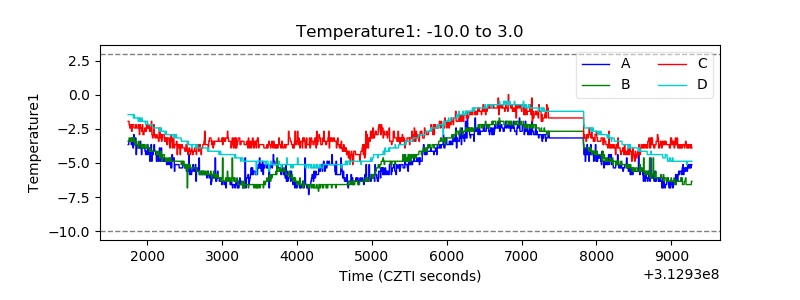 |
| Veto HV Monitor | 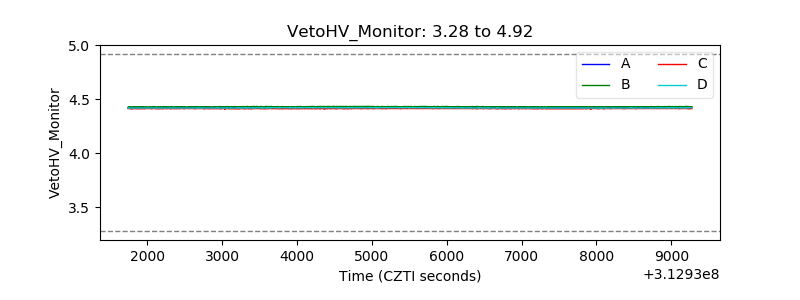 |
| Veto LLD | 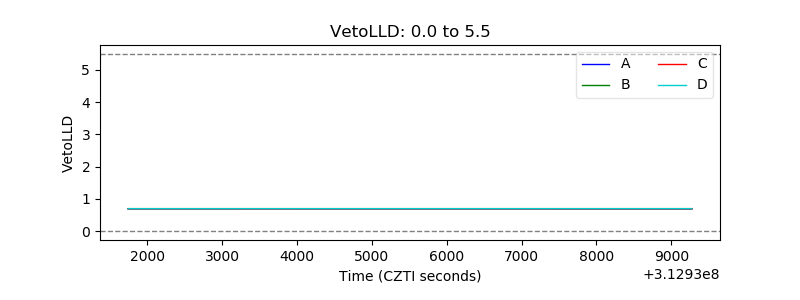 |
| Alpha Counter | 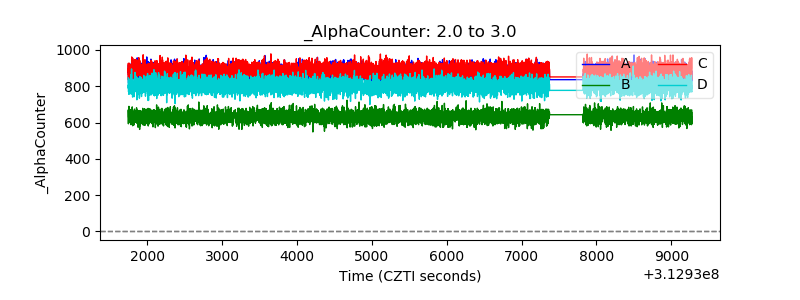 |
| _CPM_Rate | 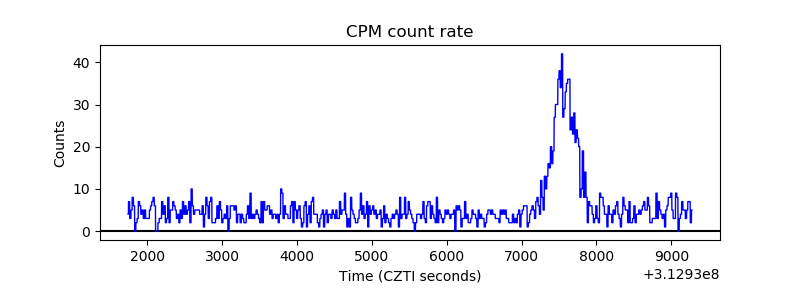 |
| CZT Counter | 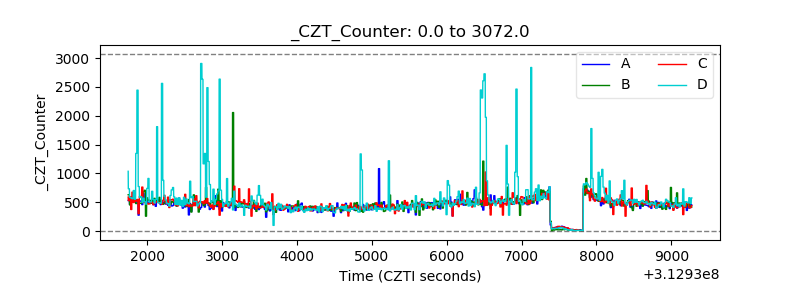 |
| +2.5 Volts monitor |  |
| +5 Volts monitor |  |
| _ROLL_ROT | 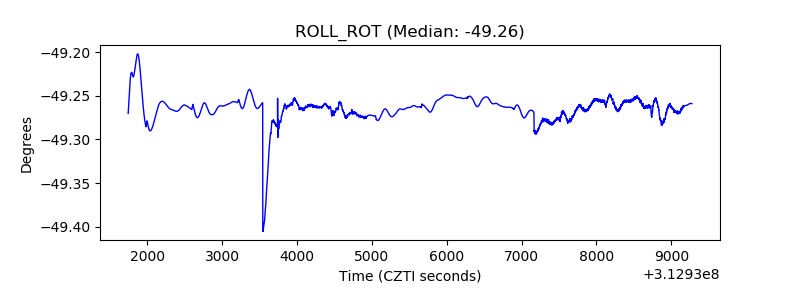 |
| _Roll_DEC | 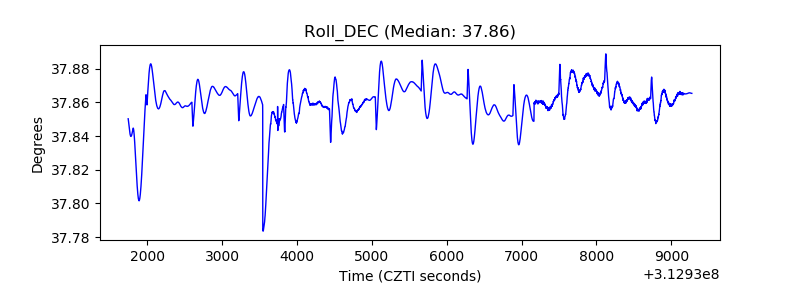 |
| _Roll_RA | 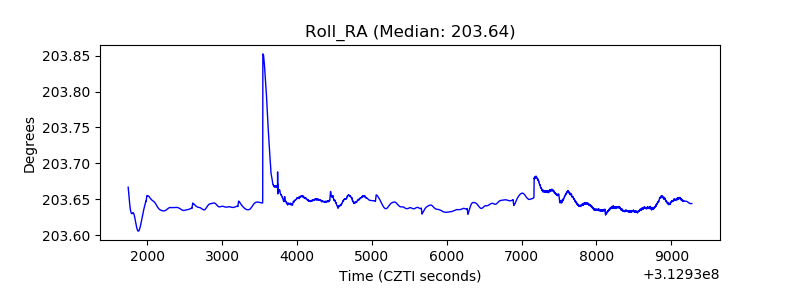 |
| Veto Counter | 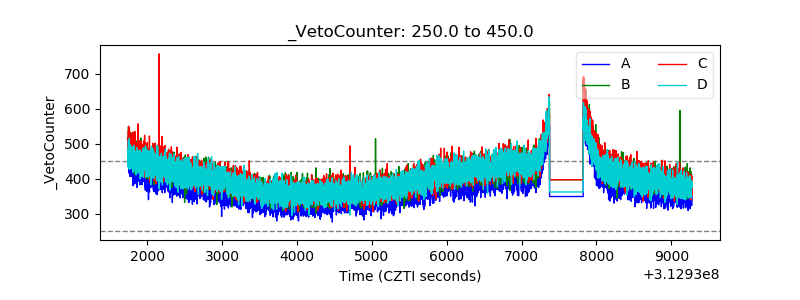 |