| Param | Original file | Final file |
|---|---|---|
| Filename | modeM0/AS1C05_002T01_9000003352_22585cztM0_level2.evt | modeM0/AS1C05_002T01_9000003352_22585cztM0_level2_quad_clean.evt |
| Size (bytes) | 537,600,960 | 97,606,080 |
| Size | 512.7 MB | 93.1 MB |
| Events in quadrant A | 3,509,679 | 612,666 |
| Events in quadrant B | 3,636,930 | 622,119 |
| Events in quadrant C | 3,639,800 | 603,804 |
| Events in quadrant D | 4,981,786 | 591,334 |
| Mode SS | |||
|---|---|---|---|
| Quadrant | BADHDUFLAG | Total packets | Discarded packets |
| A | 0 | 154 | 0 |
| B | 0 | 154 | 0 |
| C | 0 | 154 | 0 |
| D | 0 | 154 | 0 |
| Mode M9 | |||
|---|---|---|---|
| Quadrant | BADHDUFLAG | Total packets | Discarded packets |
| A | 0 | 3 | 0 |
| B | 0 | 3 | 0 |
| C | 0 | 3 | 0 |
| D | 0 | 3 | 0 |
| Mode M0 | |||
|---|---|---|---|
| Quadrant | BADHDUFLAG | Total packets | Discarded packets |
| A | 0 | 15557 | 2 |
| B | 0 | 15868 | 2 |
| C | 0 | 15772 | 2 |
| D | 0 | 20058 | 2 |
| Quadrant | Total seconds | Saturated seconds | Saturation percentage |
|---|---|---|---|
| A | 7557 | 26 | 0.344052% |
| B | 7557 | 63 | 0.833664% |
| C | 7558 | 91 | 1.204022% |
| D | 7558 | 197 | 2.606510% |
Noise dominated data is calculated using 1-second bins in cleaned event files. If a bin has >2000 counts, and if more than 50% of those come from <1% of pixels, then it is considered to be noise-dominated and hence unusable.
| Quadrant | # 1 sec bins | Bins with >0 counts | Bins with >2000 counts | High rate bins dominated by noise | Noise dominated (total time) | Noise dominated (detector-on time) | Marked lightcurve |
|---|---|---|---|---|---|---|---|
| A | 7857 | 7558 | 0 | 0 | 0.00% | 0.00% | 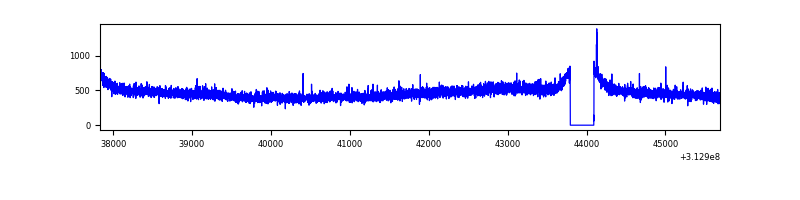 |
| B | 7857 | 7558 | 4 | 4 | 0.05% | 0.05% | 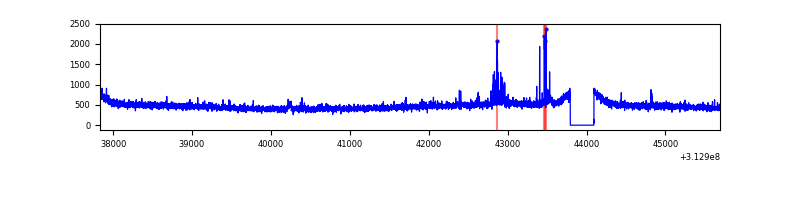 |
| C | 7858 | 7559 | 0 | 0 | 0.00% | 0.00% | 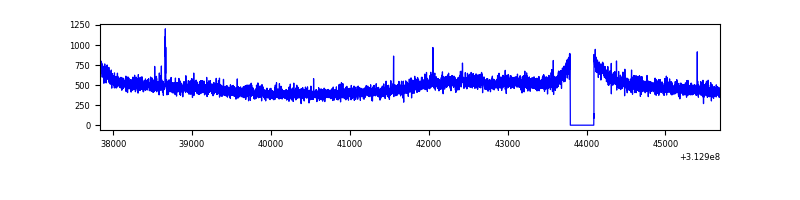 |
| D | 7858 | 7559 | 127 | 127 | 1.62% | 1.68% |  |
Top three noisy pixels from each quadrant. If the there are fewer than three noisy pixels in the level2.evt file, extra rows are filled as -1
| Pixel properties | Quadrant properties | ||||||
|---|---|---|---|---|---|---|---|
| Quadrant | DetID | PixID | Counts | Sigma | Mean | Median | Sigma |
| A | 13 | 254 | 11809 | 59.61 | 906 | 887 | 183.2 |
| A | 11 | 47 | 9440 | 46.68 | 906 | 887 | 183.2 |
| A | 3 | 137 | 8129 | 39.53 | 906 | 887 | 183.2 |
| B | 15 | 33 | 60693 | 345.96 | 905 | 882 | 172.9 |
| B | 12 | 111 | 21410 | 118.74 | 905 | 882 | 172.9 |
| B | 11 | 111 | 19138 | 105.6 | 905 | 882 | 172.9 |
| C | 14 | 238 | 137443 | 664.25 | 877 | 883 | 205.6 |
| C | 10 | 222 | 62922 | 301.77 | 877 | 883 | 205.6 |
| C | 10 | 22 | 13223 | 60.02 | 877 | 883 | 205.6 |
| D | 12 | 227 | 857962 | 3990.18 | 877 | 851 | 214.8 |
| D | 1 | 52 | 671286 | 3121.13 | 877 | 851 | 214.8 |
| D | 10 | 199 | 74508 | 342.9 | 877 | 851 | 214.8 |
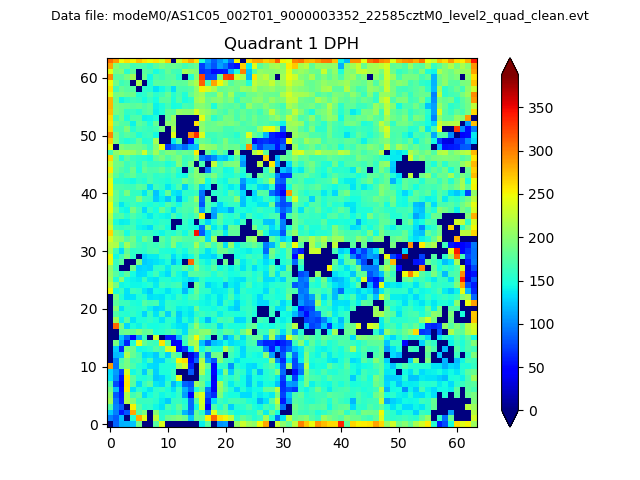
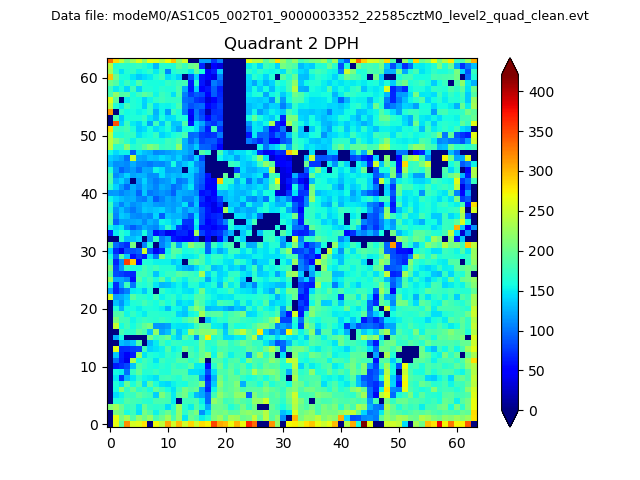
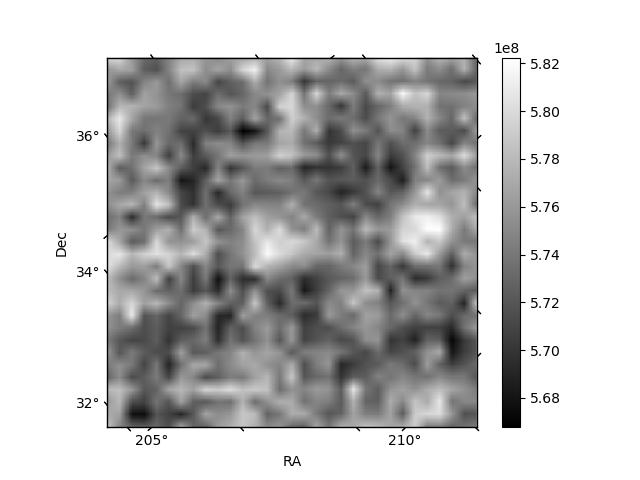
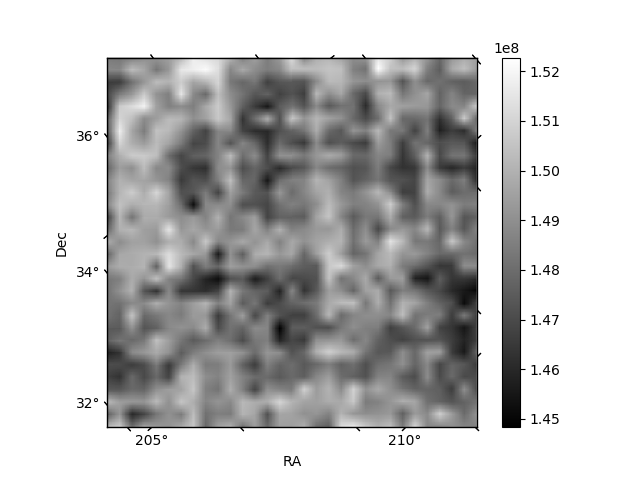
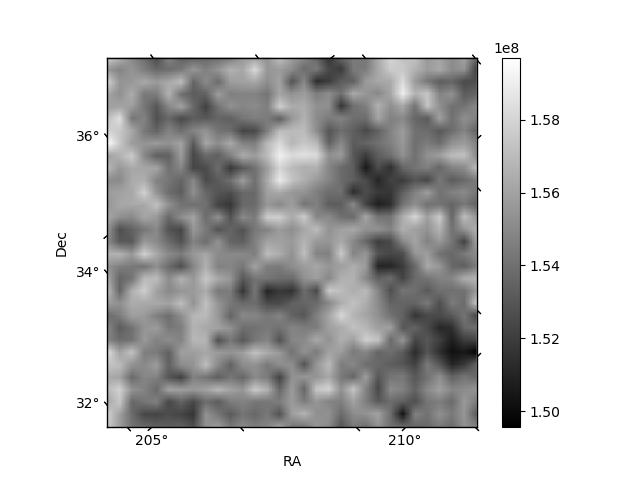
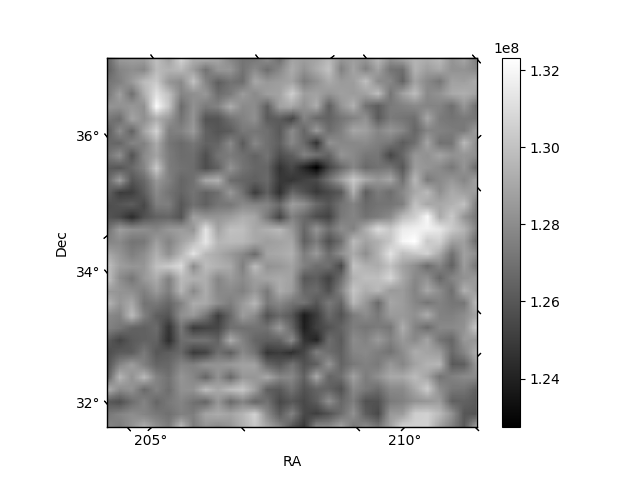
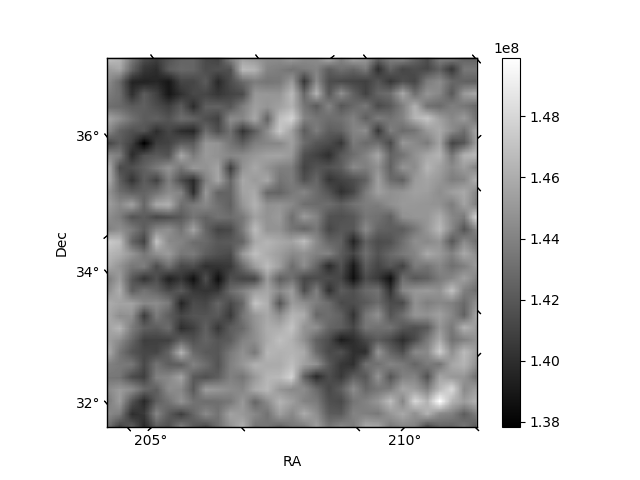
Histogram calculated using DETX and DETY for each event in the final _common_clean file
| Quadrant A | 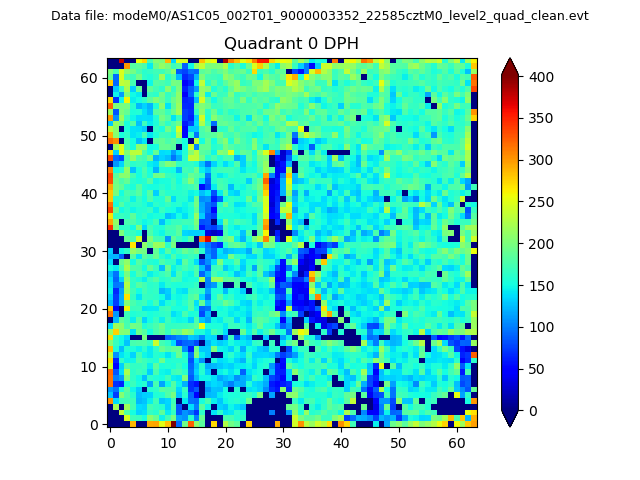 |
 |
Quadrant B |
|---|---|---|---|
| Quadrant D | 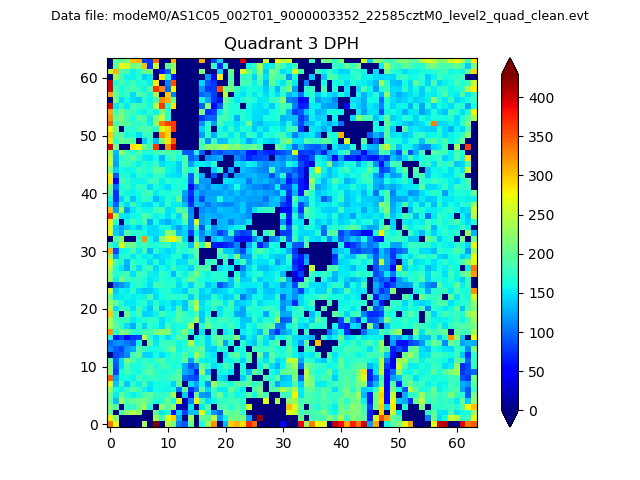 |
 |
Quadrant C |
| Plot type | Count rate plots | Images |
|---|---|---|
| Comparison with Poisson distribution Blue bars denote a histogram of data divided into 1 sec bins. Red curve is a Poisson curve with rate = median count rate of data. |
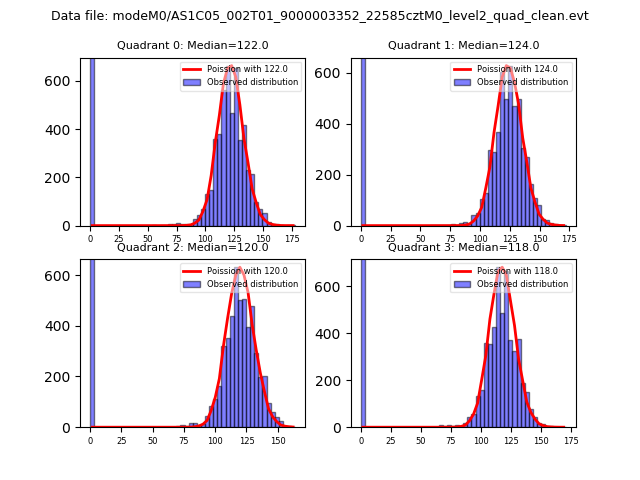 |
 |
| Quadrant-wise count rates Data is divided into 100 sec bins |
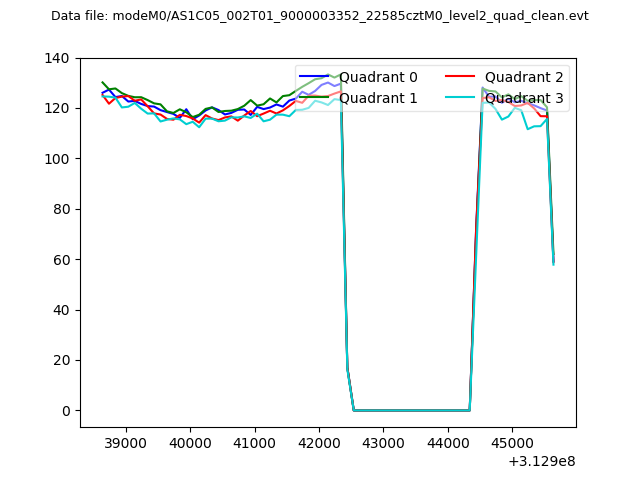 |
|
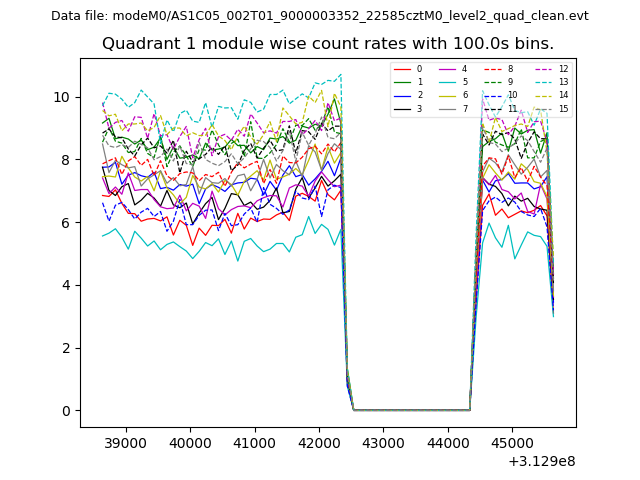
| Module-wise count rates for Quadrant A Data is divided into 100 sec bins |
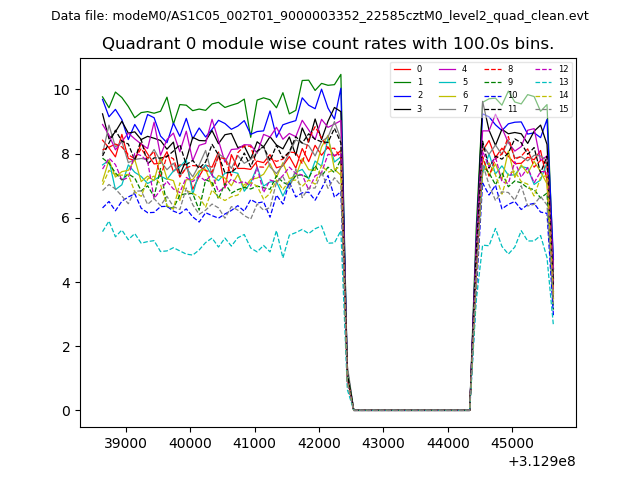 |
 |
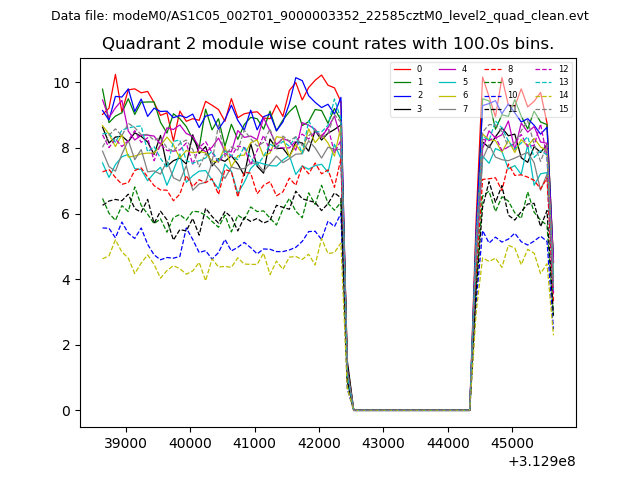
| Module-wise count rates for Quadrant B Data is divided into 100 sec bins |
 |
 |
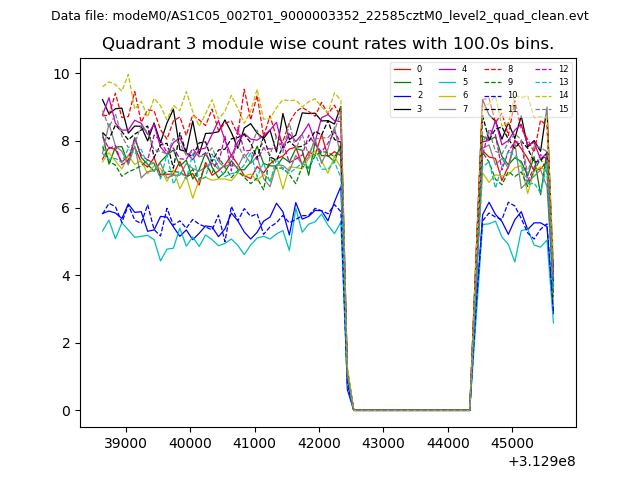
| Module-wise count rates for Quadrant C Data is divided into 100 sec bins |
 |
 |
| Module-wise count rates for Quadrant D Data is divided into 100 sec bins |
 |
 |
| Parameter | Plot |
|---|---|
| CZT HV Monitor | 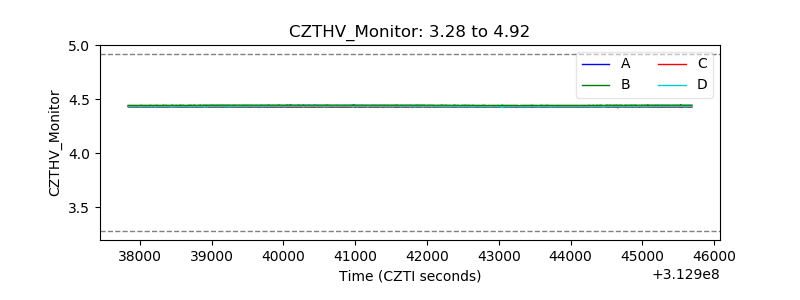 |
| D_VDD |  |
| Temperature 1 | 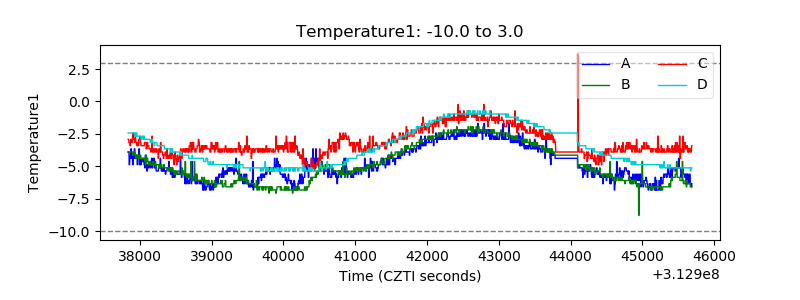 |
| Veto HV Monitor | 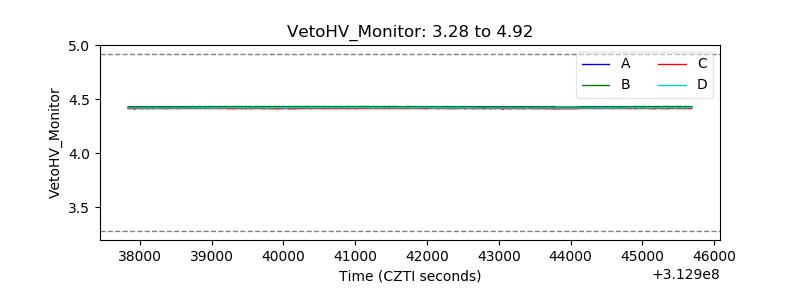 |
| Veto LLD | 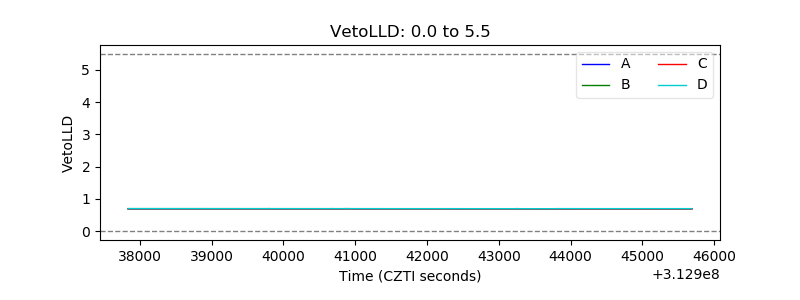 |
| Alpha Counter | 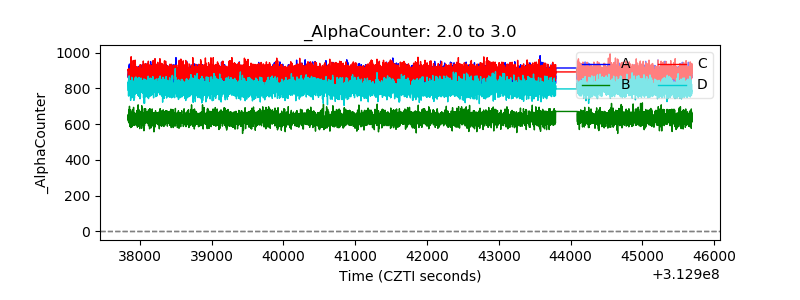 |
| _CPM_Rate | 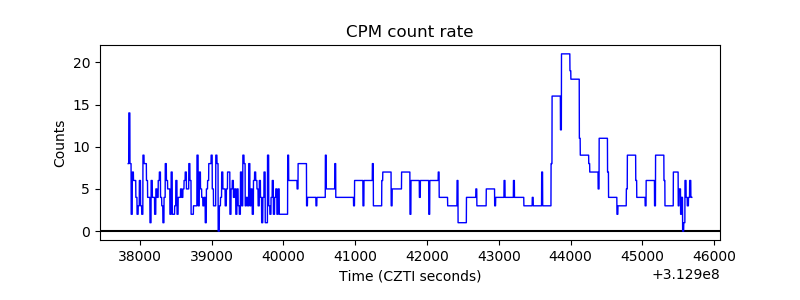 |
| CZT Counter | 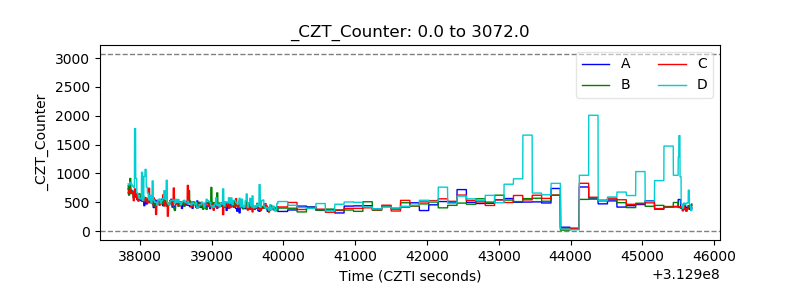 |
| +2.5 Volts monitor |  |
| +5 Volts monitor |  |
| _ROLL_ROT | 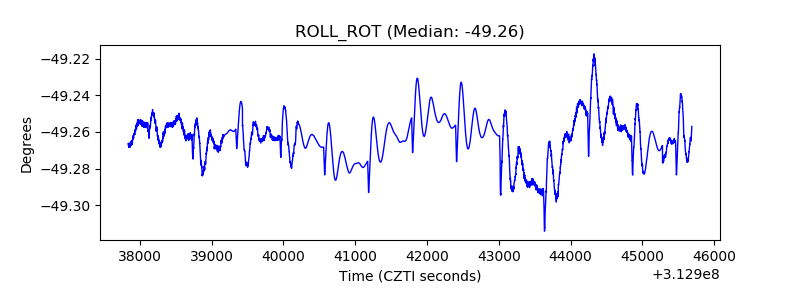 |
| _Roll_DEC | 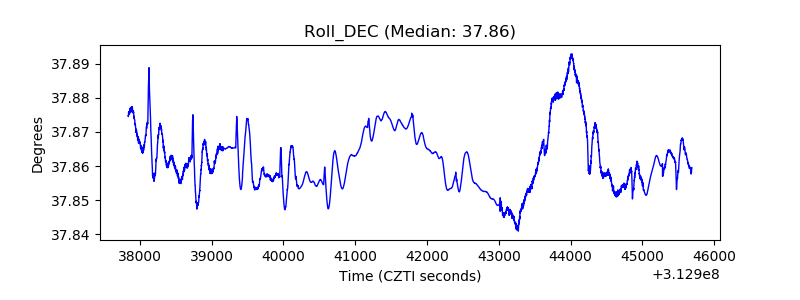 |
| _Roll_RA | 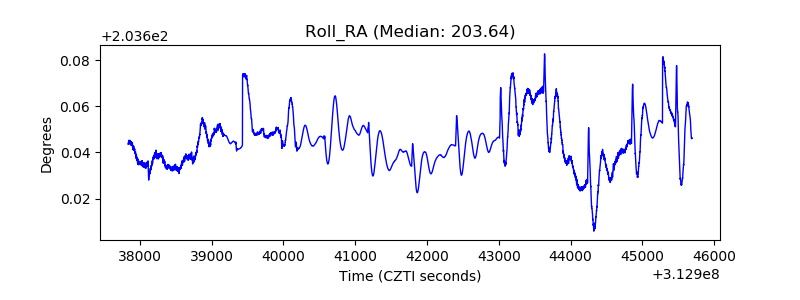 |
| Veto Counter | 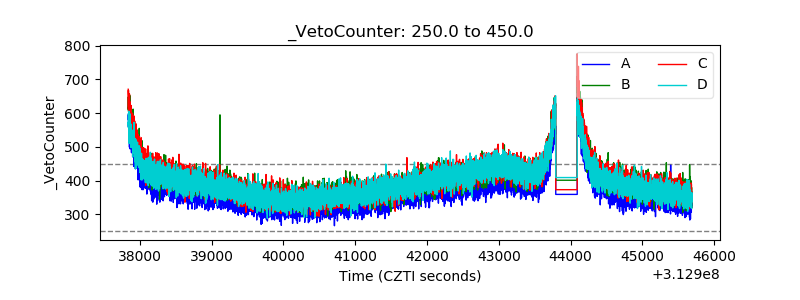 |