| Param | Original file | Final file |
|---|---|---|
| Filename | modeM0/AS1C05_002T01_9000003352_22586cztM0_level2.evt | modeM0/AS1C05_002T01_9000003352_22586cztM0_level2_quad_clean.evt |
| Size (bytes) | 251,850,240 | 65,306,880 |
| Size | 240.2 MB | 62.3 MB |
| Events in quadrant A | 1,526,050 | 435,432 |
| Events in quadrant B | 1,549,528 | 443,079 |
| Events in quadrant C | 1,558,183 | 427,997 |
| Events in quadrant D | 2,744,704 | 413,701 |
| Mode SS | |||
|---|---|---|---|
| Quadrant | BADHDUFLAG | Total packets | Discarded packets |
| A | 0 | 72 | 0 |
| B | 0 | 72 | 0 |
| C | 0 | 72 | 0 |
| D | 0 | 72 | 0 |
| Mode M0 | |||
|---|---|---|---|
| Quadrant | BADHDUFLAG | Total packets | Discarded packets |
| A | 0 | 7290 | 0 |
| B | 0 | 7310 | 0 |
| C | 0 | 7304 | 0 |
| D | 0 | 10745 | 0 |
| Quadrant | Total seconds | Saturated seconds | Saturation percentage |
|---|---|---|---|
| A | 3638 | 4 | 0.109951% |
| B | 3639 | 5 | 0.137400% |
| C | 3639 | 4 | 0.109920% |
| D | 3639 | 64 | 1.758725% |
Noise dominated data is calculated using 1-second bins in cleaned event files. If a bin has >2000 counts, and if more than 50% of those come from <1% of pixels, then it is considered to be noise-dominated and hence unusable.
| Quadrant | # 1 sec bins | Bins with >0 counts | Bins with >2000 counts | High rate bins dominated by noise | Noise dominated (total time) | Noise dominated (detector-on time) | Marked lightcurve |
|---|---|---|---|---|---|---|---|
| A | 3638 | 3638 | 0 | 0 | 0.00% | 0.00% | 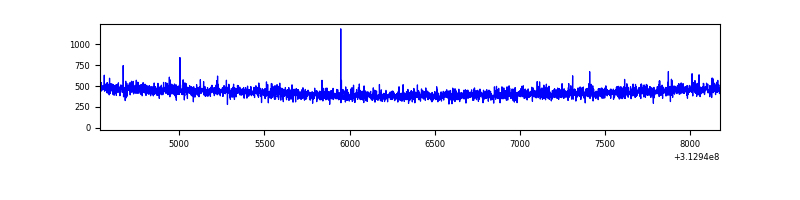 |
| B | 3639 | 3639 | 2 | 2 | 0.05% | 0.05% | 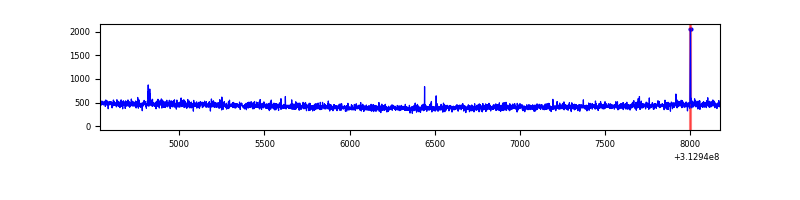 |
| C | 3639 | 3639 | 0 | 0 | 0.00% | 0.00% | 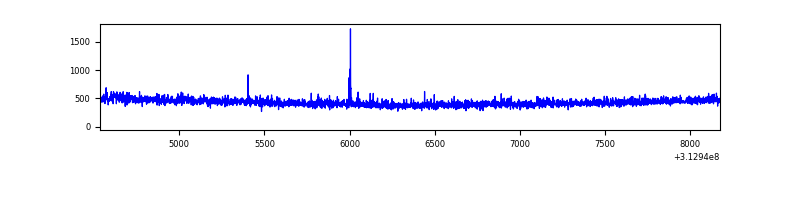 |
| D | 3639 | 3639 | 82 | 82 | 2.25% | 2.25% | 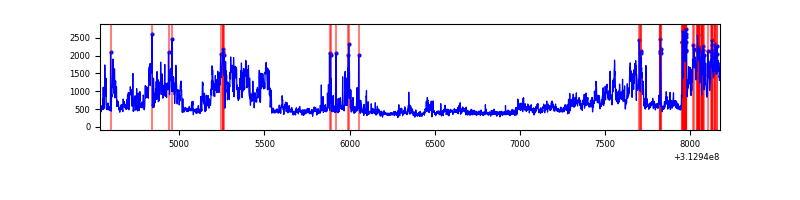 |
Top three noisy pixels from each quadrant. If the there are fewer than three noisy pixels in the level2.evt file, extra rows are filled as -1
| Pixel properties | Quadrant properties | ||||||
|---|---|---|---|---|---|---|---|
| Quadrant | DetID | PixID | Counts | Sigma | Mean | Median | Sigma |
| A | 13 | 254 | 5689 | 65.67 | 394 | 386 | 80.7 |
| A | 11 | 47 | 4201 | 47.24 | 394 | 386 | 80.7 |
| A | 3 | 137 | 3470 | 38.19 | 394 | 386 | 80.7 |
| B | 5 | 172 | 10872 | 137.12 | 393 | 383 | 76.5 |
| B | 12 | 111 | 9302 | 116.6 | 393 | 383 | 76.5 |
| B | 11 | 111 | 8322 | 103.79 | 393 | 383 | 76.5 |
| C | 14 | 238 | 60201 | 673.08 | 377 | 381 | 88.9 |
| C | 8 | 128 | 7595 | 81.17 | 377 | 381 | 88.9 |
| C | 2 | 16 | 5062 | 52.67 | 377 | 381 | 88.9 |
| D | 12 | 227 | 1060204 | 11514.24 | 377 | 367 | 92.0 |
| D | 1 | 52 | 251148 | 2724.52 | 377 | 367 | 92.0 |
| D | 2 | 234 | 16002 | 169.86 | 377 | 367 | 92.0 |
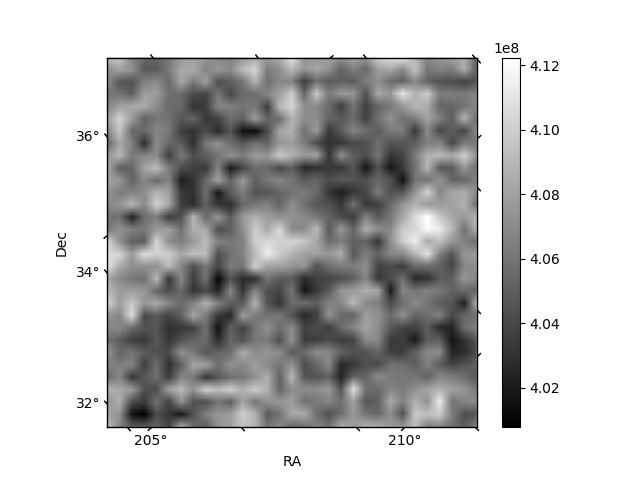
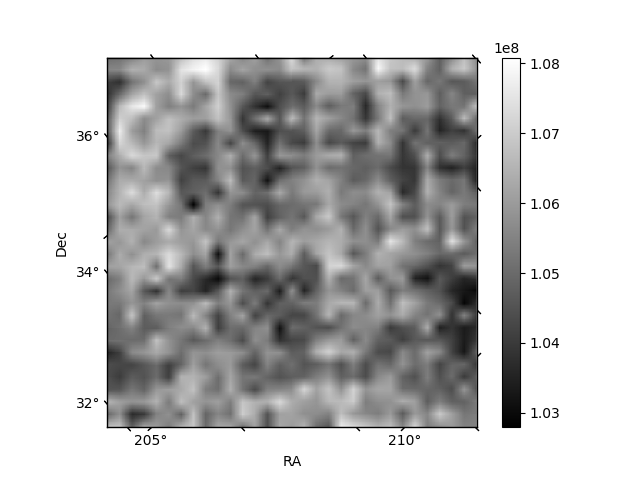
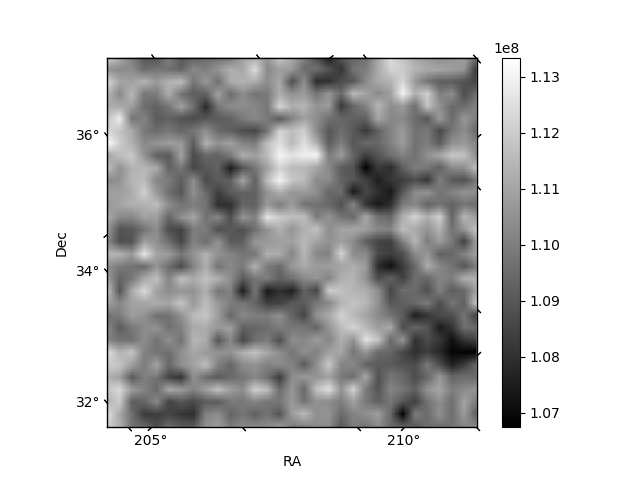
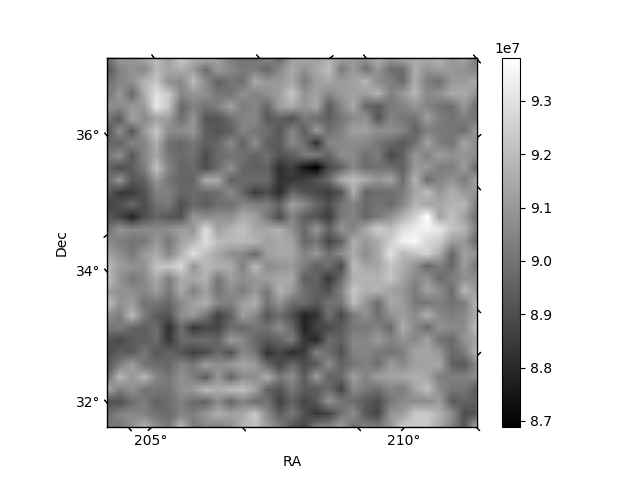
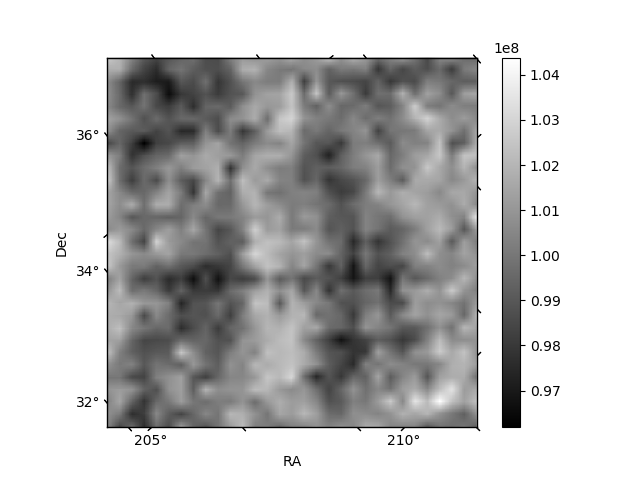
Histogram calculated using DETX and DETY for each event in the final _common_clean file
| Quadrant A | 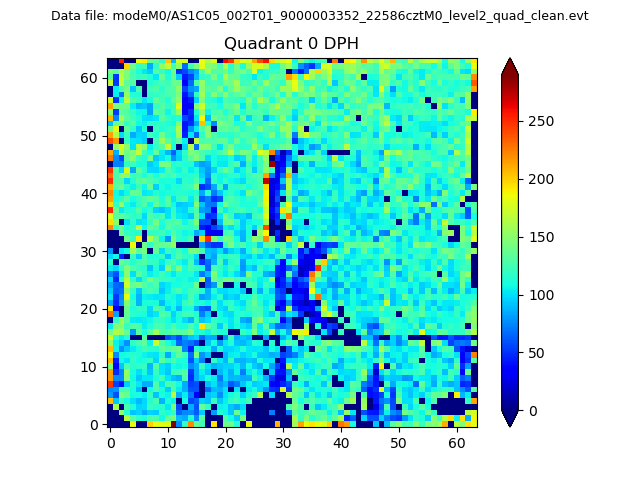 |
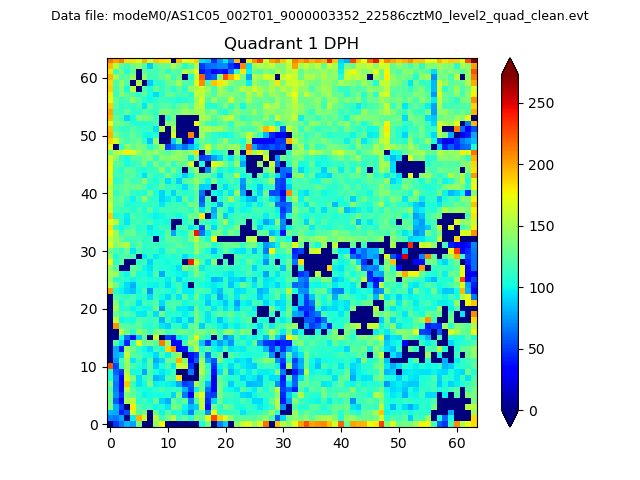 |
Quadrant B |
|---|---|---|---|
| Quadrant D | 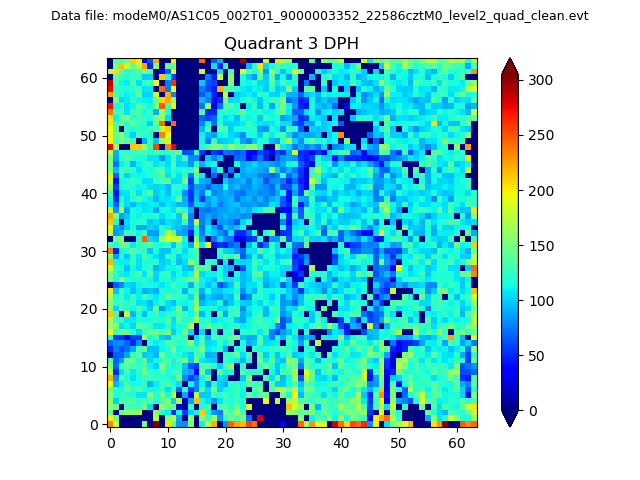 |
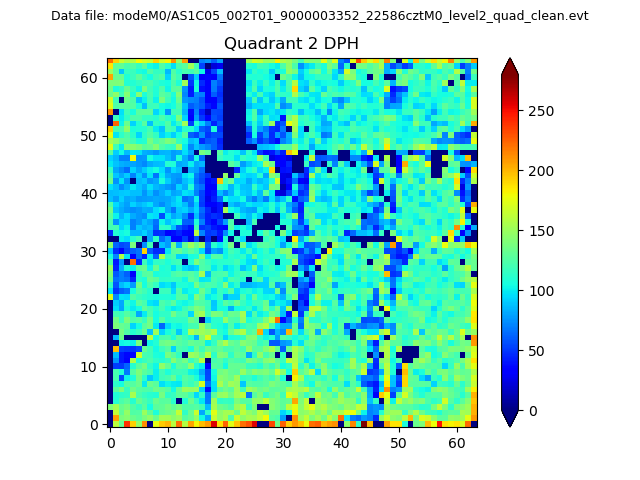 |
Quadrant C |
| Plot type | Count rate plots | Images |
|---|---|---|
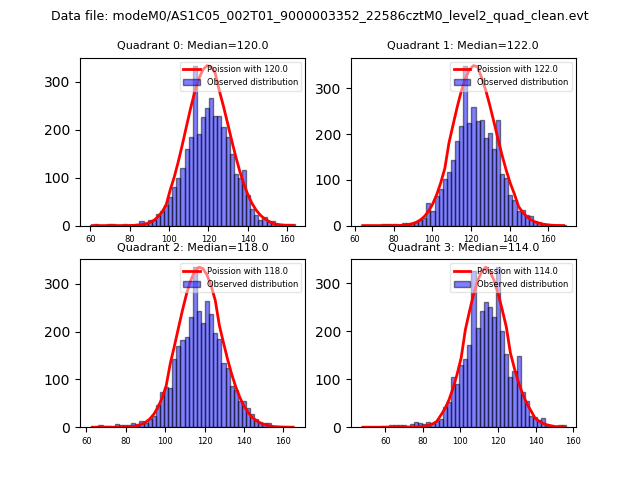
| Comparison with Poisson distribution Blue bars denote a histogram of data divided into 1 sec bins. Red curve is a Poisson curve with rate = median count rate of data. |
 |
 |
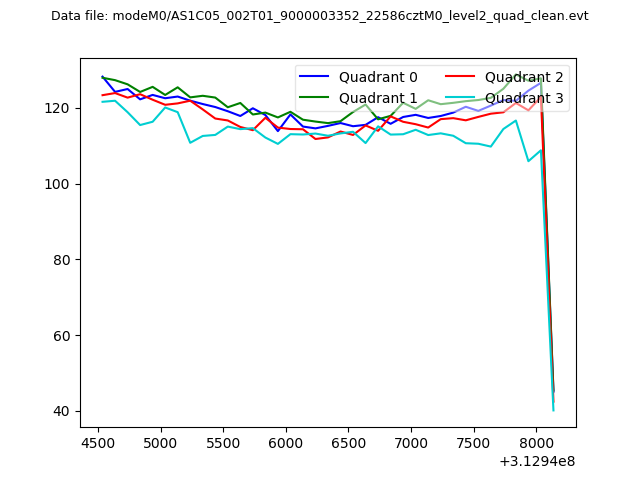
| Quadrant-wise count rates Data is divided into 100 sec bins |
 |
|
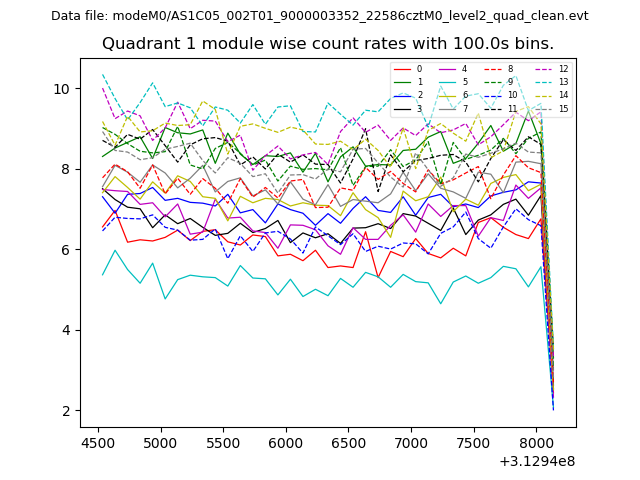
| Module-wise count rates for Quadrant A Data is divided into 100 sec bins |
 |
 |
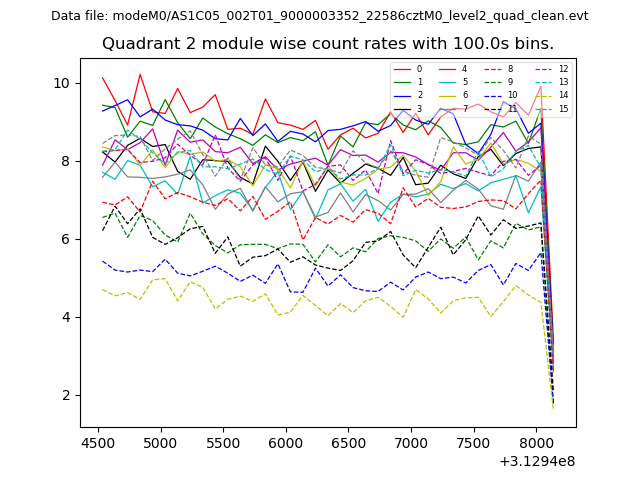
| Module-wise count rates for Quadrant B Data is divided into 100 sec bins |
 |
 |
| Module-wise count rates for Quadrant C Data is divided into 100 sec bins |
 |
 |
| Module-wise count rates for Quadrant D Data is divided into 100 sec bins |
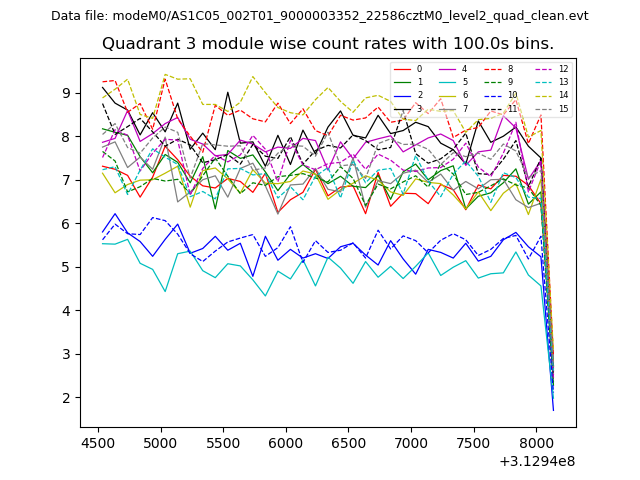 |
 |
| Parameter | Plot |
|---|---|
| CZT HV Monitor | 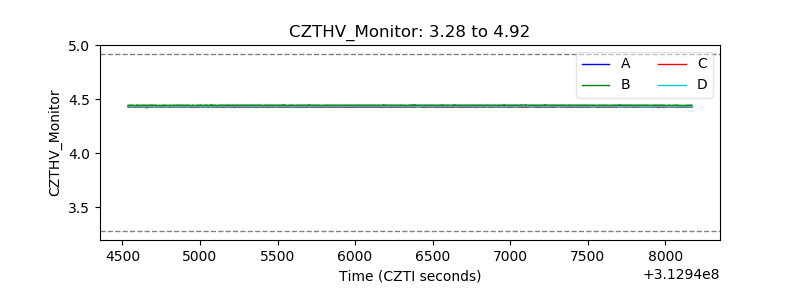 |
| D_VDD |  |
| Temperature 1 | 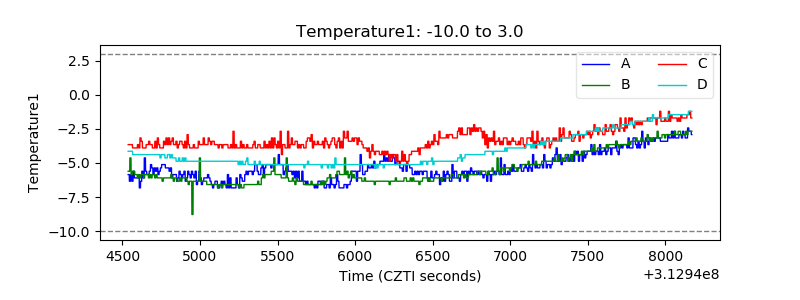 |
| Veto HV Monitor | 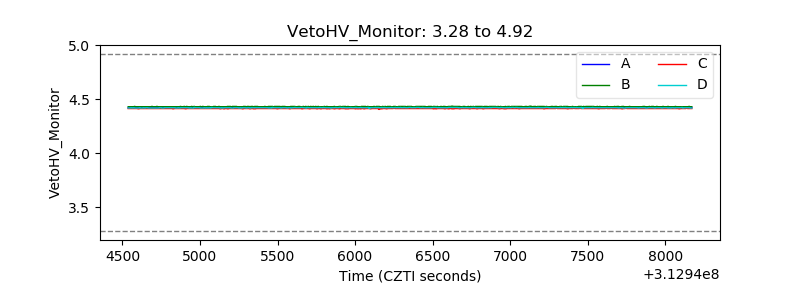 |
| Veto LLD | 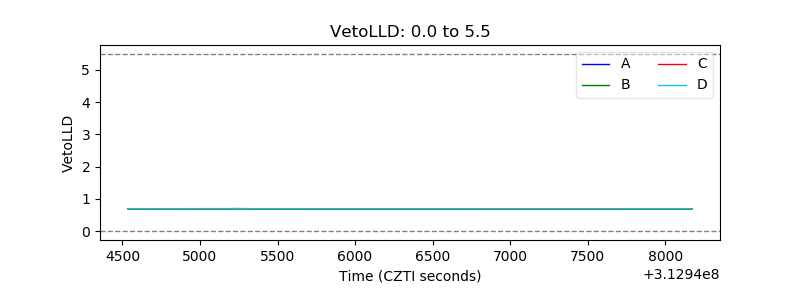 |
| Alpha Counter | 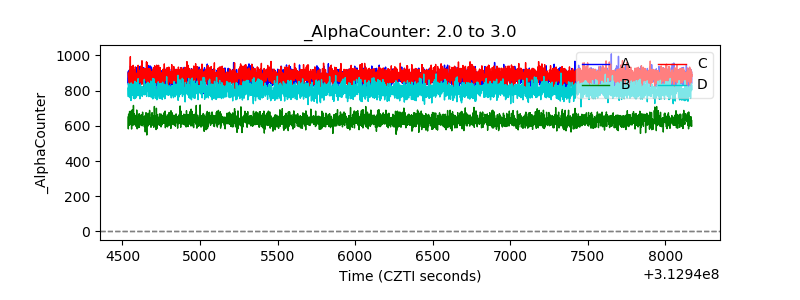 |
| _CPM_Rate | 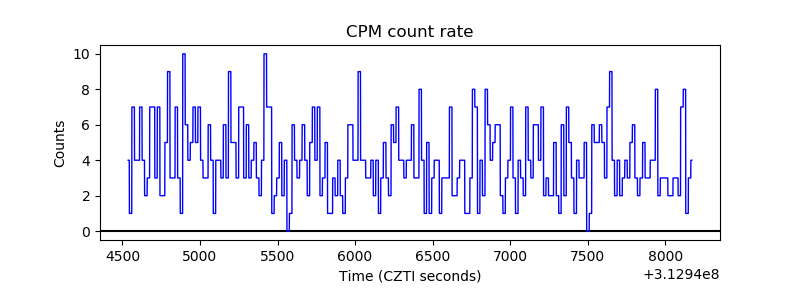 |
| CZT Counter | 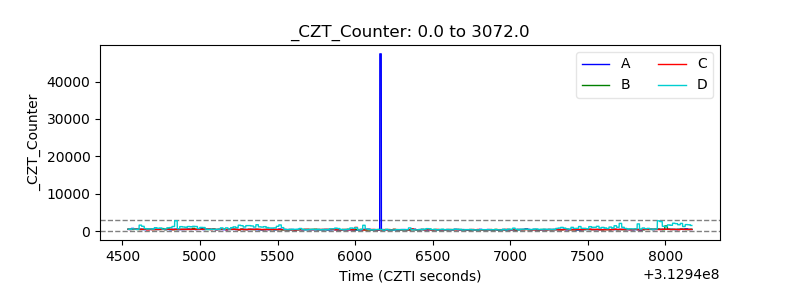 |
| +2.5 Volts monitor |  |
| +5 Volts monitor |  |
| _ROLL_ROT | 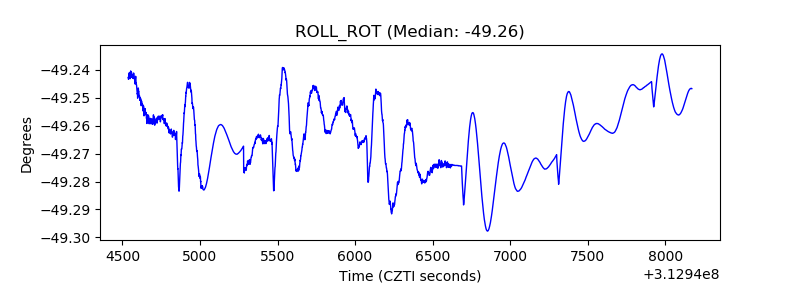 |
| _Roll_DEC | 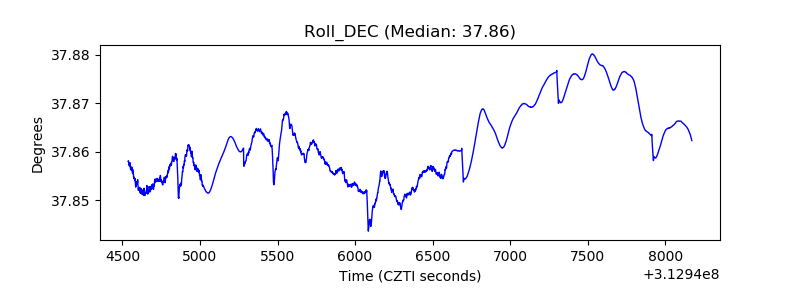 |
| _Roll_RA | 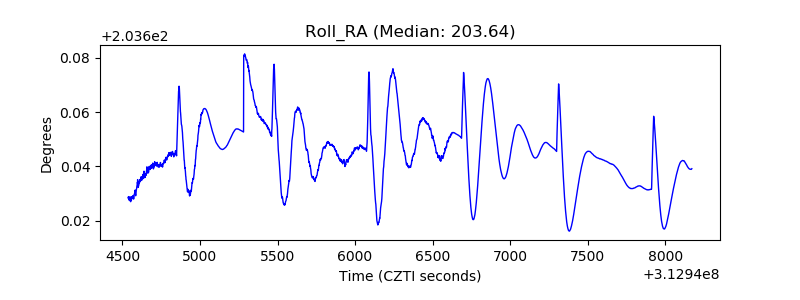 |
| Veto Counter | 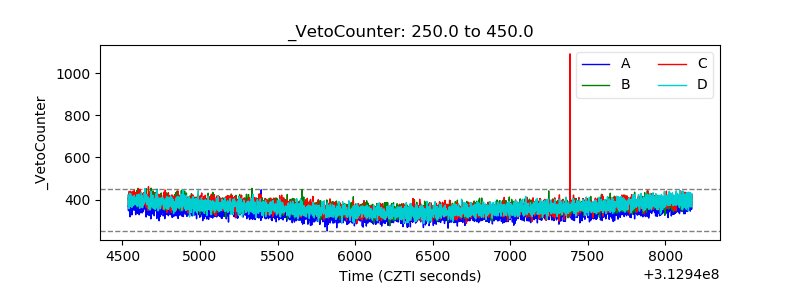 |