| Param | Original file | Final file |
|---|---|---|
| Filename | modeM0/AS1C05_013T01_9000003350_22582cztM0_level2.evt | modeM0/AS1C05_013T01_9000003350_22582cztM0_level2_quad_clean.evt |
| Size (bytes) | 263,399,040 | 78,626,880 |
| Size | 251.2 MB | 75.0 MB |
| Events in quadrant A | 1,825,519 | 529,665 |
| Events in quadrant B | 2,017,967 | 538,399 |
| Events in quadrant C | 1,906,750 | 525,317 |
| Events in quadrant D | 1,962,594 | 514,974 |
| Mode M0 | |||
|---|---|---|---|
| Quadrant | BADHDUFLAG | Total packets | Discarded packets |
| A | 0 | 7965 | 1 |
| B | 0 | 8527 | 1 |
| C | 0 | 8103 | 1 |
| D | 0 | 8624 | 1 |
| Mode M9 | |||
|---|---|---|---|
| Quadrant | BADHDUFLAG | Total packets | Discarded packets |
| A | 0 | 11 | 0 |
| B | 0 | 11 | 0 |
| C | 0 | 11 | 0 |
| D | 0 | 11 | 0 |
| Mode SS | |||
|---|---|---|---|
| Quadrant | BADHDUFLAG | Total packets | Discarded packets |
| A | 0 | 80 | 0 |
| B | 0 | 80 | 0 |
| C | 0 | 80 | 0 |
| D | 0 | 80 | 0 |
| Quadrant | Total seconds | Saturated seconds | Saturation percentage |
|---|---|---|---|
| A | 3859 | 32 | 0.829230% |
| B | 3859 | 86 | 2.228557% |
| C | 3859 | 90 | 2.332210% |
| D | 3859 | 39 | 1.010625% |
Noise dominated data is calculated using 1-second bins in cleaned event files. If a bin has >2000 counts, and if more than 50% of those come from <1% of pixels, then it is considered to be noise-dominated and hence unusable.
| Quadrant | # 1 sec bins | Bins with >0 counts | Bins with >2000 counts | High rate bins dominated by noise | Noise dominated (total time) | Noise dominated (detector-on time) | Marked lightcurve |
|---|---|---|---|---|---|---|---|
| A | 4989 | 3860 | 0 | 0 | 0.00% | 0.00% | 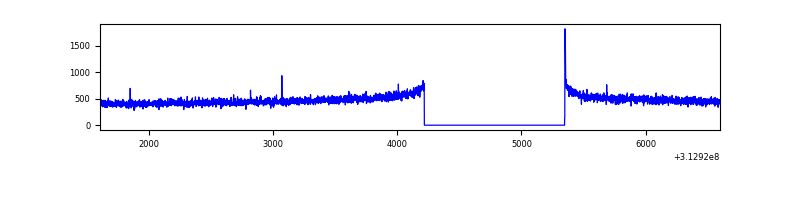 |
| B | 4989 | 3860 | 7 | 7 | 0.14% | 0.18% | 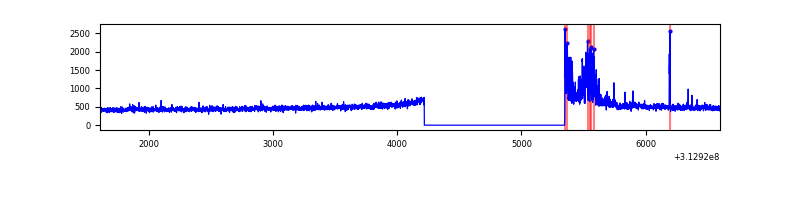 |
| C | 4989 | 3860 | 0 | 0 | 0.00% | 0.00% | 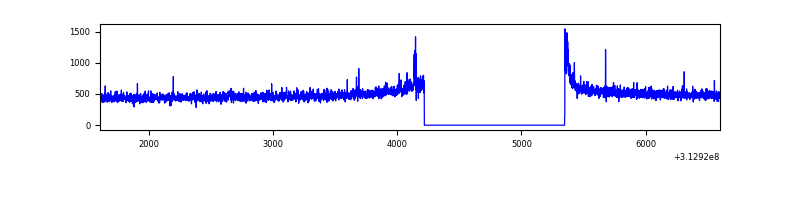 |
| D | 4989 | 3860 | 6 | 6 | 0.12% | 0.16% | 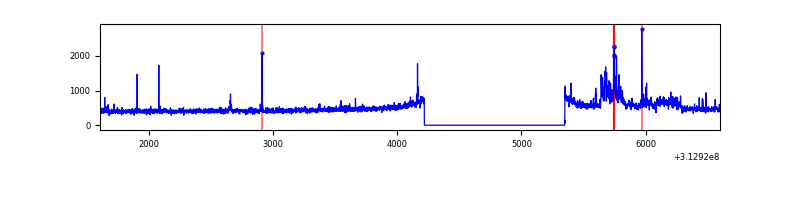 |
Top three noisy pixels from each quadrant. If the there are fewer than three noisy pixels in the level2.evt file, extra rows are filled as -1
| Pixel properties | Quadrant properties | ||||||
|---|---|---|---|---|---|---|---|
| Quadrant | DetID | PixID | Counts | Sigma | Mean | Median | Sigma |
| A | 13 | 34 | 8397 | 83.36 | 470 | 461 | 95.2 |
| A | 13 | 254 | 6360 | 61.96 | 470 | 461 | 95.2 |
| A | 3 | 137 | 3952 | 36.67 | 470 | 461 | 95.2 |
| B | 15 | 33 | 133107 | 1509.0 | 470 | 459 | 87.9 |
| B | 0 | 228 | 14668 | 161.64 | 470 | 459 | 87.9 |
| B | 0 | 190 | 12070 | 132.09 | 470 | 459 | 87.9 |
| C | 14 | 238 | 74663 | 694.21 | 458 | 460 | 106.9 |
| C | 0 | 10 | 13930 | 126.02 | 458 | 460 | 106.9 |
| C | 9 | 54 | 11027 | 98.86 | 458 | 460 | 106.9 |
| D | 12 | 227 | 133738 | 1186.67 | 462 | 450 | 112.3 |
| D | 1 | 52 | 46939 | 413.89 | 462 | 450 | 112.3 |
| D | 2 | 234 | 16920 | 146.63 | 462 | 450 | 112.3 |
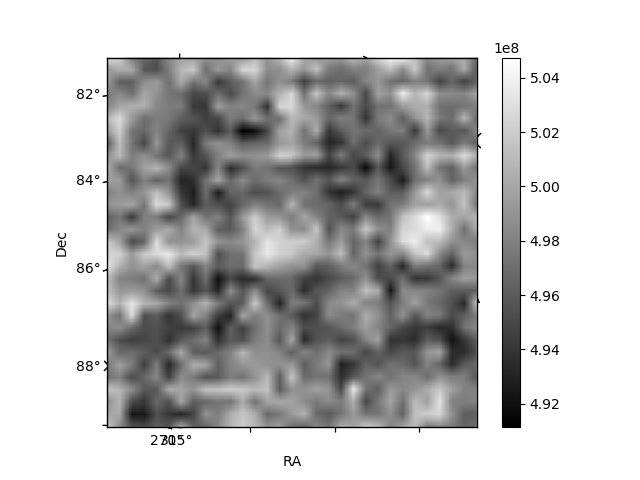
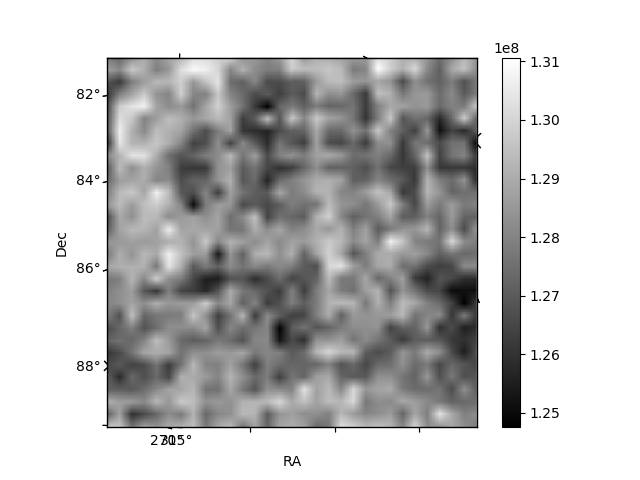
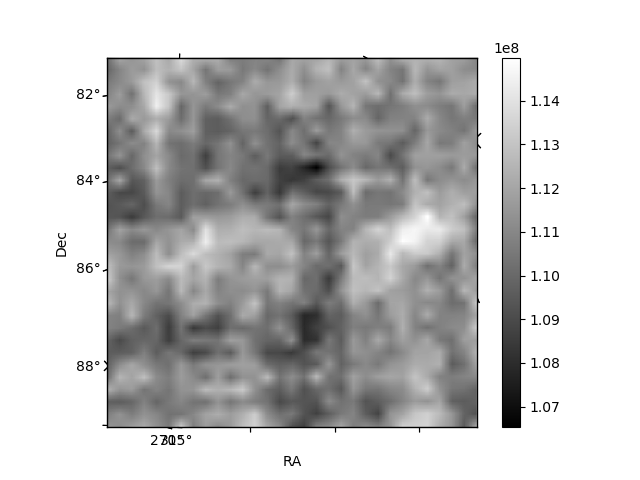
Histogram calculated using DETX and DETY for each event in the final _common_clean file
| Quadrant A | 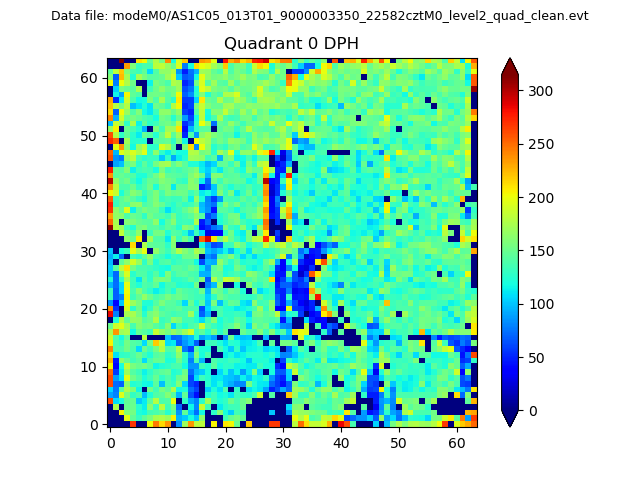 |
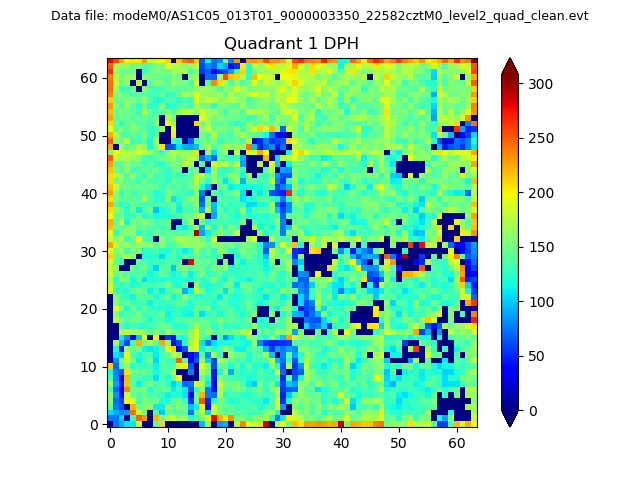 |
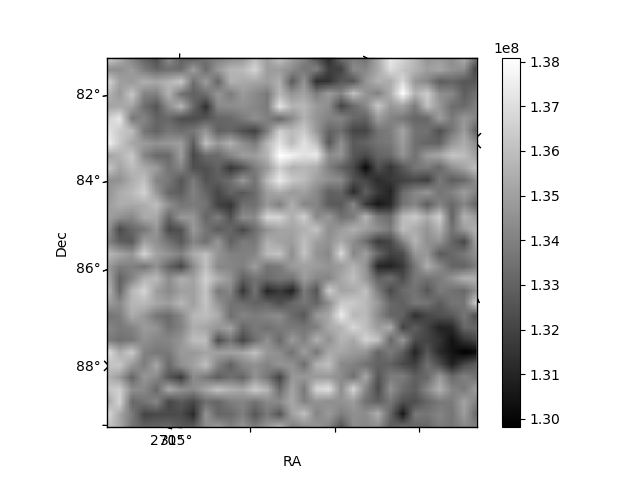
Quadrant B |
|---|---|---|---|
| Quadrant D | 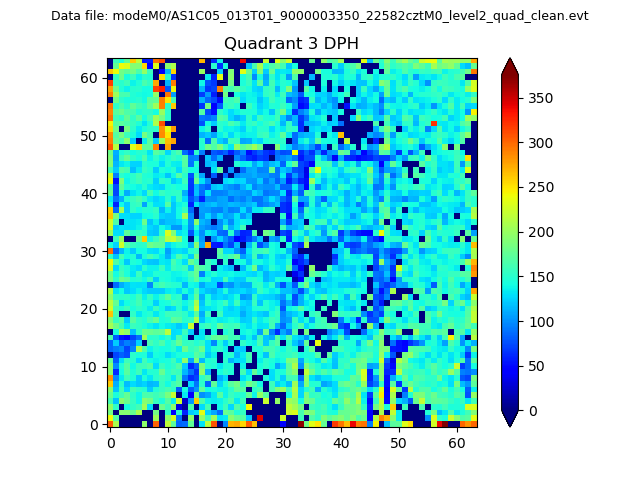 |
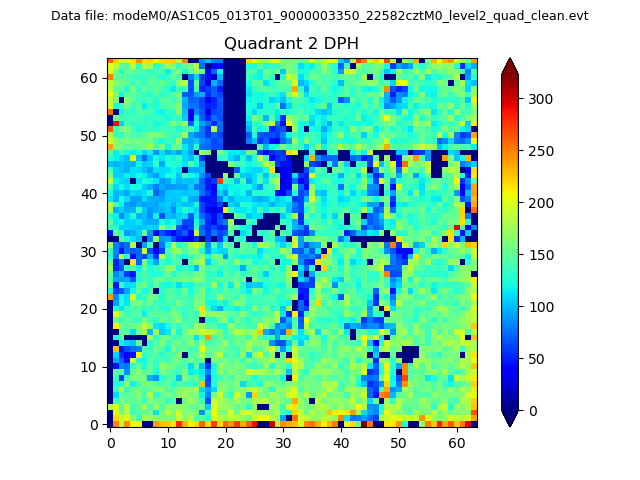 |
Quadrant C |
| Plot type | Count rate plots | Images |
|---|---|---|
| Comparison with Poisson distribution Blue bars denote a histogram of data divided into 1 sec bins. Red curve is a Poisson curve with rate = median count rate of data. |
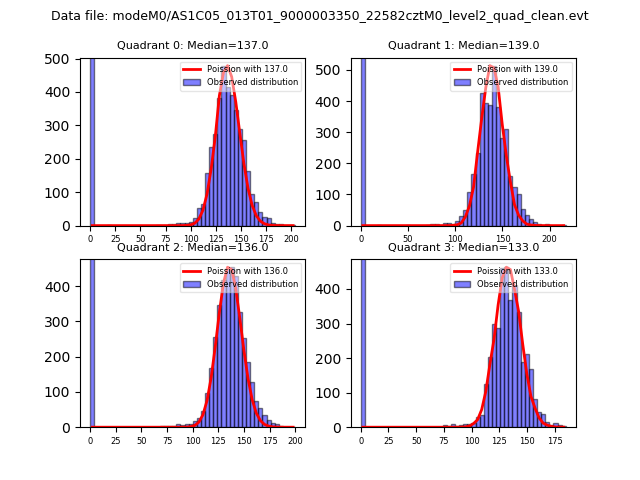 |
 |
| Quadrant-wise count rates Data is divided into 100 sec bins |
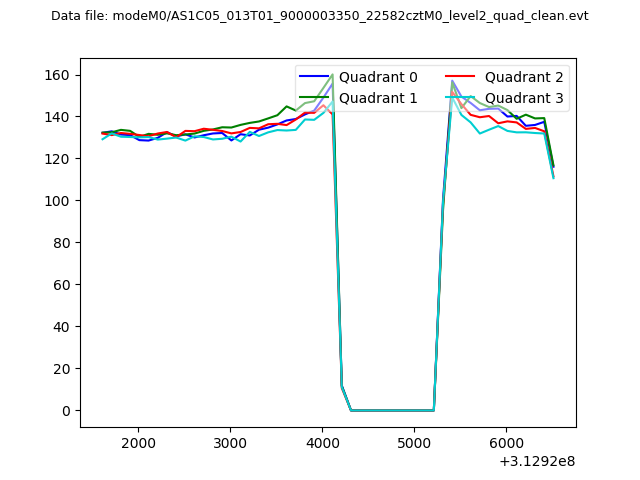 |
|
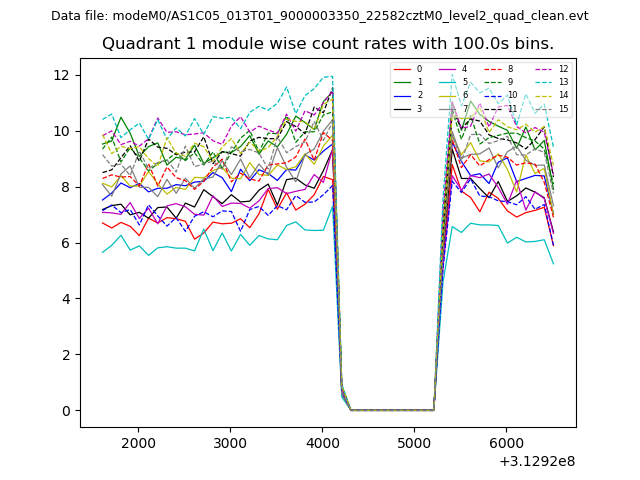
| Module-wise count rates for Quadrant A Data is divided into 100 sec bins |
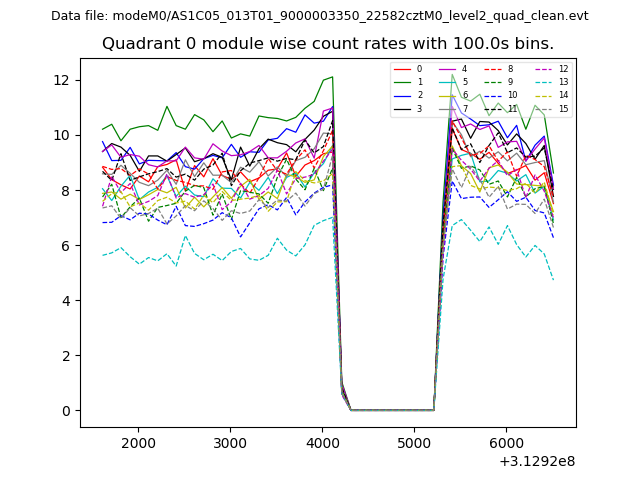 |
 |
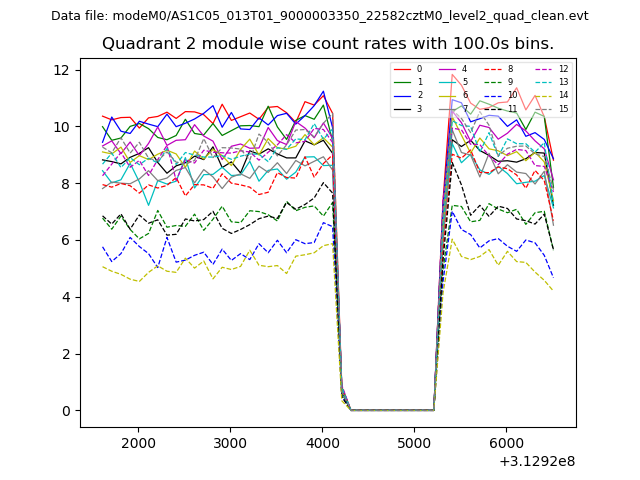
| Module-wise count rates for Quadrant B Data is divided into 100 sec bins |
 |
 |
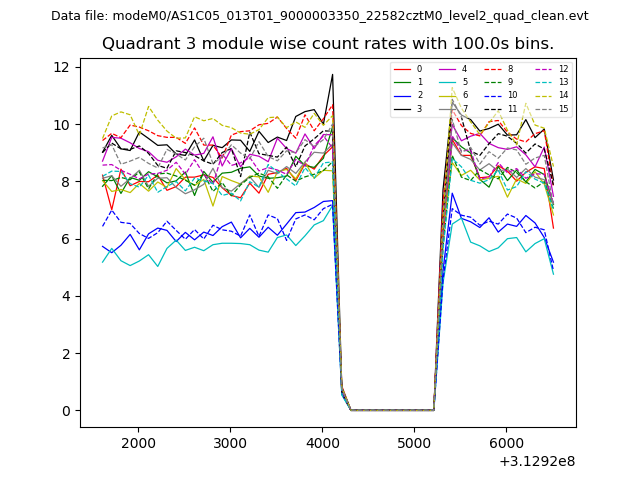
| Module-wise count rates for Quadrant C Data is divided into 100 sec bins |
 |
 |
| Module-wise count rates for Quadrant D Data is divided into 100 sec bins |
 |
 |
| Parameter | Plot |
|---|---|
| CZT HV Monitor | 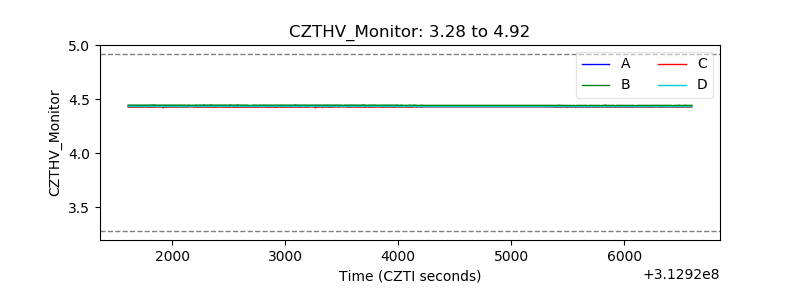 |
| D_VDD | 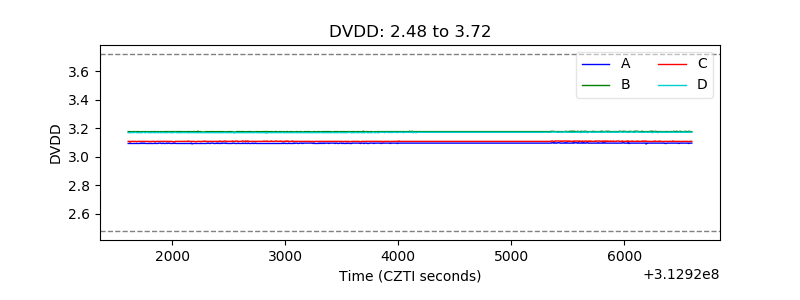 |
| Temperature 1 | 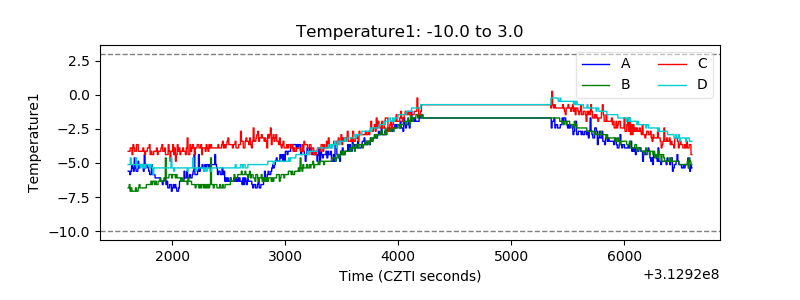 |
| Veto HV Monitor | 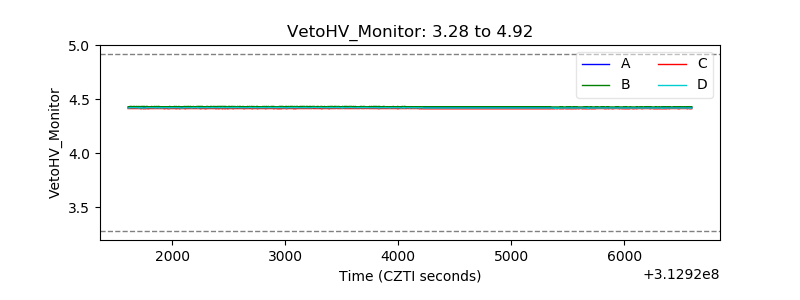 |
| Veto LLD | 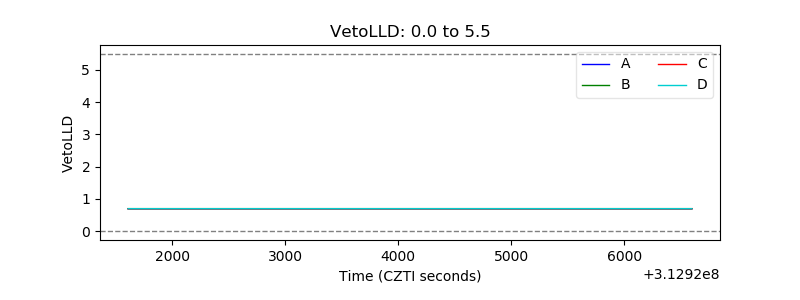 |
| Alpha Counter | 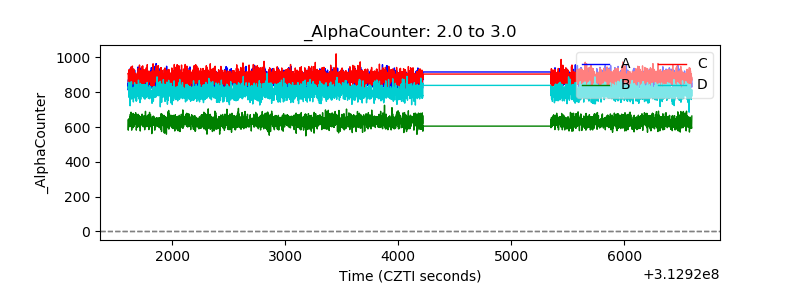 |
| _CPM_Rate | 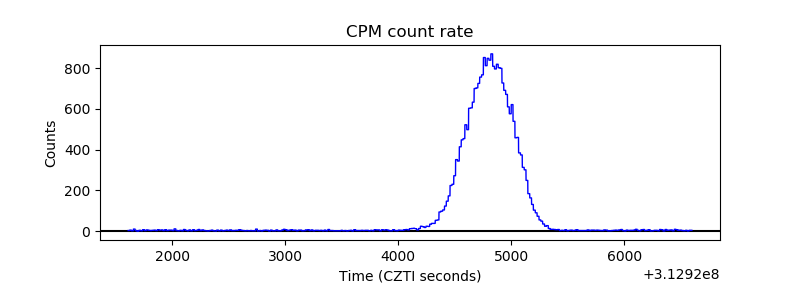 |
| CZT Counter | 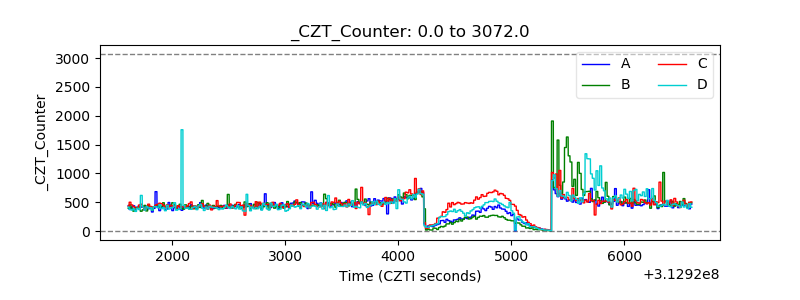 |
| +2.5 Volts monitor |  |
| +5 Volts monitor | 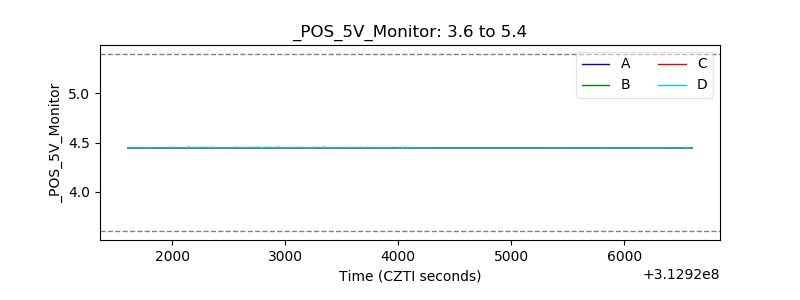 |
| _ROLL_ROT | 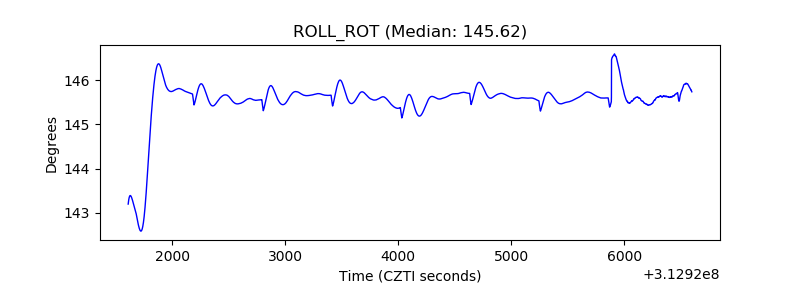 |
| _Roll_DEC | 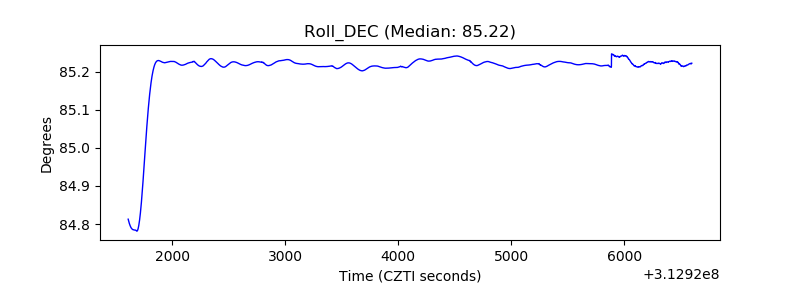 |
| _Roll_RA | 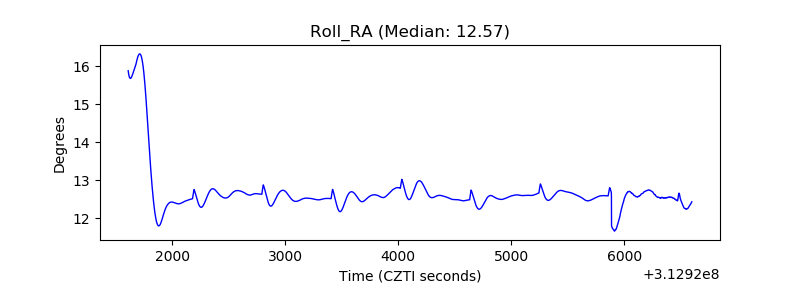 |
| Veto Counter | 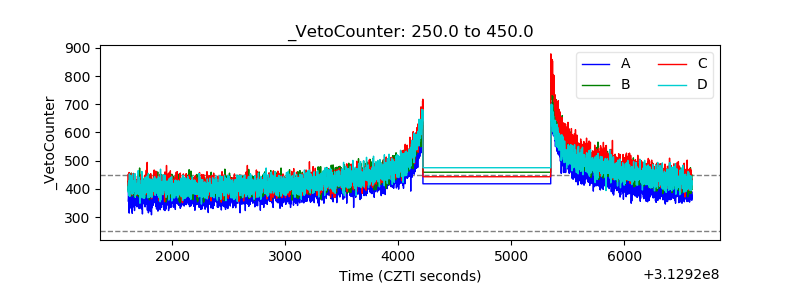 |