| Param | Original file | Final file |
|---|---|---|
| Filename | modeM0/AS1C05_013T01_9000003350_22583cztM0_level2.evt | modeM0/AS1C05_013T01_9000003350_22583cztM0_level2_quad_clean.evt |
| Size (bytes) | 370,900,800 | 106,266,240 |
| Size | 353.7 MB | 101.3 MB |
| Events in quadrant A | 2,466,373 | 716,729 |
| Events in quadrant B | 2,758,885 | 726,255 |
| Events in quadrant C | 2,582,507 | 707,585 |
| Events in quadrant D | 3,056,625 | 689,338 |
| Mode M0 | |||
|---|---|---|---|
| Quadrant | BADHDUFLAG | Total packets | Discarded packets |
| A | 0 | 11051 | 1 |
| B | 0 | 11911 | 1 |
| C | 0 | 11220 | 1 |
| D | 0 | 12849 | 1 |
| Mode M9 | |||
|---|---|---|---|
| Quadrant | BADHDUFLAG | Total packets | Discarded packets |
| A | 0 | 6 | 0 |
| B | 0 | 7 | 0 |
| C | 0 | 7 | 0 |
| D | 0 | 7 | 0 |
| Mode SS | |||
|---|---|---|---|
| Quadrant | BADHDUFLAG | Total packets | Discarded packets |
| A | 0 | 110 | 0 |
| B | 0 | 110 | 0 |
| C | 0 | 110 | 0 |
| D | 0 | 110 | 0 |
| Quadrant | Total seconds | Saturated seconds | Saturation percentage |
|---|---|---|---|
| A | 5410 | 17 | 0.314233% |
| B | 5410 | 110 | 2.033272% |
| C | 5410 | 70 | 1.293900% |
| D | 5410 | 93 | 1.719039% |
Noise dominated data is calculated using 1-second bins in cleaned event files. If a bin has >2000 counts, and if more than 50% of those come from <1% of pixels, then it is considered to be noise-dominated and hence unusable.
| Quadrant | # 1 sec bins | Bins with >0 counts | Bins with >2000 counts | High rate bins dominated by noise | Noise dominated (total time) | Noise dominated (detector-on time) | Marked lightcurve |
|---|---|---|---|---|---|---|---|
| A | 5410 | 5410 | 0 | 0 | 0.00% | 0.00% | 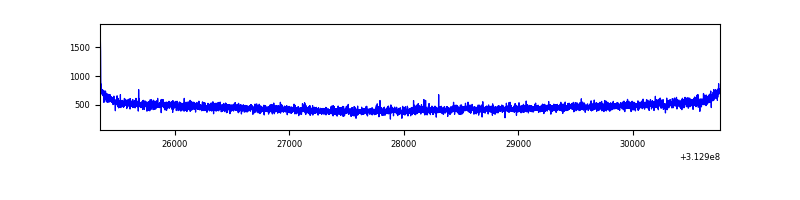 |
| B | 5410 | 5410 | 9 | 9 | 0.17% | 0.17% | 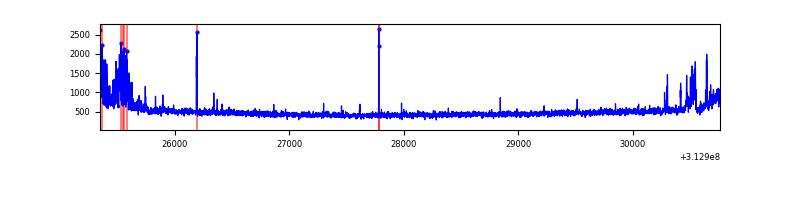 |
| C | 5410 | 5410 | 1 | 1 | 0.02% | 0.02% | 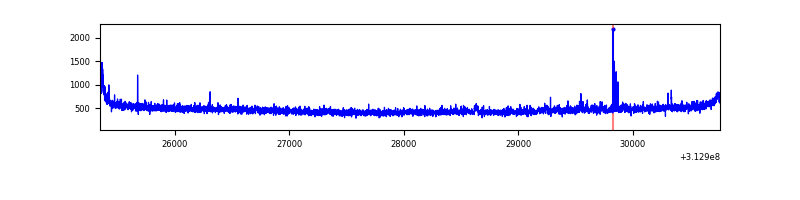 |
| D | 5410 | 5410 | 69 | 69 | 1.28% | 1.28% | 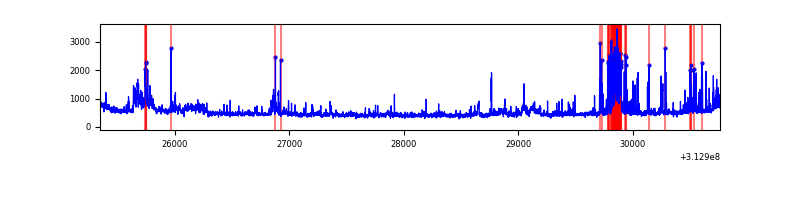 |
Top three noisy pixels from each quadrant. If the there are fewer than three noisy pixels in the level2.evt file, extra rows are filled as -1
| Pixel properties | Quadrant properties | ||||||
|---|---|---|---|---|---|---|---|
| Quadrant | DetID | PixID | Counts | Sigma | Mean | Median | Sigma |
| A | 13 | 34 | 10817 | 79.98 | 636 | 622 | 127.5 |
| A | 13 | 254 | 9160 | 66.98 | 636 | 622 | 127.5 |
| A | 0 | 226 | 5471 | 38.04 | 636 | 622 | 127.5 |
| B | 15 | 33 | 184893 | 1549.2 | 635 | 620 | 118.9 |
| B | 0 | 190 | 28891 | 237.68 | 635 | 620 | 118.9 |
| B | 15 | 35 | 19217 | 156.35 | 635 | 620 | 118.9 |
| C | 14 | 238 | 99447 | 686.72 | 620 | 623 | 143.9 |
| C | 10 | 222 | 25948 | 175.98 | 620 | 623 | 143.9 |
| C | 10 | 22 | 18676 | 125.45 | 620 | 623 | 143.9 |
| D | 1 | 52 | 435738 | 2865.25 | 623 | 603 | 151.9 |
| D | 12 | 227 | 219248 | 1439.72 | 623 | 603 | 151.9 |
| D | 2 | 234 | 23747 | 152.4 | 623 | 603 | 151.9 |
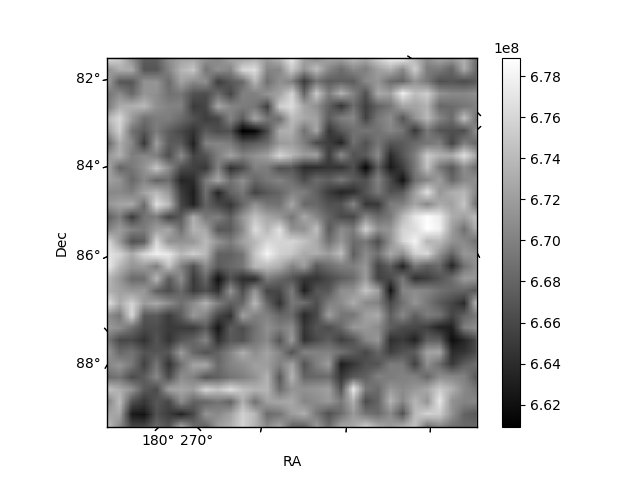
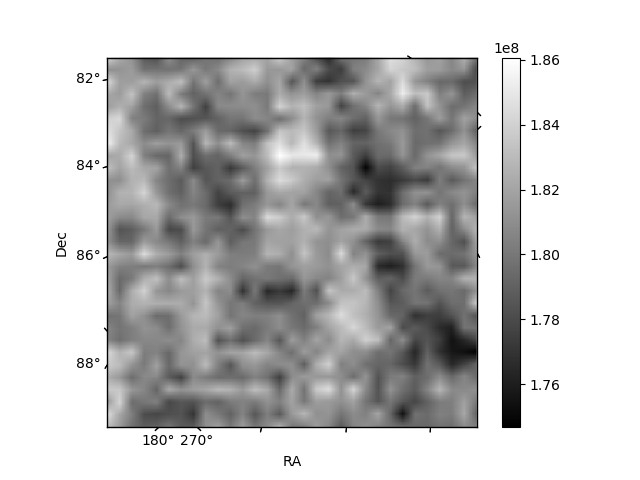
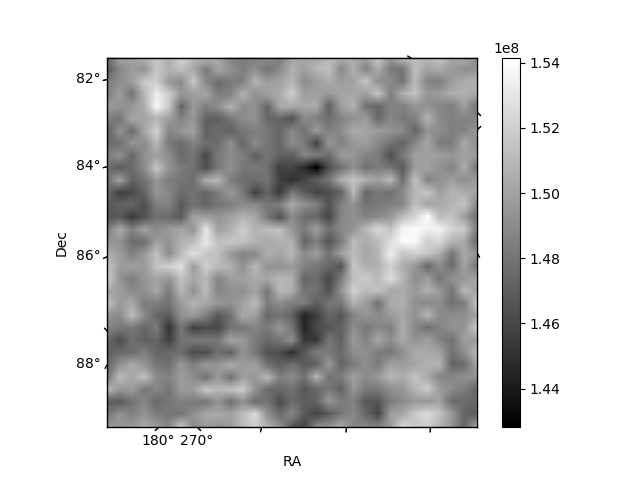
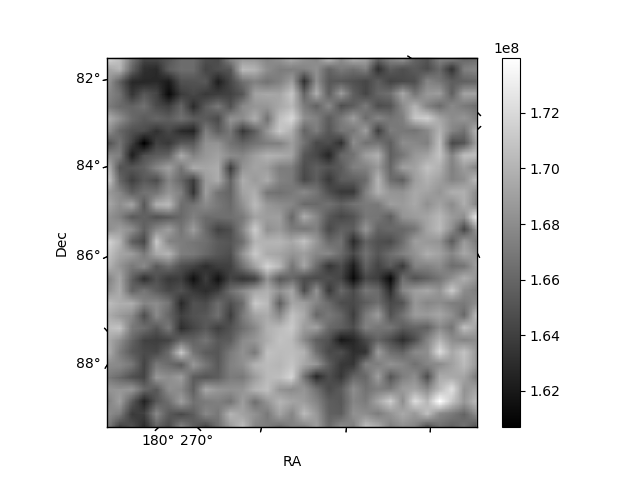
Histogram calculated using DETX and DETY for each event in the final _common_clean file
| Quadrant A | 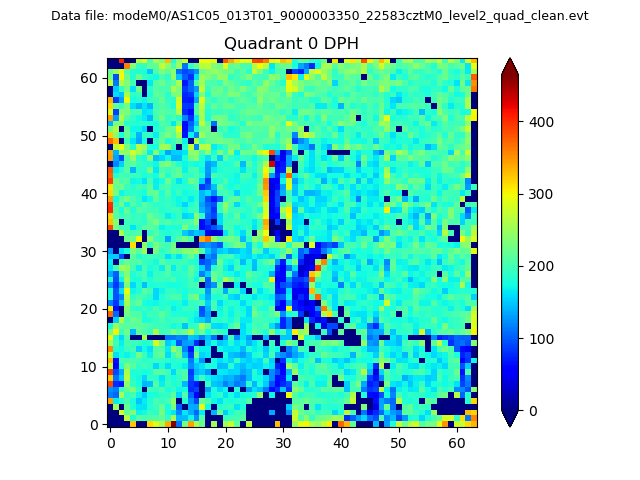 |
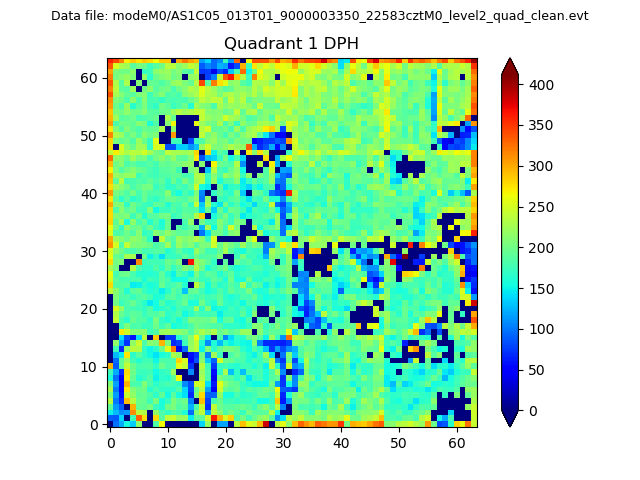 |
Quadrant B |
|---|---|---|---|
| Quadrant D | 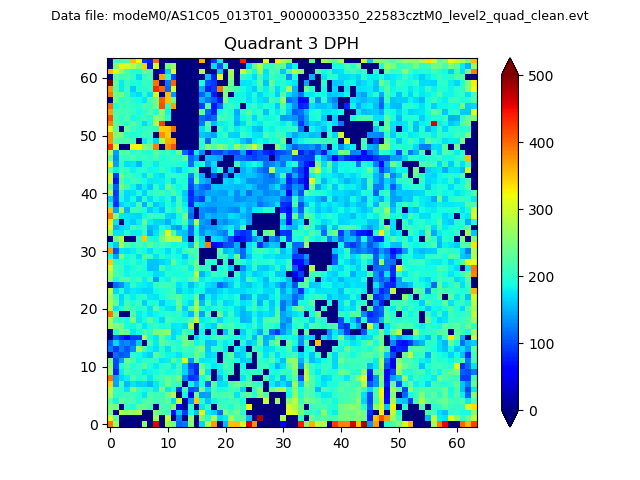 |
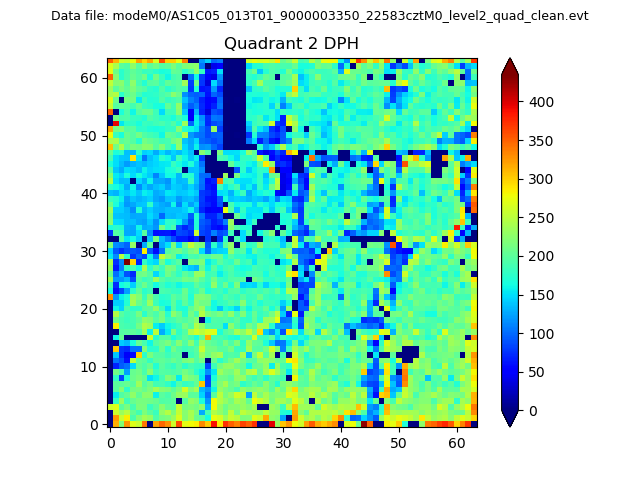 |
Quadrant C |
| Plot type | Count rate plots | Images |
|---|---|---|
| Comparison with Poisson distribution Blue bars denote a histogram of data divided into 1 sec bins. Red curve is a Poisson curve with rate = median count rate of data. |
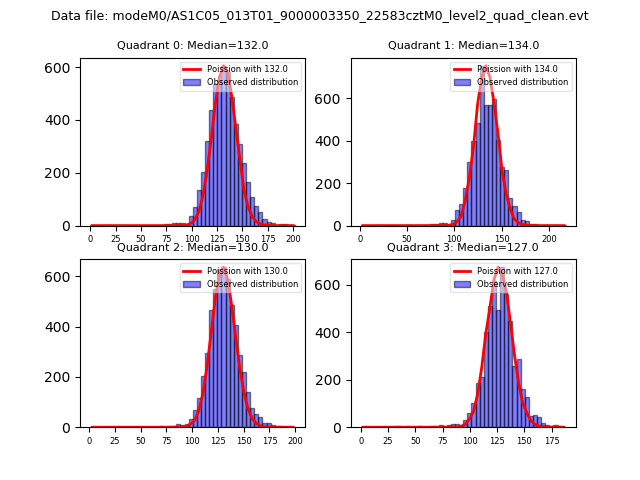 |
 |
| Quadrant-wise count rates Data is divided into 100 sec bins |
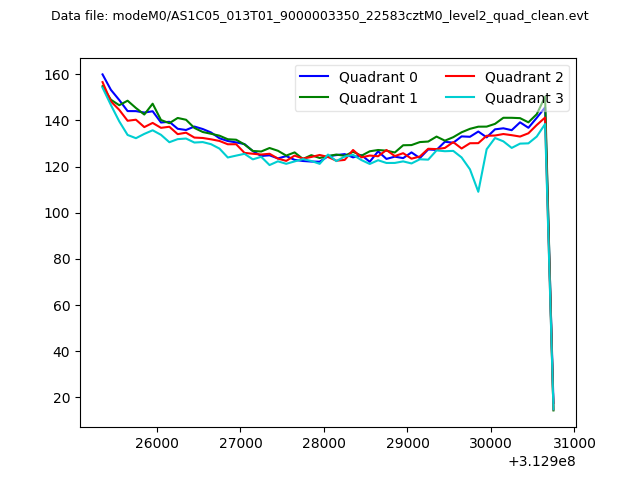 |
|
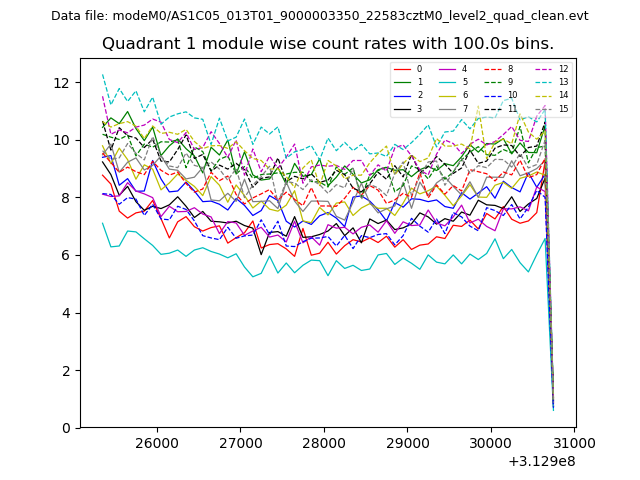
| Module-wise count rates for Quadrant A Data is divided into 100 sec bins |
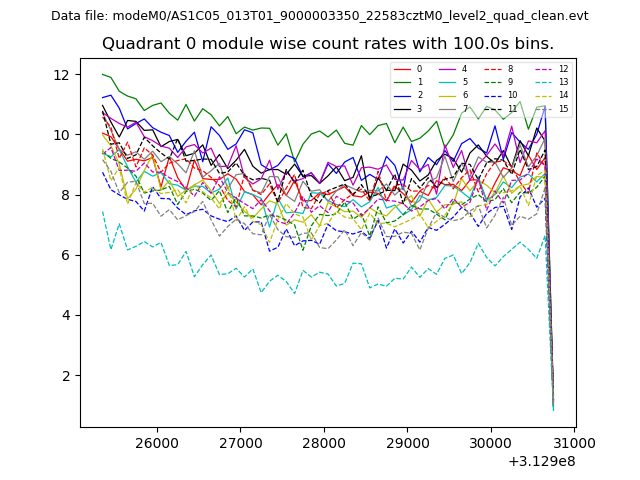 |
 |
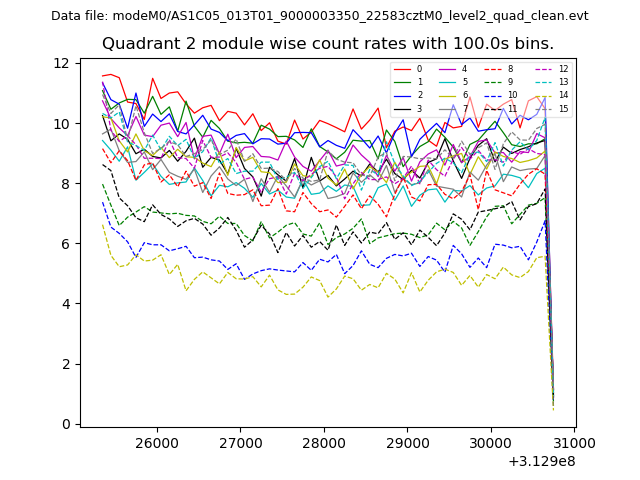
| Module-wise count rates for Quadrant B Data is divided into 100 sec bins |
 |
 |
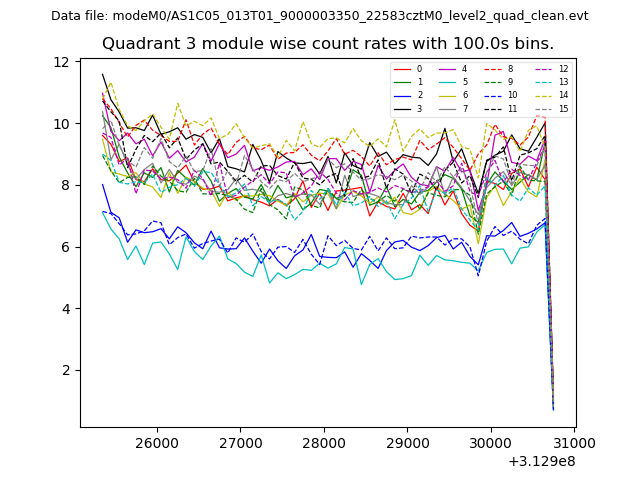
| Module-wise count rates for Quadrant C Data is divided into 100 sec bins |
 |
 |
| Module-wise count rates for Quadrant D Data is divided into 100 sec bins |
 |
 |
| Parameter | Plot |
|---|---|
| CZT HV Monitor | 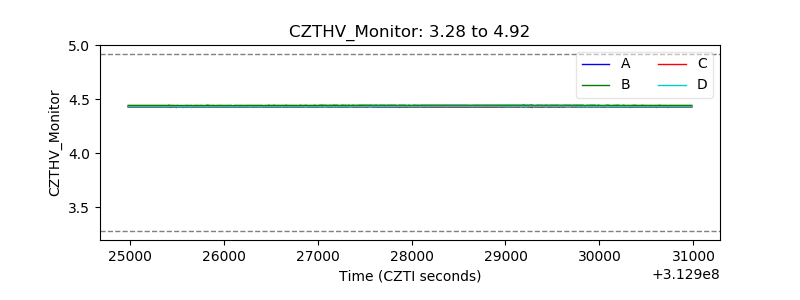 |
| D_VDD | 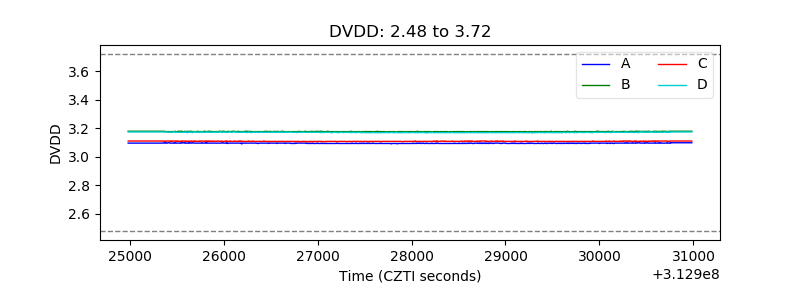 |
| Temperature 1 | 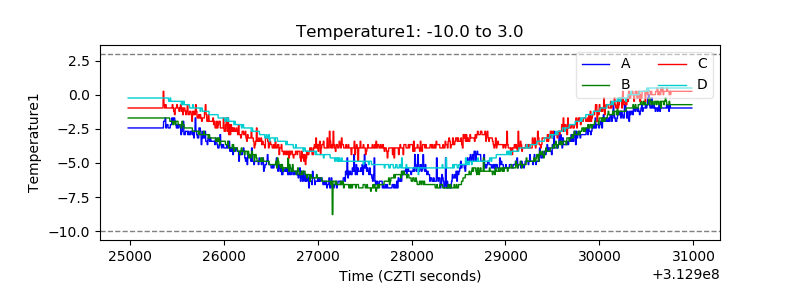 |
| Veto HV Monitor | 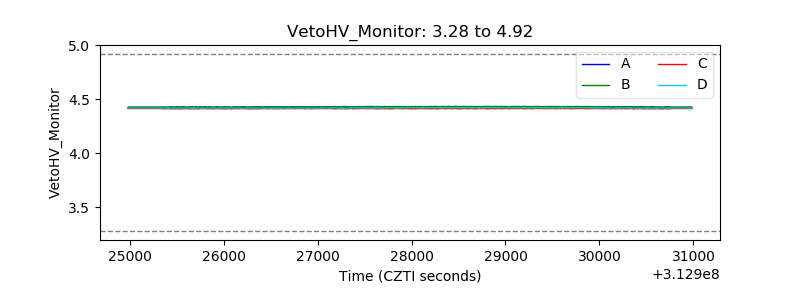 |
| Veto LLD | 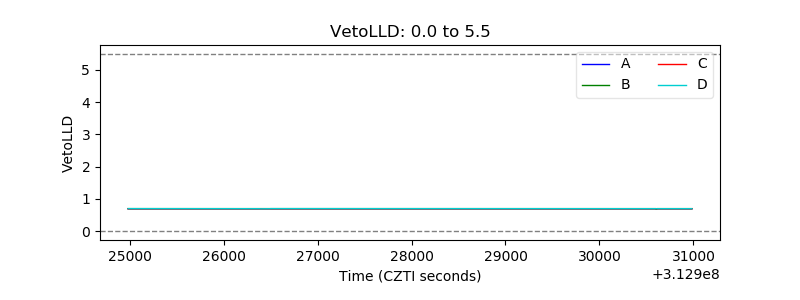 |
| Alpha Counter | 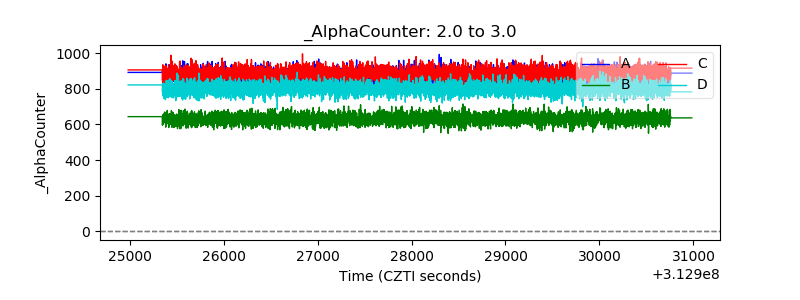 |
| _CPM_Rate | 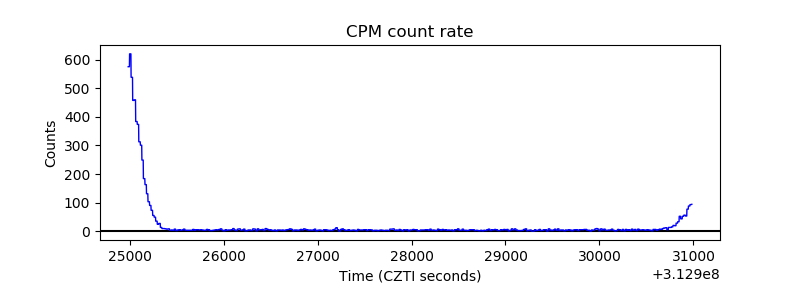 |
| CZT Counter | 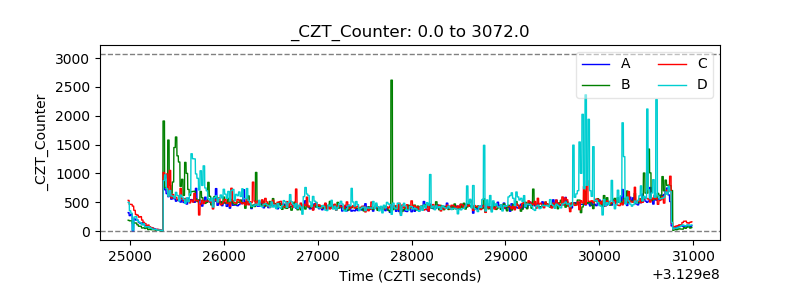 |
| +2.5 Volts monitor |  |
| +5 Volts monitor | 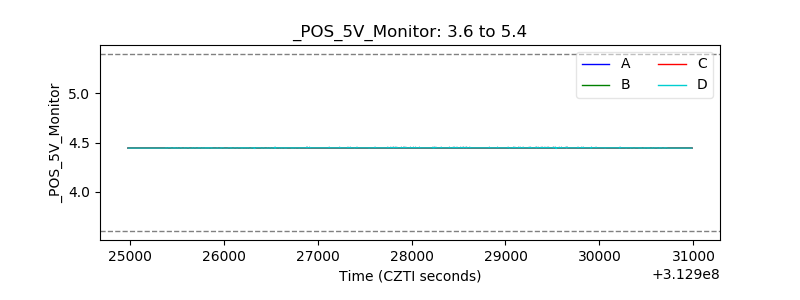 |
| _ROLL_ROT | 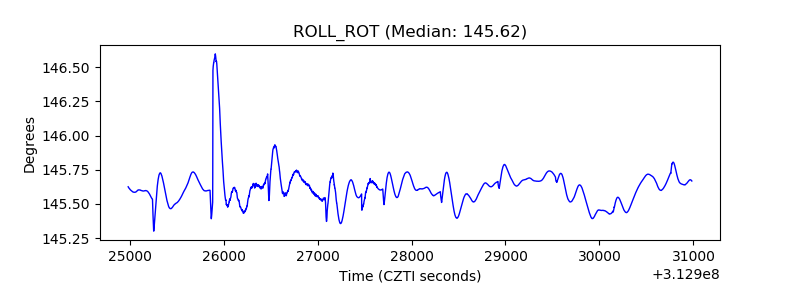 |
| _Roll_DEC | 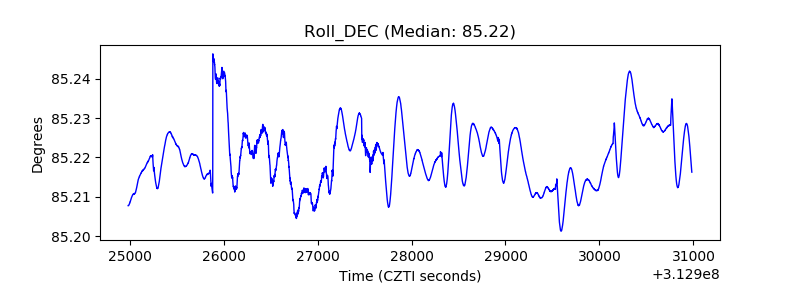 |
| _Roll_RA | 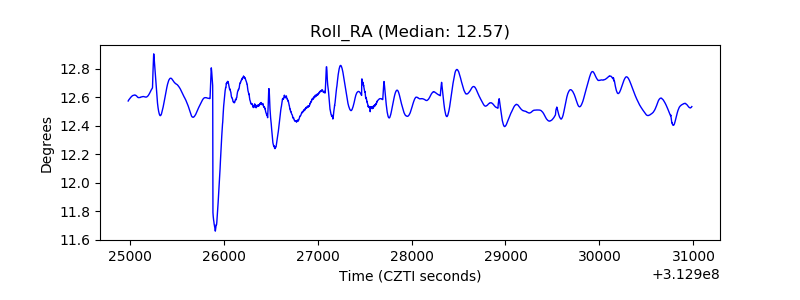 |
| Veto Counter | 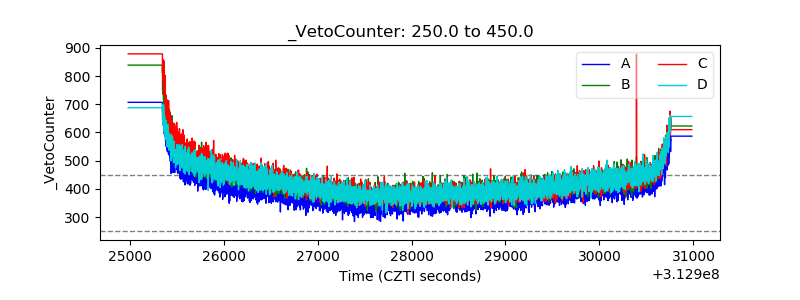 |