| Param | Original file | Final file |
|---|---|---|
| Filename | modeM0/AS1C05_001T01_9000003354cztM0_level2.fits | modeM0/AS1C05_001T01_9000003354cztM0_level2_quad_clean.evt |
| Size (bytes) | 534,337,920 | 619,073,280 |
| Size | 509.6 MB | 590.4 MB |
| Events in quadrant A | 3,337,418 | 3,973,217 |
| Events in quadrant B | 3,166,826 | 3,945,897 |
| Events in quadrant C | 3,194,512 | 3,718,846 |
| Events in quadrant D | 2,790,130 | 3,418,749 |
| Mode M9 | |||
|---|---|---|---|
| Quadrant | BADHDUFLAG | Total packets | Discarded packets |
| A | 0 | 108 | 0 |
| B | 0 | 108 | 0 |
| C | 0 | 108 | 0 |
| D | 0 | 108 | 0 |
| Mode SS | |||
|---|---|---|---|
| Quadrant | BADHDUFLAG | Total packets | Discarded packets |
| A | 0 | 1100 | 0 |
| B | 0 | 1100 | 0 |
| C | 0 | 1100 | 0 |
| D | 0 | 1100 | 0 |
| Mode M0 | |||
|---|---|---|---|
| Quadrant | BADHDUFLAG | Total packets | Discarded packets |
| A | 0 | 112055 | 0 |
| B | 0 | 122230 | 0 |
| C | 0 | 113423 | 0 |
| D | 0 | 133344 | 0 |
| Quadrant | Total seconds | Saturated seconds | Saturation percentage |
|---|---|---|---|
| A | 53827 | 553 | 1.027365% |
| B | 53827 | 1056 | 1.961841% |
| C | 53827 | 842 | 1.564271% |
| D | 53827 | 1656 | 3.076523% |
Noise dominated data is calculated using 1-second bins in cleaned event files. If a bin has >2000 counts, and if more than 50% of those come from <1% of pixels, then it is considered to be noise-dominated and hence unusable.
| Quadrant | # 1 sec bins | Bins with >0 counts | Bins with >2000 counts | High rate bins dominated by noise | Noise dominated (total time) | Noise dominated (detector-on time) | Marked lightcurve |
|---|---|---|---|---|---|---|---|
| A | 64698 | 53827 | 0 | 0 | 0.00% | 0.00% | 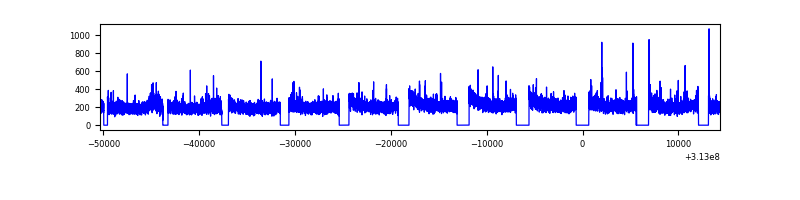 |
| B | 64698 | 53827 | 0 | 0 | 0.00% | 0.00% |  |
| C | 64698 | 53826 | 0 | 0 | 0.00% | 0.00% |  |
| D | 64698 | 53820 | 0 | 0 | 0.00% | 0.00% |  |
Top three noisy pixels from each quadrant. If the there are fewer than three noisy pixels in the level2.evt file, extra rows are filled as -1
| Pixel properties | Quadrant properties | ||||||
|---|---|---|---|---|---|---|---|
| Quadrant | DetID | PixID | Counts | Sigma | Mean | Median | Sigma |
| A | 0 | 29 | 3090 | 10.65 | 871 | 825 | 212.7 |
| A | 7 | 110 | 2656 | 8.61 | 871 | 825 | 212.7 |
| A | 9 | 19 | 2454 | 7.66 | 871 | 825 | 212.7 |
| B | 2 | 9 | 2444 | 10.05 | 840 | 806 | 163.0 |
| B | 5 | 128 | 2090 | 7.88 | 840 | 806 | 163.0 |
| B | 14 | 254 | 2086 | 7.85 | 840 | 806 | 163.0 |
| C | 12 | 241 | 2160 | 6.34 | 845 | 794 | 215.5 |
| C | 7 | 111 | 2120 | 6.15 | 845 | 794 | 215.5 |
| C | 3 | 187 | 2113 | 6.12 | 845 | 794 | 215.5 |
| D | 3 | 14 | 1991 | 5.99 | 796 | 729 | 210.6 |
| D | 6 | 38 | 1961 | 5.85 | 796 | 729 | 210.6 |
| D | 10 | 189 | 1948 | 5.79 | 796 | 729 | 210.6 |
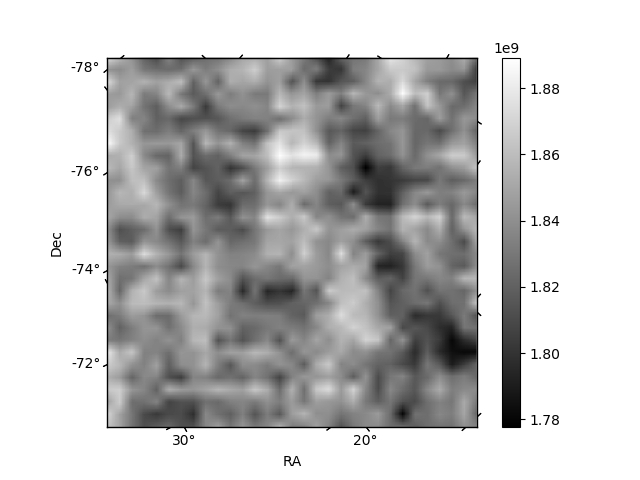
Histogram calculated using DETX and DETY for each event in the final _common_clean file
| Quadrant A | 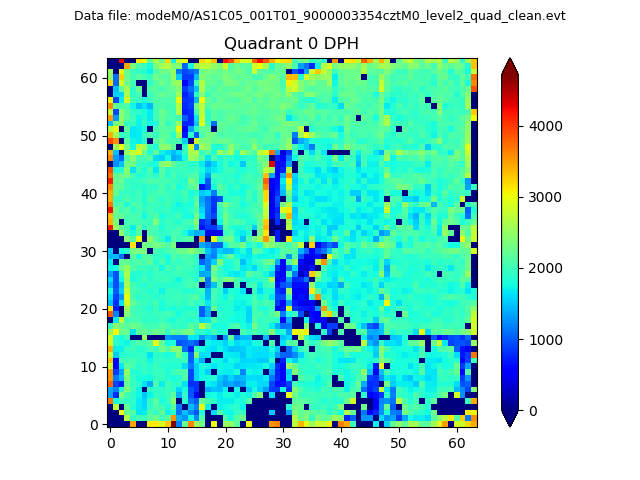 |
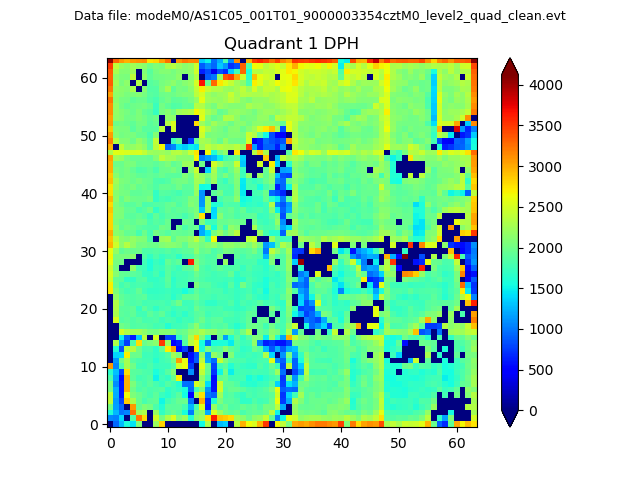 |
Quadrant B |
|---|---|---|---|
| Quadrant D |  |
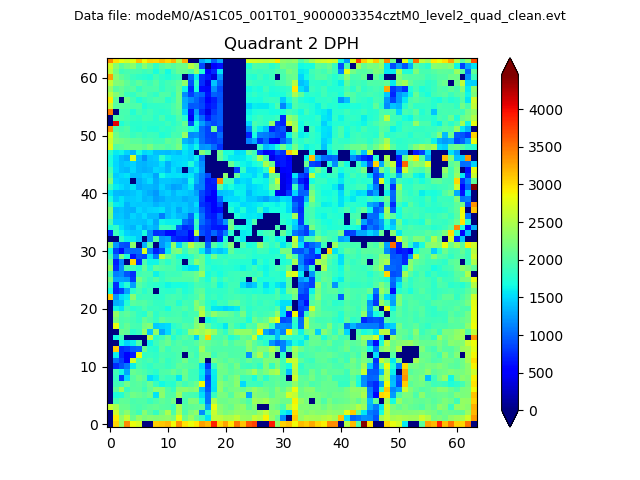 |
Quadrant C |
| Plot type | Count rate plots | Images |
|---|---|---|
| Comparison with Poisson distribution Blue bars denote a histogram of data divided into 1 sec bins. Red curve is a Poisson curve with rate = median count rate of data. |
 |
 |
| Quadrant-wise count rates Data is divided into 100 sec bins |
 |
|
| Module-wise count rates for Quadrant A Data is divided into 100 sec bins |
 |
 |
| Module-wise count rates for Quadrant B Data is divided into 100 sec bins |
 |
 |
| Module-wise count rates for Quadrant C Data is divided into 100 sec bins |
 |
 |
| Module-wise count rates for Quadrant D Data is divided into 100 sec bins |
 |
 |
| Parameter | Plot |
|---|---|
| CZT HV Monitor |  |
| D_VDD | 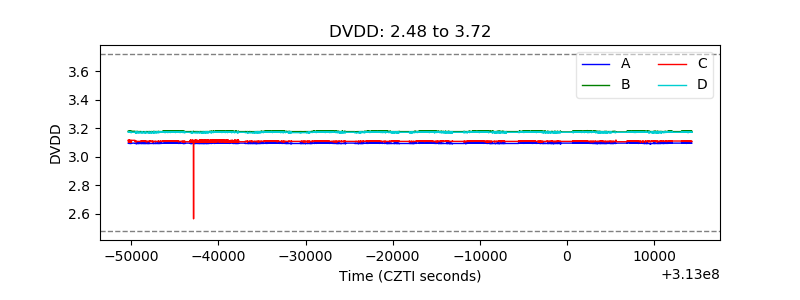 |
| Temperature 1 |  |
| Veto HV Monitor |  |
| Veto LLD | 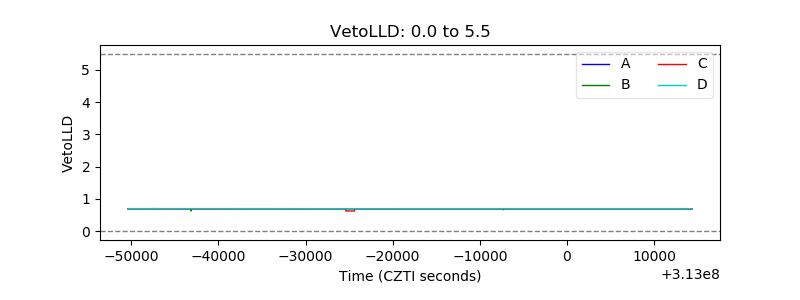 |
| Alpha Counter |  |
| _CPM_Rate | 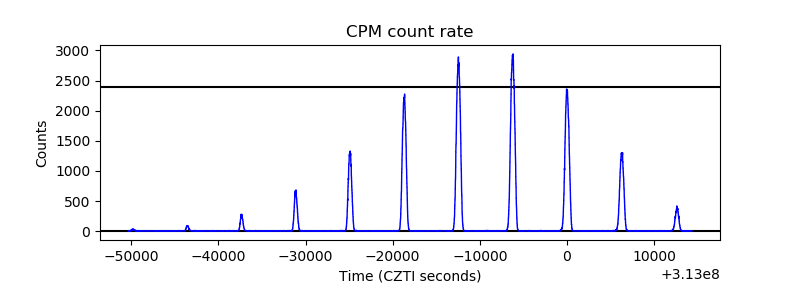 |
| CZT Counter |  |
| +2.5 Volts monitor |  |
| +5 Volts monitor |  |
| _ROLL_ROT |  |
| _Roll_DEC |  |
| _Roll_RA |  |
| Veto Counter |  |