| Param | Original file | Final file |
|---|---|---|
| Filename | modeM0/AS1C05_001T01_9000003354_22586cztM0_level2.evt | modeM0/AS1C05_001T01_9000003354_22586cztM0_level2_quad_clean.evt |
| Size (bytes) | 138,435,840 | 37,319,040 |
| Size | 132.0 MB | 35.6 MB |
| Events in quadrant A | 931,460 | 252,610 |
| Events in quadrant B | 960,607 | 256,299 |
| Events in quadrant C | 952,998 | 240,037 |
| Events in quadrant D | 1,208,017 | 234,481 |
| Mode M9 | |||
|---|---|---|---|
| Quadrant | BADHDUFLAG | Total packets | Discarded packets |
| A | 0 | 4 | 0 |
| B | 0 | 4 | 0 |
| C | 0 | 4 | 0 |
| D | 0 | 4 | 0 |
| Mode SS | |||
|---|---|---|---|
| Quadrant | BADHDUFLAG | Total packets | Discarded packets |
| A | 0 | 42 | 0 |
| B | 0 | 42 | 0 |
| C | 0 | 42 | 0 |
| D | 0 | 42 | 0 |
| Mode M0 | |||
|---|---|---|---|
| Quadrant | BADHDUFLAG | Total packets | Discarded packets |
| A | 0 | 4193 | 1 |
| B | 0 | 4222 | 1 |
| C | 0 | 4200 | 1 |
| D | 0 | 5020 | 1 |
| Quadrant | Total seconds | Saturated seconds | Saturation percentage |
|---|---|---|---|
| A | 2015 | 51 | 2.531017% |
| B | 2015 | 70 | 3.473945% |
| C | 2015 | 74 | 3.672457% |
| D | 2015 | 90 | 4.466501% |
Noise dominated data is calculated using 1-second bins in cleaned event files. If a bin has >2000 counts, and if more than 50% of those come from <1% of pixels, then it is considered to be noise-dominated and hence unusable.
| Quadrant | # 1 sec bins | Bins with >0 counts | Bins with >2000 counts | High rate bins dominated by noise | Noise dominated (total time) | Noise dominated (detector-on time) | Marked lightcurve |
|---|---|---|---|---|---|---|---|
| A | 2410 | 2016 | 0 | 0 | 0.00% | 0.00% | 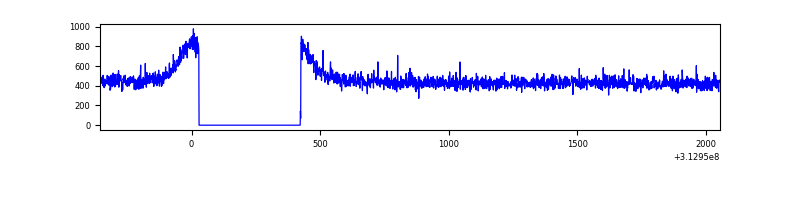 |
| B | 2410 | 2016 | 0 | 0 | 0.00% | 0.00% | 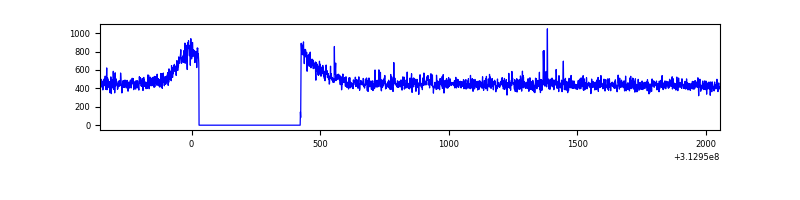 |
| C | 2410 | 2016 | 0 | 0 | 0.00% | 0.00% | 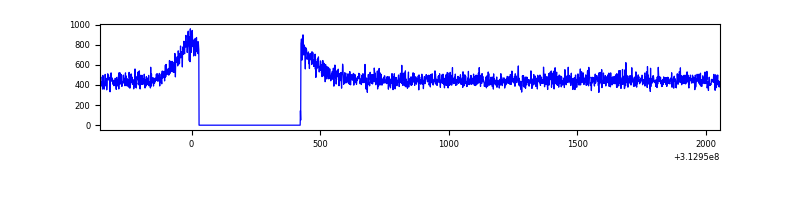 |
| D | 2410 | 2016 | 5 | 5 | 0.21% | 0.25% | 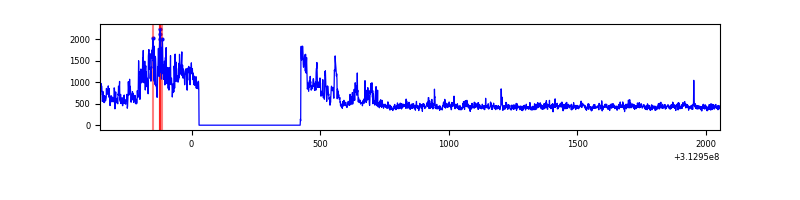 |
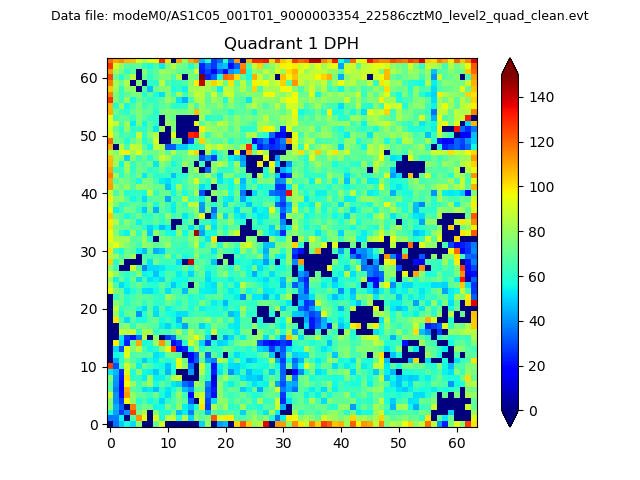
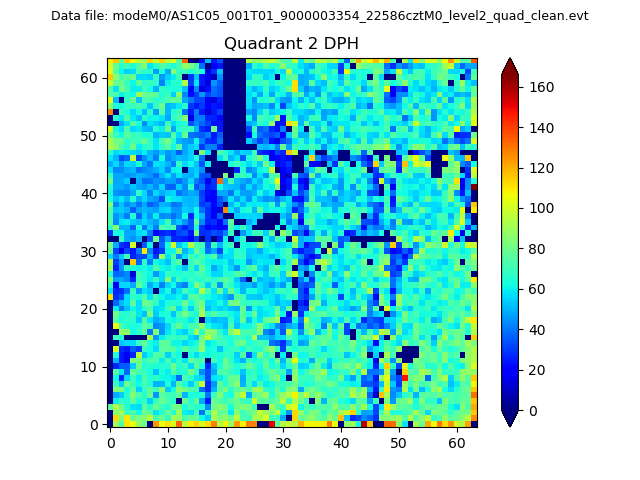
Top three noisy pixels from each quadrant. If the there are fewer than three noisy pixels in the level2.evt file, extra rows are filled as -1
| Pixel properties | Quadrant properties | ||||||
|---|---|---|---|---|---|---|---|
| Quadrant | DetID | PixID | Counts | Sigma | Mean | Median | Sigma |
| A | 11 | 47 | 3479 | 64.08 | 240 | 235 | 50.6 |
| A | 13 | 254 | 3312 | 60.79 | 240 | 235 | 50.6 |
| A | 3 | 137 | 2167 | 38.17 | 240 | 235 | 50.6 |
| B | 12 | 111 | 6054 | 119.93 | 243 | 236 | 48.5 |
| B | 11 | 111 | 4979 | 97.77 | 243 | 236 | 48.5 |
| B | 14 | 111 | 4504 | 87.98 | 243 | 236 | 48.5 |
| C | 14 | 238 | 36426 | 634.35 | 234 | 235 | 57.1 |
| C | 13 | 61 | 1658 | 24.94 | 234 | 235 | 57.1 |
| C | 8 | 128 | 876 | 11.24 | 234 | 235 | 57.1 |
| D | 12 | 227 | 269756 | 4655.16 | 232 | 224 | 57.9 |
| D | 1 | 52 | 50695 | 871.7 | 232 | 224 | 57.9 |
| D | 15 | 0 | 9818 | 165.7 | 232 | 224 | 57.9 |
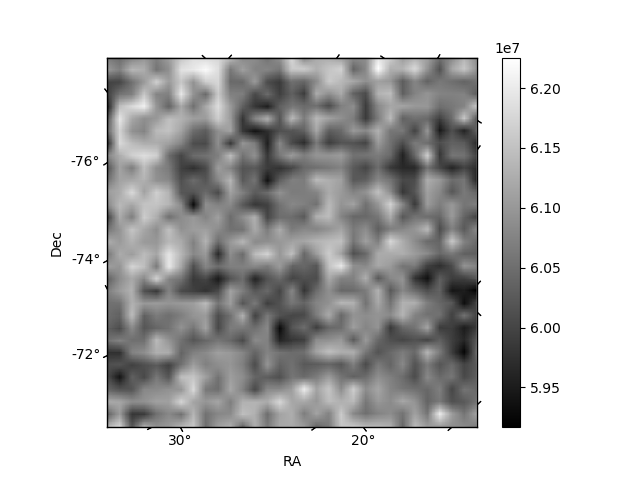
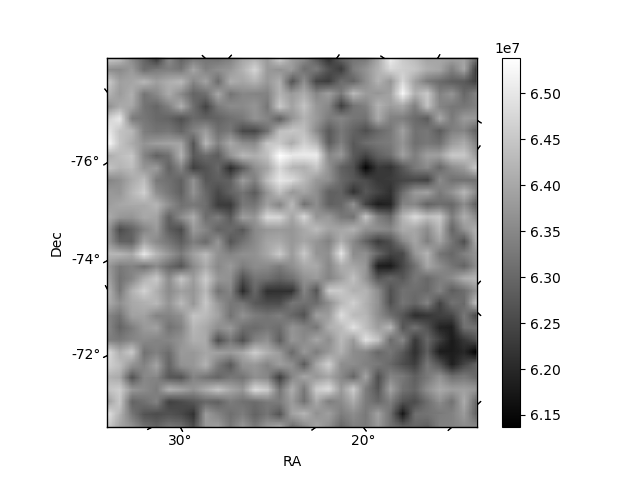
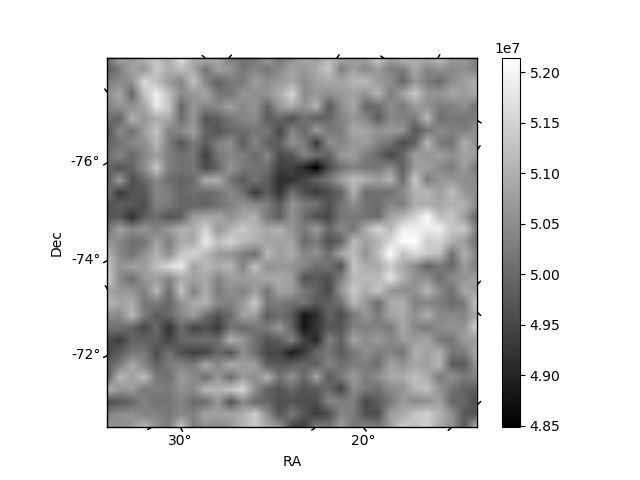
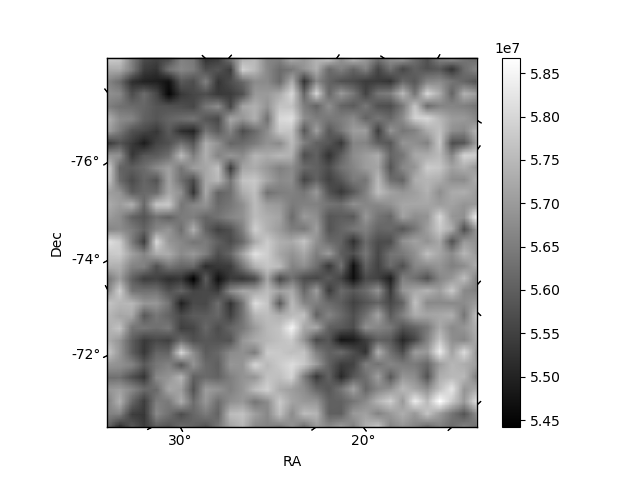
Histogram calculated using DETX and DETY for each event in the final _common_clean file
| Quadrant A | 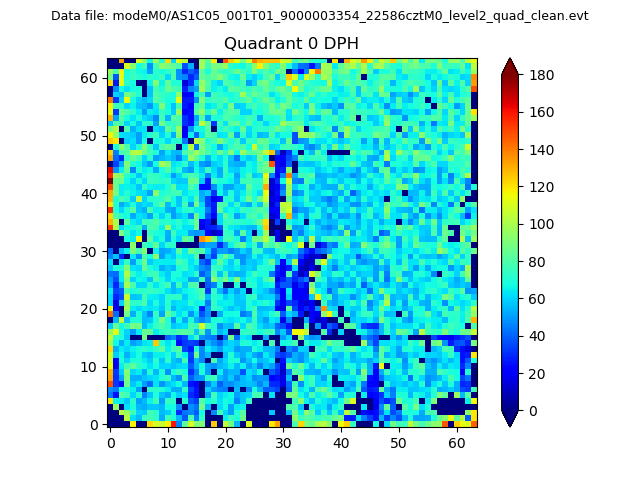 |
 |
Quadrant B |
|---|---|---|---|
| Quadrant D | 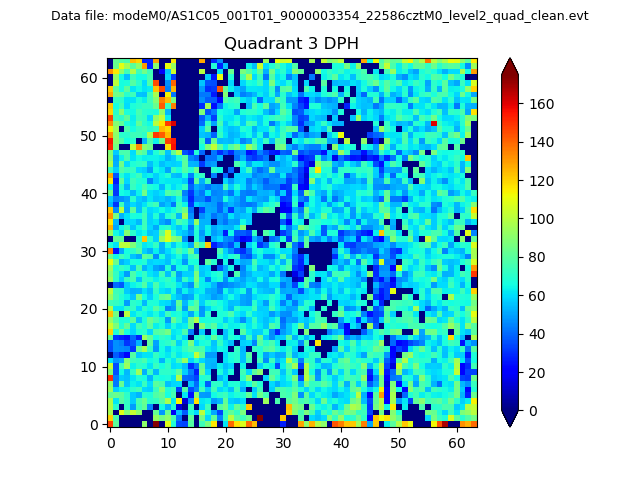 |
 |
Quadrant C |
| Plot type | Count rate plots | Images |
|---|---|---|
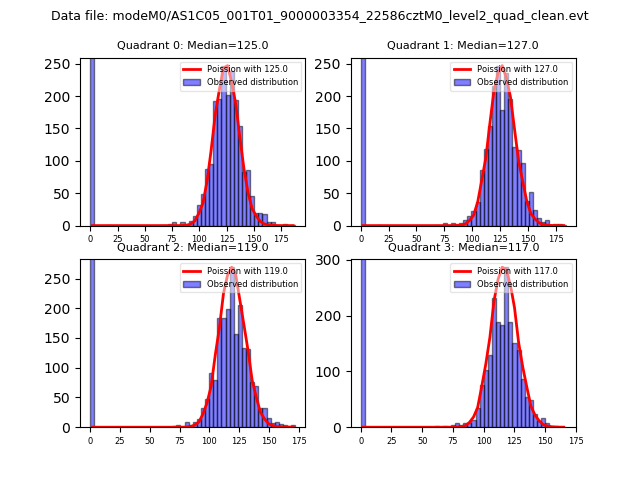
| Comparison with Poisson distribution Blue bars denote a histogram of data divided into 1 sec bins. Red curve is a Poisson curve with rate = median count rate of data. |
 |
 |
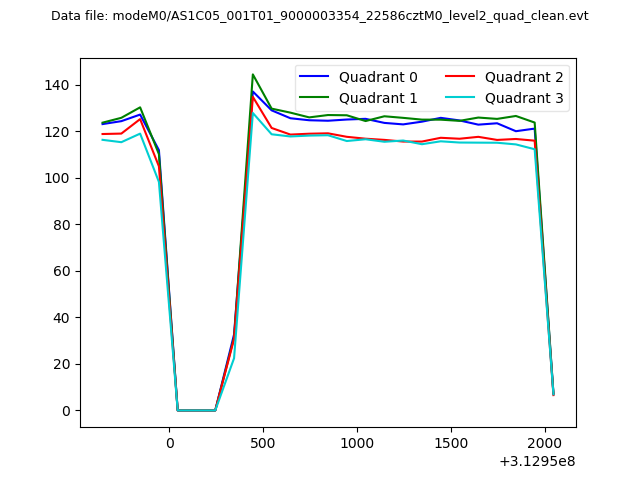
| Quadrant-wise count rates Data is divided into 100 sec bins |
 |
|
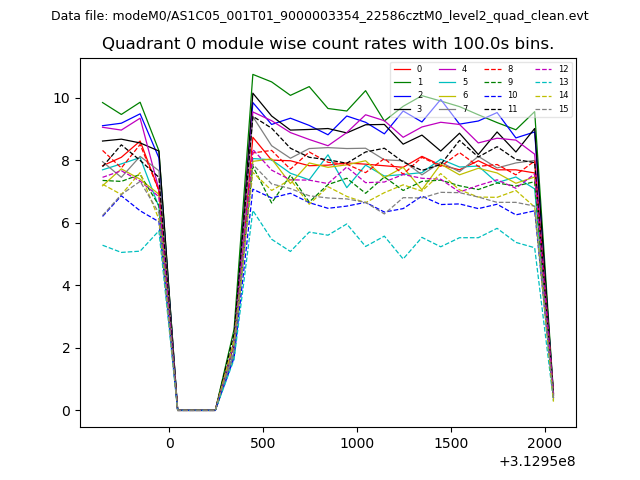
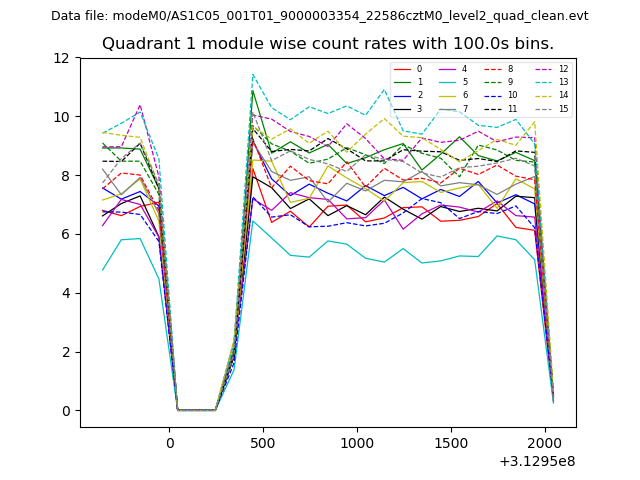
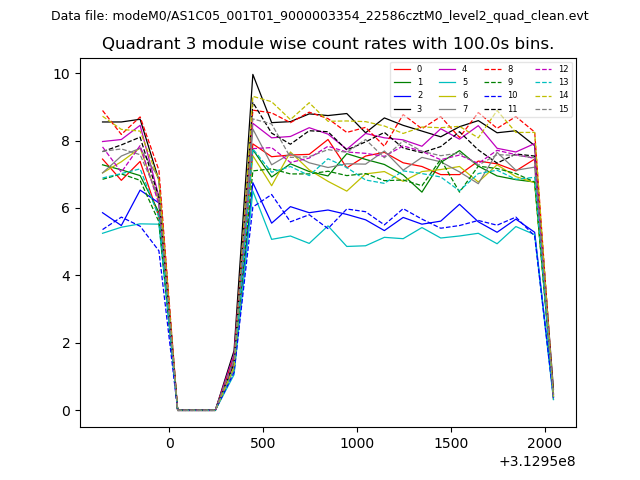
| Module-wise count rates for Quadrant A Data is divided into 100 sec bins |
 |
 |
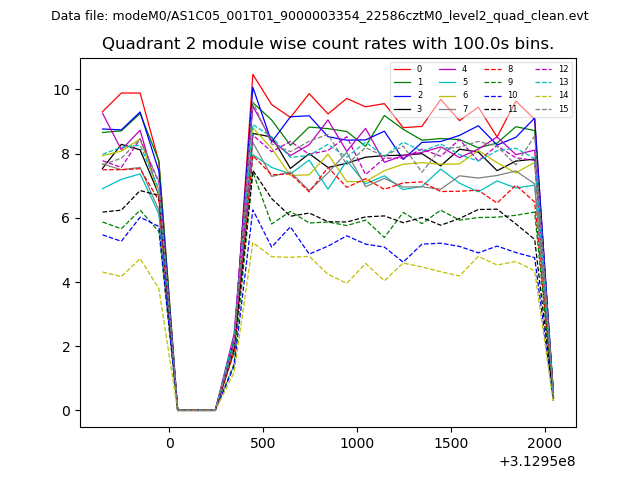
| Module-wise count rates for Quadrant B Data is divided into 100 sec bins |
 |
 |
| Module-wise count rates for Quadrant C Data is divided into 100 sec bins |
 |
 |
| Module-wise count rates for Quadrant D Data is divided into 100 sec bins |
 |
 |
| Parameter | Plot |
|---|---|
| CZT HV Monitor | 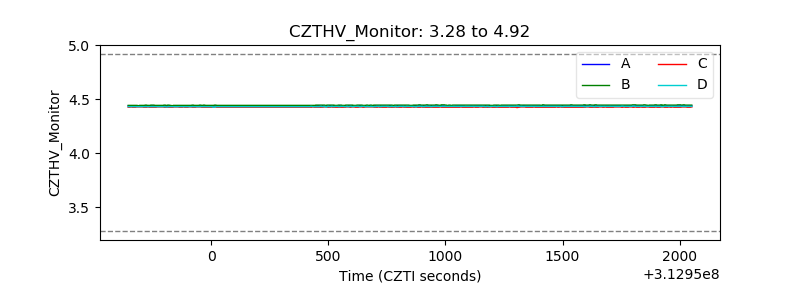 |
| D_VDD | 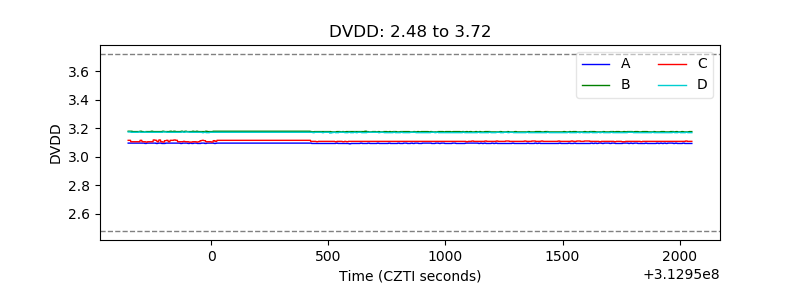 |
| Temperature 1 | 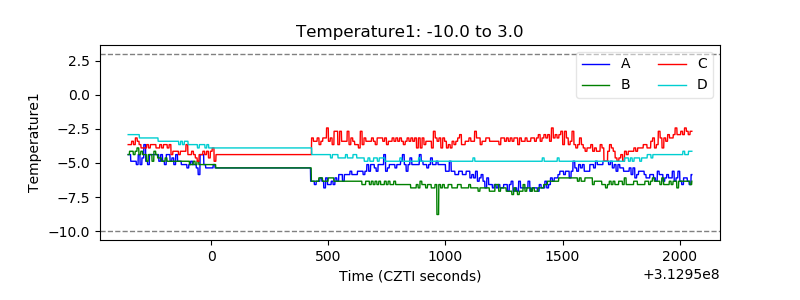 |
| Veto HV Monitor | 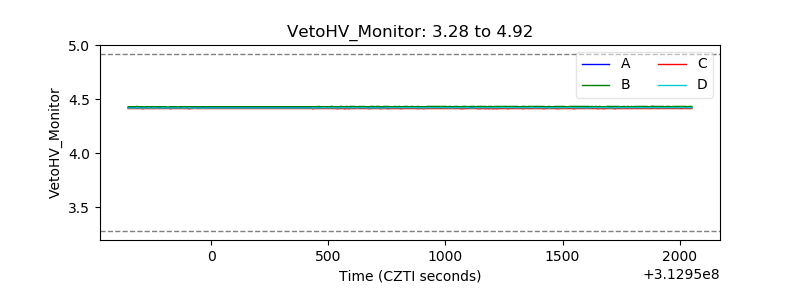 |
| Veto LLD | 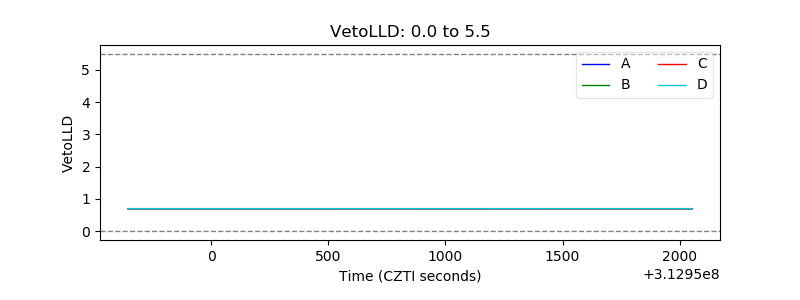 |
| Alpha Counter | 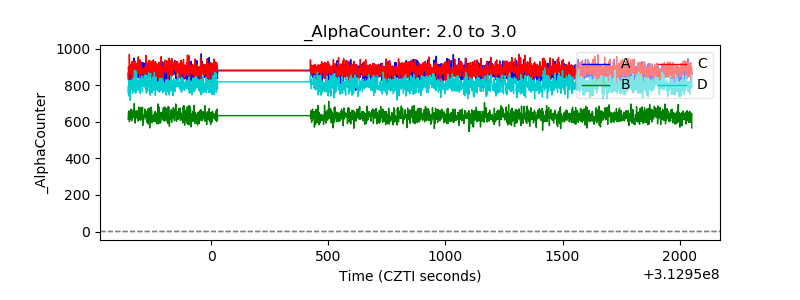 |
| _CPM_Rate | 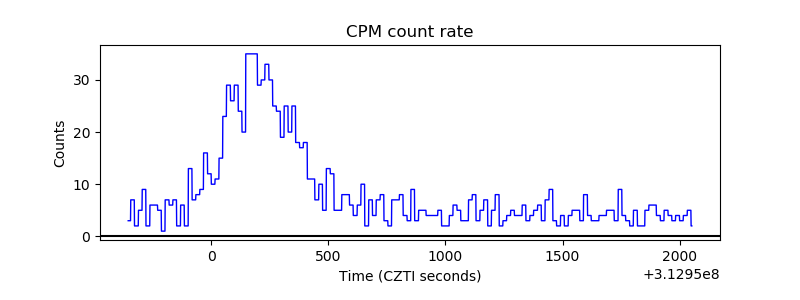 |
| CZT Counter | 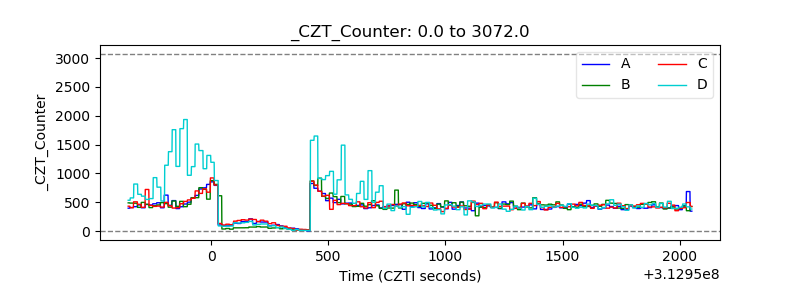 |
| +2.5 Volts monitor |  |
| +5 Volts monitor |  |
| _ROLL_ROT | 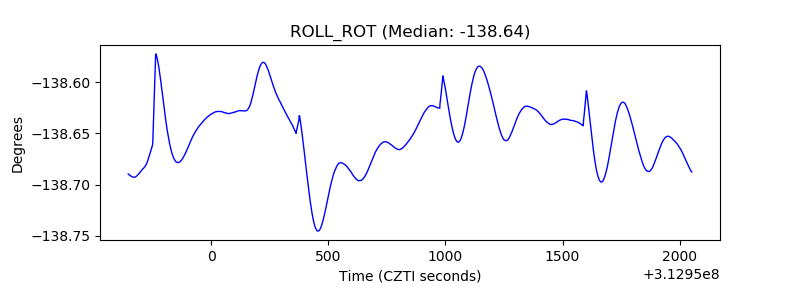 |
| _Roll_DEC | 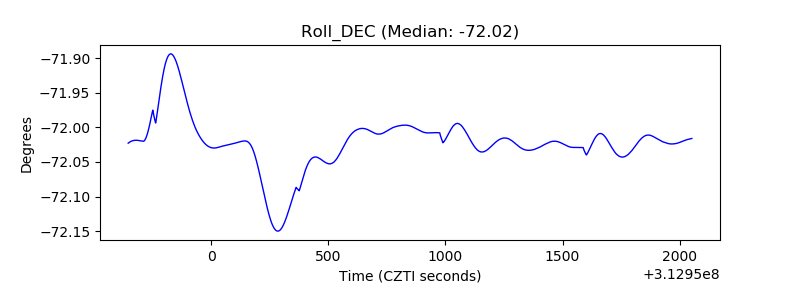 |
| _Roll_RA | 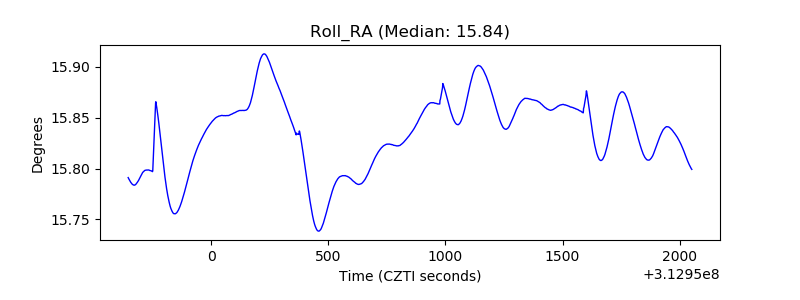 |
| Veto Counter | 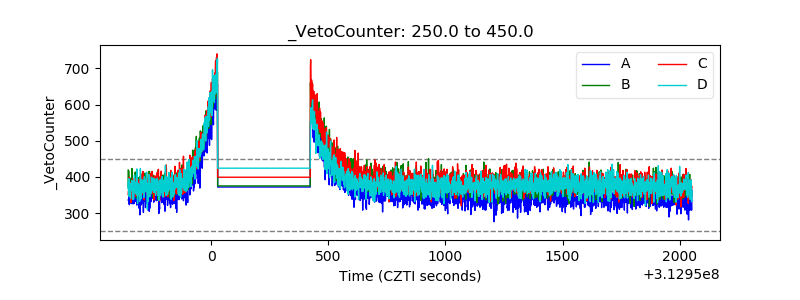 |