| Param | Original file | Final file |
|---|---|---|
| Filename | modeM0/AS1C05_001T01_9000003354_22588cztM0_level2.evt | modeM0/AS1C05_001T01_9000003354_22588cztM0_level2_quad_clean.evt |
| Size (bytes) | 752,503,680 | 205,859,520 |
| Size | 717.6 MB | 196.3 MB |
| Events in quadrant A | 5,115,595 | 1,389,740 |
| Events in quadrant B | 5,864,136 | 1,399,343 |
| Events in quadrant C | 5,164,749 | 1,348,275 |
| Events in quadrant D | 5,880,907 | 1,317,989 |
| Mode M9 | |||
|---|---|---|---|
| Quadrant | BADHDUFLAG | Total packets | Discarded packets |
| A | 0 | 12 | 0 |
| B | 0 | 12 | 0 |
| C | 0 | 12 | 0 |
| D | 0 | 12 | 0 |
| Mode SS | |||
|---|---|---|---|
| Quadrant | BADHDUFLAG | Total packets | Discarded packets |
| A | 0 | 230 | 0 |
| B | 0 | 230 | 0 |
| C | 0 | 230 | 0 |
| D | 0 | 230 | 0 |
| Mode M0 | |||
|---|---|---|---|
| Quadrant | BADHDUFLAG | Total packets | Discarded packets |
| A | 0 | 22860 | 1 |
| B | 0 | 24904 | 1 |
| C | 0 | 22889 | 1 |
| D | 0 | 25121 | 1 |
| Quadrant | Total seconds | Saturated seconds | Saturation percentage |
|---|---|---|---|
| A | 11270 | 123 | 1.091393% |
| B | 11270 | 248 | 2.200532% |
| C | 11271 | 177 | 1.570402% |
| D | 11271 | 265 | 2.351167% |
Noise dominated data is calculated using 1-second bins in cleaned event files. If a bin has >2000 counts, and if more than 50% of those come from <1% of pixels, then it is considered to be noise-dominated and hence unusable.
| Quadrant | # 1 sec bins | Bins with >0 counts | Bins with >2000 counts | High rate bins dominated by noise | Noise dominated (total time) | Noise dominated (detector-on time) | Marked lightcurve |
|---|---|---|---|---|---|---|---|
| A | 11806 | 11271 | 0 | 0 | 0.00% | 0.00% | 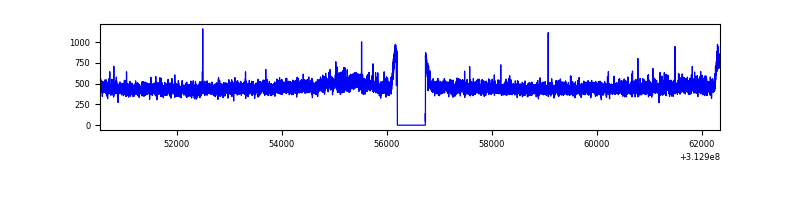 |
| B | 11806 | 11271 | 34 | 34 | 0.29% | 0.30% | 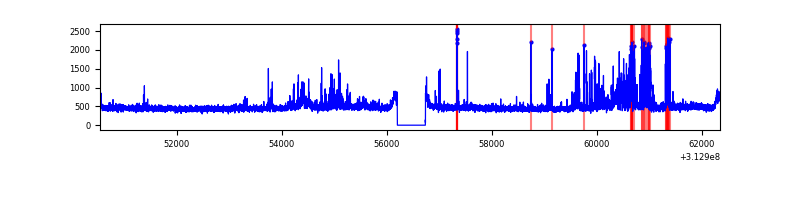 |
| C | 11807 | 11272 | 6 | 6 | 0.05% | 0.05% | 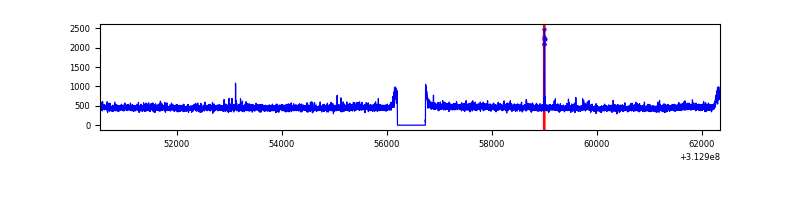 |
| D | 11807 | 11272 | 127 | 127 | 1.08% | 1.13% | 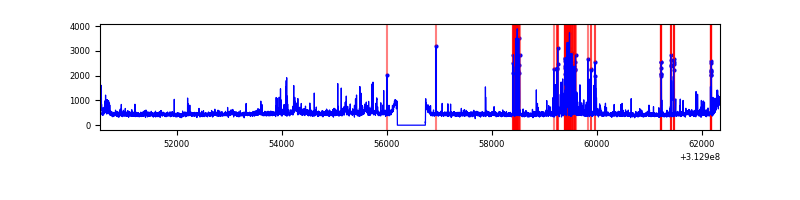 |
Top three noisy pixels from each quadrant. If the there are fewer than three noisy pixels in the level2.evt file, extra rows are filled as -1
| Pixel properties | Quadrant properties | ||||||
|---|---|---|---|---|---|---|---|
| Quadrant | DetID | PixID | Counts | Sigma | Mean | Median | Sigma |
| A | 11 | 47 | 61436 | 229.13 | 1309 | 1280 | 262.5 |
| A | 13 | 254 | 19137 | 68.02 | 1309 | 1280 | 262.5 |
| A | 3 | 137 | 11327 | 38.27 | 1309 | 1280 | 262.5 |
| B | 15 | 33 | 436822 | 1769.48 | 1304 | 1269 | 246.1 |
| B | 15 | 35 | 115342 | 463.43 | 1304 | 1269 | 246.1 |
| B | 0 | 190 | 71543 | 285.5 | 1304 | 1269 | 246.1 |
| C | 14 | 238 | 199594 | 675.83 | 1257 | 1262 | 293.5 |
| C | 10 | 22 | 29983 | 97.87 | 1257 | 1262 | 293.5 |
| C | 3 | 233 | 12766 | 39.2 | 1257 | 1262 | 293.5 |
| D | 1 | 52 | 713603 | 2319.87 | 1266 | 1229 | 307.1 |
| D | 12 | 227 | 215736 | 698.55 | 1266 | 1229 | 307.1 |
| D | 13 | 249 | 64970 | 207.57 | 1266 | 1229 | 307.1 |
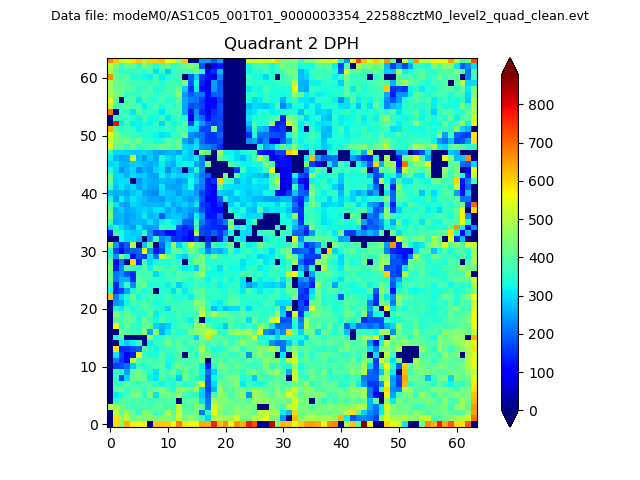
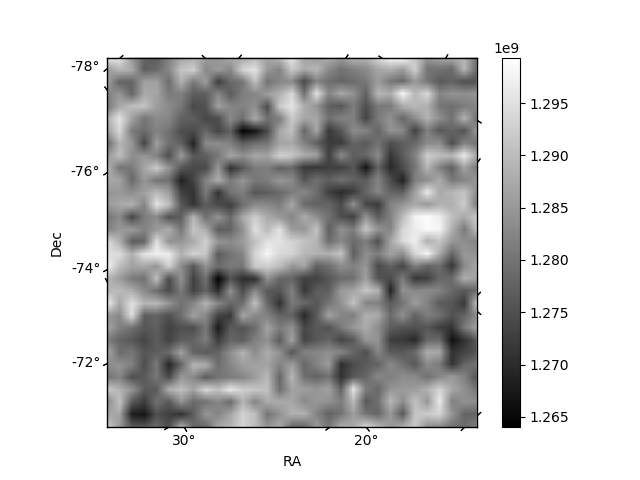
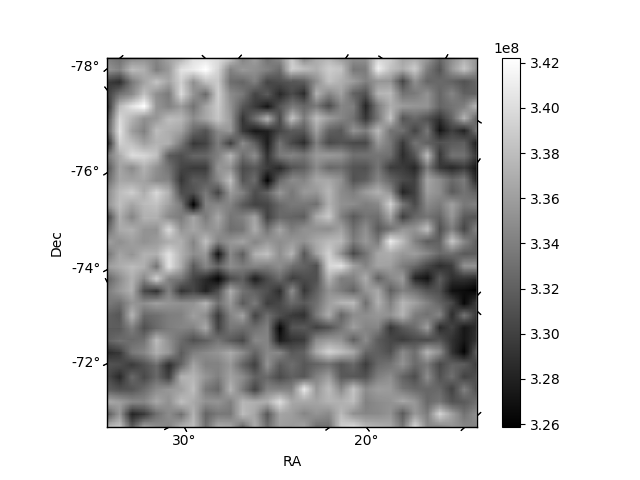
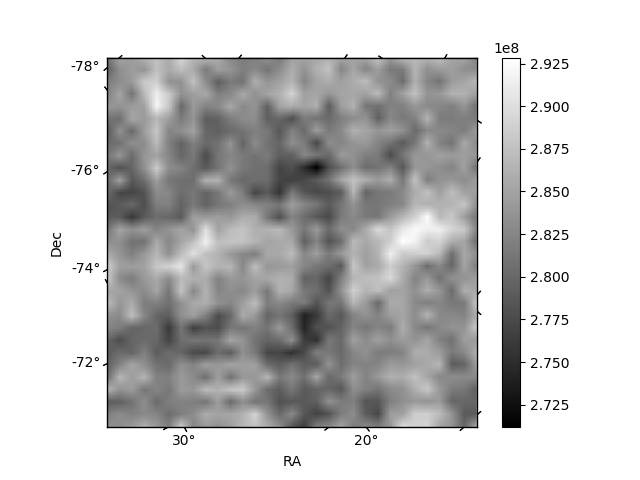
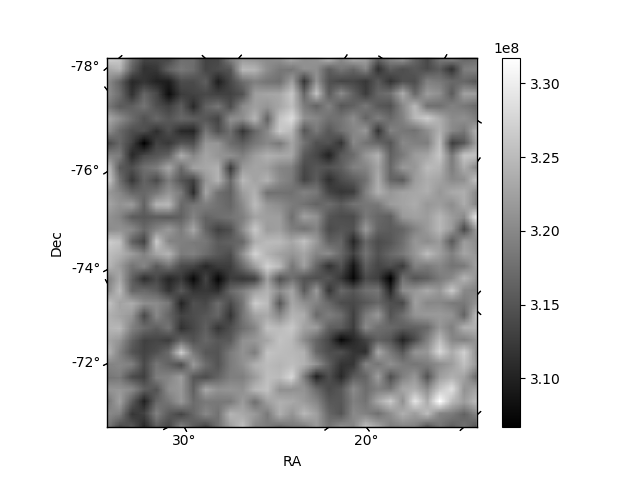
Histogram calculated using DETX and DETY for each event in the final _common_clean file
| Quadrant A | 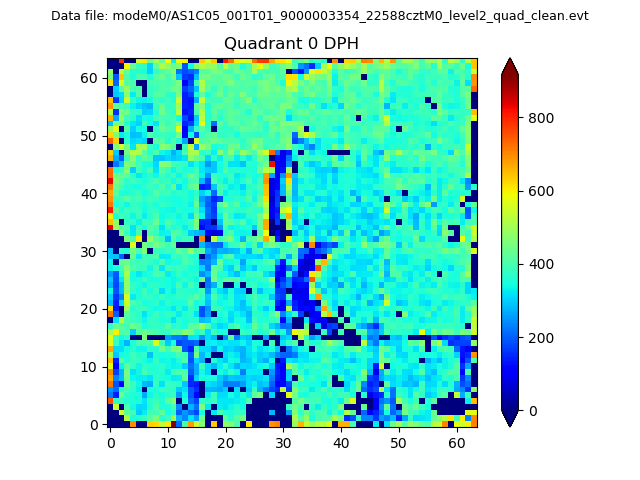 |
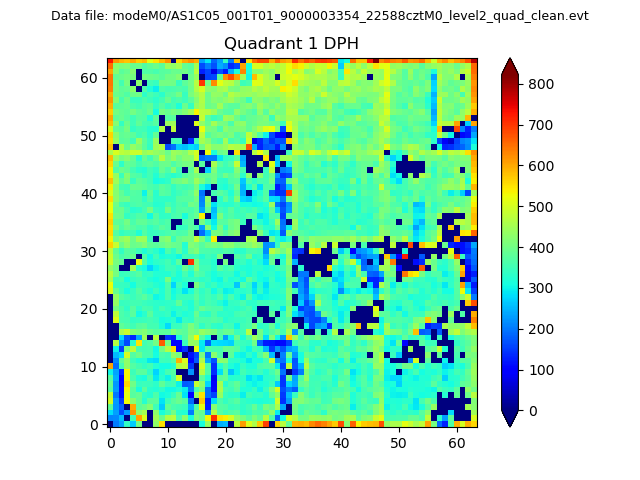 |
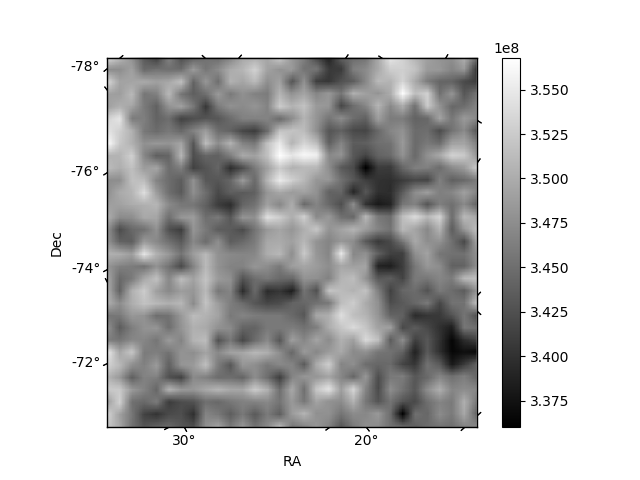
Quadrant B |
|---|---|---|---|
| Quadrant D | 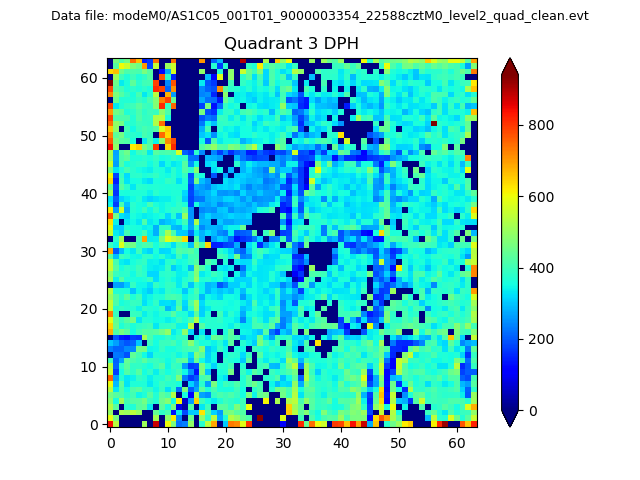 |
 |
Quadrant C |
| Plot type | Count rate plots | Images |
|---|---|---|
| Comparison with Poisson distribution Blue bars denote a histogram of data divided into 1 sec bins. Red curve is a Poisson curve with rate = median count rate of data. |
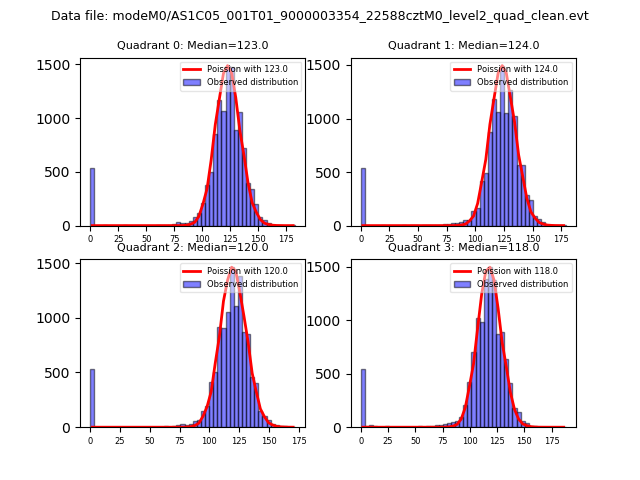 |
 |
| Quadrant-wise count rates Data is divided into 100 sec bins |
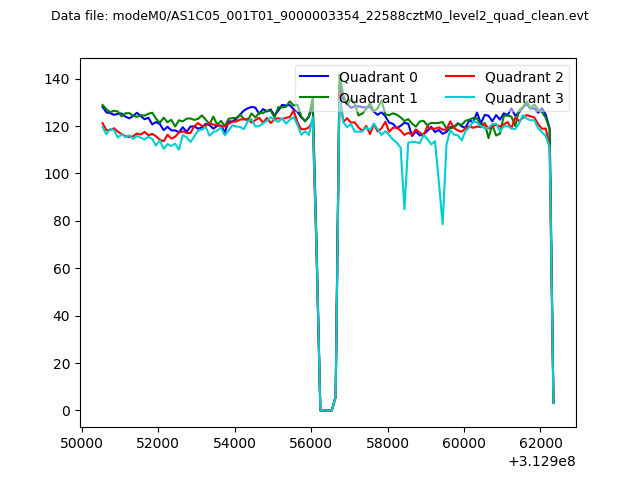 |
|
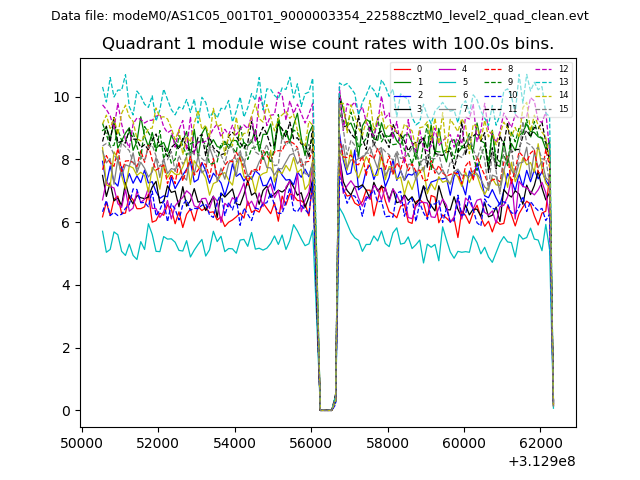
| Module-wise count rates for Quadrant A Data is divided into 100 sec bins |
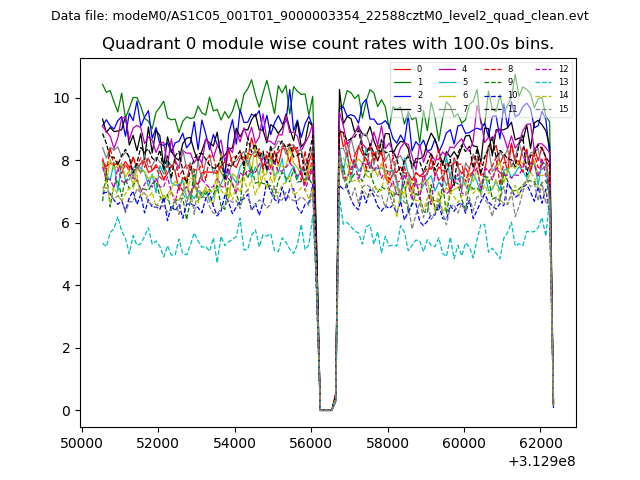 |
 |
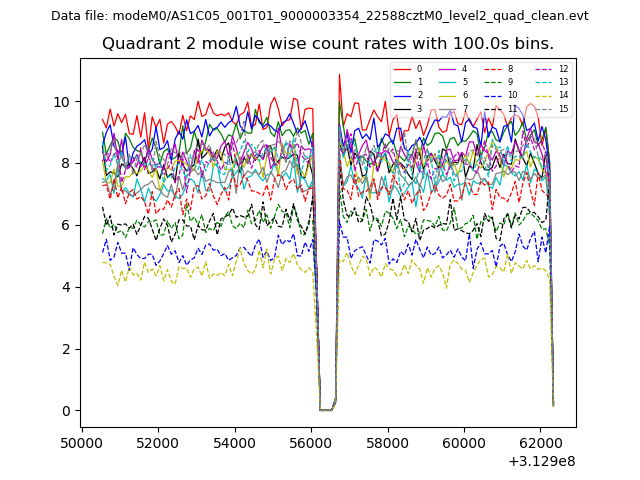
| Module-wise count rates for Quadrant B Data is divided into 100 sec bins |
 |
 |
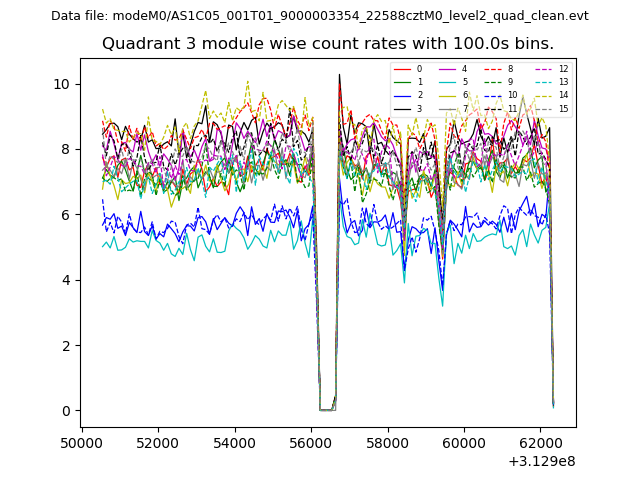
| Module-wise count rates for Quadrant C Data is divided into 100 sec bins |
 |
 |
| Module-wise count rates for Quadrant D Data is divided into 100 sec bins |
 |
 |
| Parameter | Plot |
|---|---|
| CZT HV Monitor | 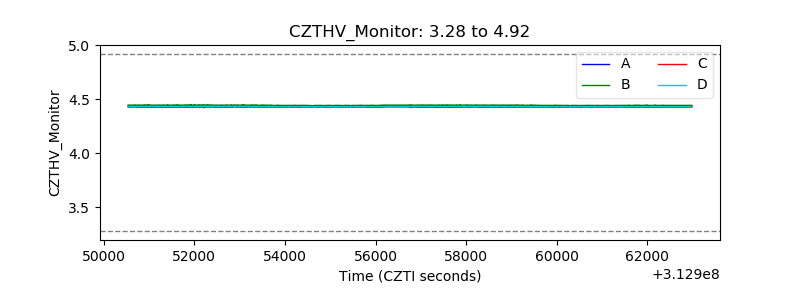 |
| D_VDD | 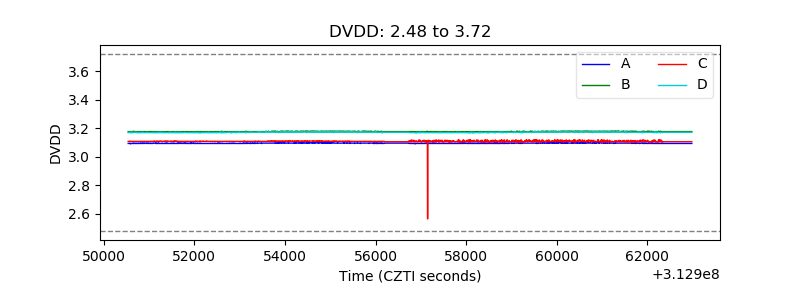 |
| Temperature 1 | 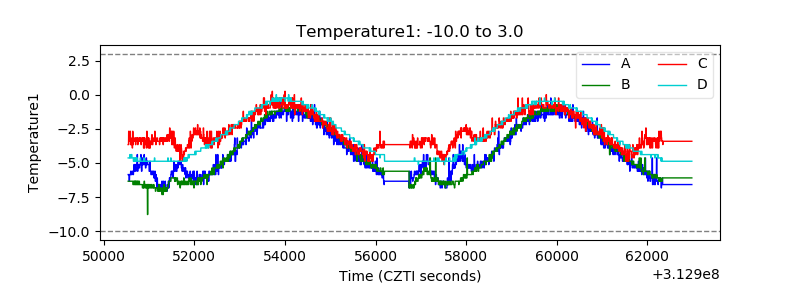 |
| Veto HV Monitor | 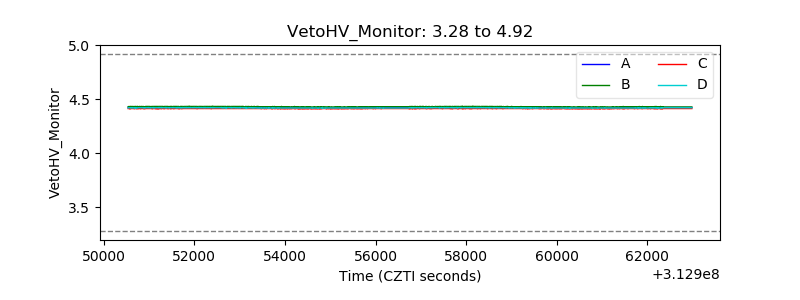 |
| Veto LLD | 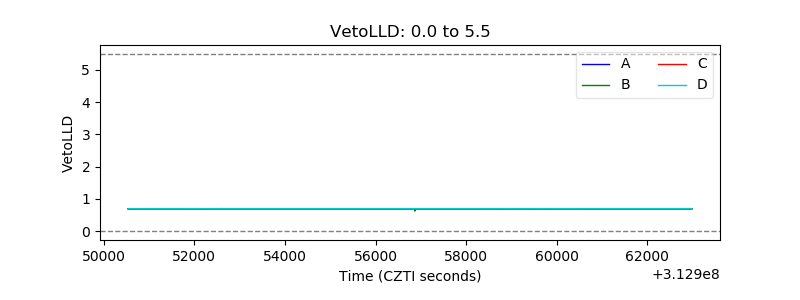 |
| Alpha Counter | 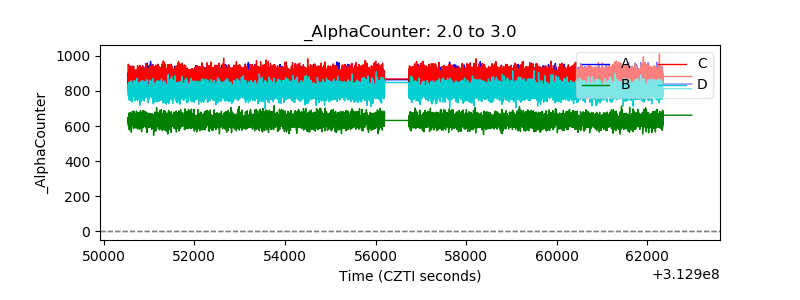 |
| _CPM_Rate | 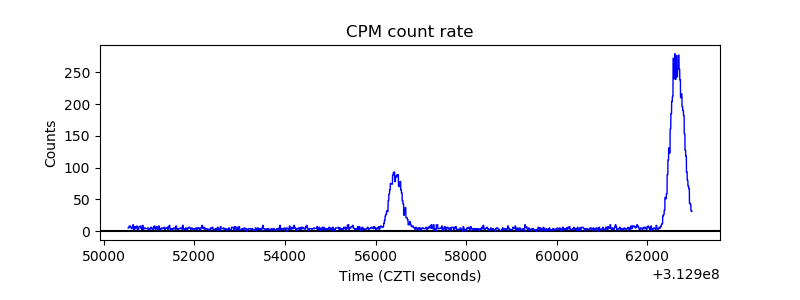 |
| CZT Counter | 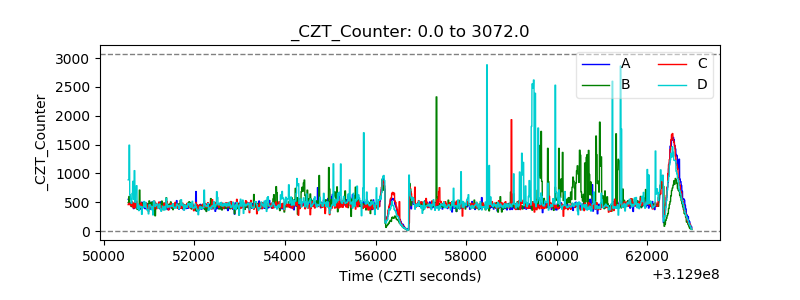 |
| +2.5 Volts monitor | 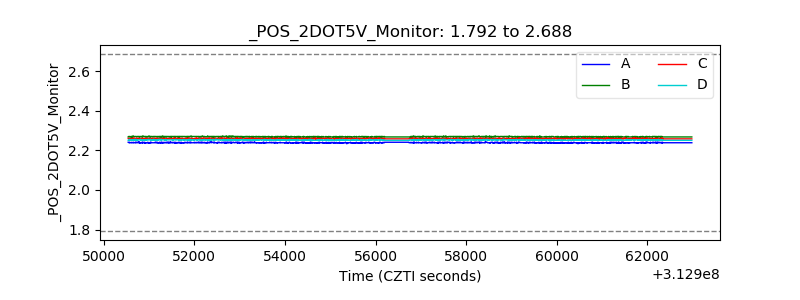 |
| +5 Volts monitor | 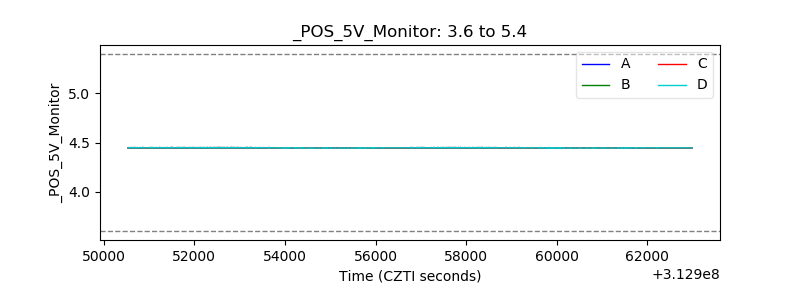 |
| _ROLL_ROT | 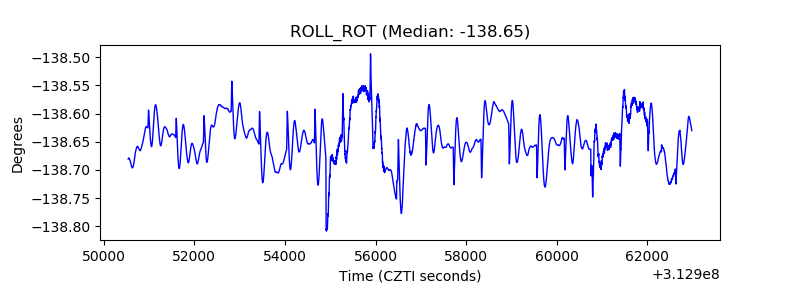 |
| _Roll_DEC | 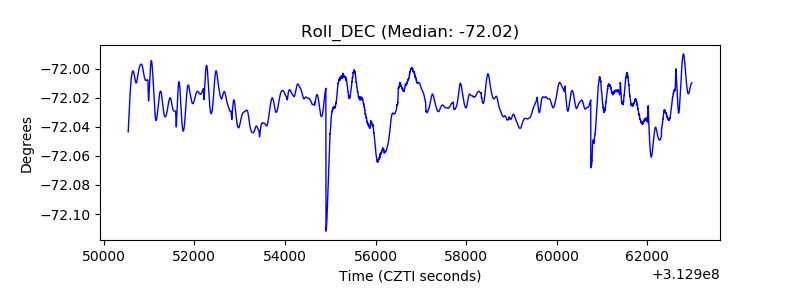 |
| _Roll_RA | 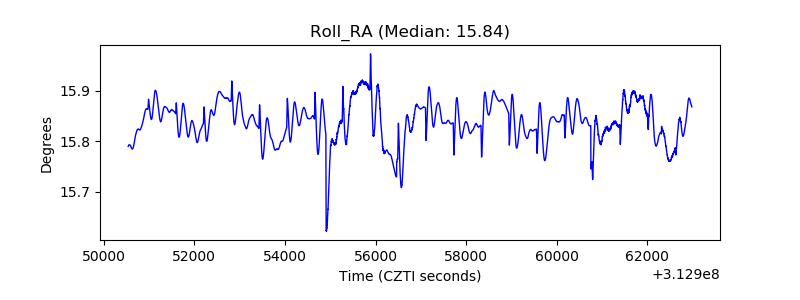 |
| Veto Counter | 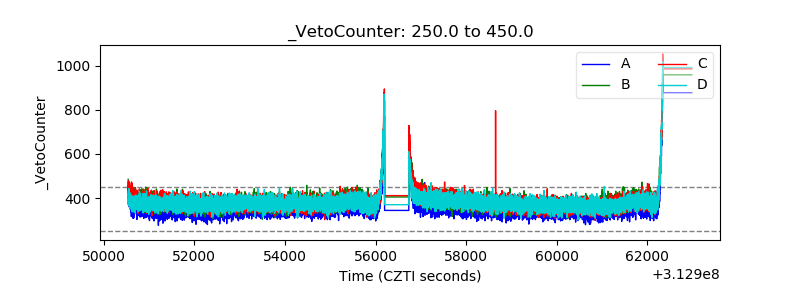 |