| Param | Original file | Final file |
|---|---|---|
| Filename | modeM0/AS1C05_001T01_9000003354_22589cztM0_level2.evt | modeM0/AS1C05_001T01_9000003354_22589cztM0_level2_quad_clean.evt |
| Size (bytes) | 485,115,840 | 130,328,640 |
| Size | 462.6 MB | 124.3 MB |
| Events in quadrant A | 3,182,392 | 882,228 |
| Events in quadrant B | 3,572,251 | 893,704 |
| Events in quadrant C | 3,345,900 | 857,267 |
| Events in quadrant D | 4,125,807 | 836,778 |
| Mode M9 | |||
|---|---|---|---|
| Quadrant | BADHDUFLAG | Total packets | Discarded packets |
| A | 0 | 13 | 0 |
| B | 0 | 14 | 0 |
| C | 0 | 14 | 0 |
| D | 0 | 14 | 0 |
| Mode SS | |||
|---|---|---|---|
| Quadrant | BADHDUFLAG | Total packets | Discarded packets |
| A | 0 | 140 | 0 |
| B | 0 | 140 | 0 |
| C | 0 | 140 | 0 |
| D | 0 | 140 | 0 |
| Mode M0 | |||
|---|---|---|---|
| Quadrant | BADHDUFLAG | Total packets | Discarded packets |
| A | 0 | 13929 | 2 |
| B | 0 | 14915 | 2 |
| C | 0 | 14439 | 2 |
| D | 0 | 16846 | 2 |
| Quadrant | Total seconds | Saturated seconds | Saturation percentage |
|---|---|---|---|
| A | 6850 | 49 | 0.715328% |
| B | 6850 | 106 | 1.547445% |
| C | 6850 | 96 | 1.401460% |
| D | 6850 | 179 | 2.613139% |
Noise dominated data is calculated using 1-second bins in cleaned event files. If a bin has >2000 counts, and if more than 50% of those come from <1% of pixels, then it is considered to be noise-dominated and hence unusable.
| Quadrant | # 1 sec bins | Bins with >0 counts | Bins with >2000 counts | High rate bins dominated by noise | Noise dominated (total time) | Noise dominated (detector-on time) | Marked lightcurve |
|---|---|---|---|---|---|---|---|
| A | 7745 | 6851 | 0 | 0 | 0.00% | 0.00% | 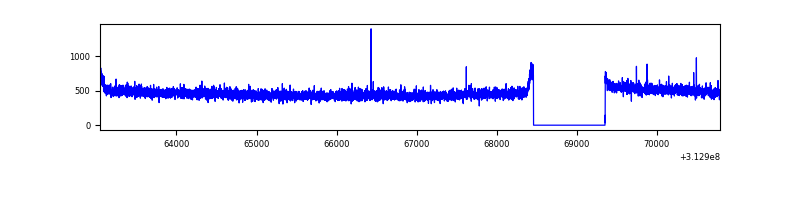 |
| B | 7745 | 6851 | 25 | 25 | 0.32% | 0.36% | 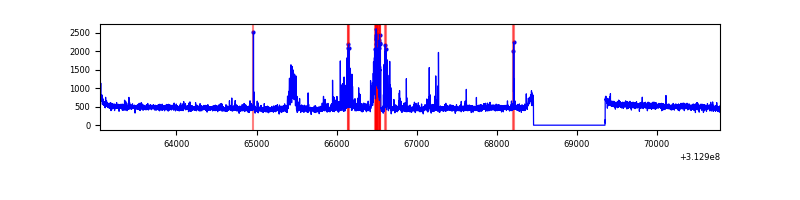 |
| C | 7745 | 6851 | 0 | 0 | 0.00% | 0.00% | 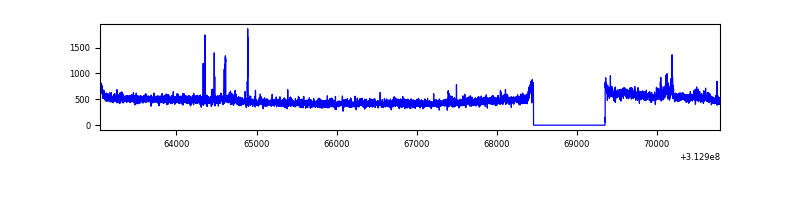 |
| D | 7745 | 6851 | 144 | 144 | 1.86% | 2.10% | 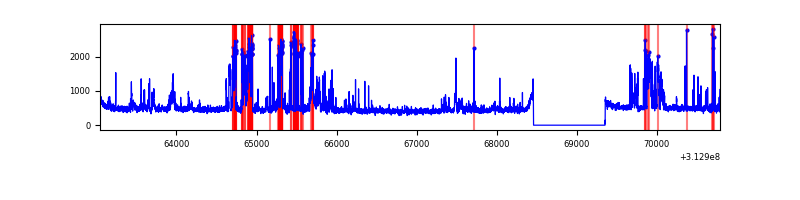 |
Top three noisy pixels from each quadrant. If the there are fewer than three noisy pixels in the level2.evt file, extra rows are filled as -1
| Pixel properties | Quadrant properties | ||||||
|---|---|---|---|---|---|---|---|
| Quadrant | DetID | PixID | Counts | Sigma | Mean | Median | Sigma |
| A | 13 | 254 | 10854 | 60.54 | 823 | 804 | 166.0 |
| A | 11 | 47 | 7413 | 39.81 | 823 | 804 | 166.0 |
| A | 0 | 226 | 7043 | 37.58 | 823 | 804 | 166.0 |
| B | 15 | 33 | 289418 | 1844.93 | 820 | 798 | 156.4 |
| B | 0 | 230 | 23470 | 144.92 | 820 | 798 | 156.4 |
| B | 12 | 111 | 18733 | 114.64 | 820 | 798 | 156.4 |
| C | 14 | 238 | 126192 | 675.36 | 796 | 799 | 185.7 |
| C | 10 | 22 | 67985 | 361.86 | 796 | 799 | 185.7 |
| C | 10 | 222 | 44332 | 234.47 | 796 | 799 | 185.7 |
| D | 1 | 52 | 923594 | 4732.53 | 803 | 778 | 195.0 |
| D | 12 | 227 | 80100 | 406.79 | 803 | 778 | 195.0 |
| D | 13 | 249 | 34924 | 175.11 | 803 | 778 | 195.0 |
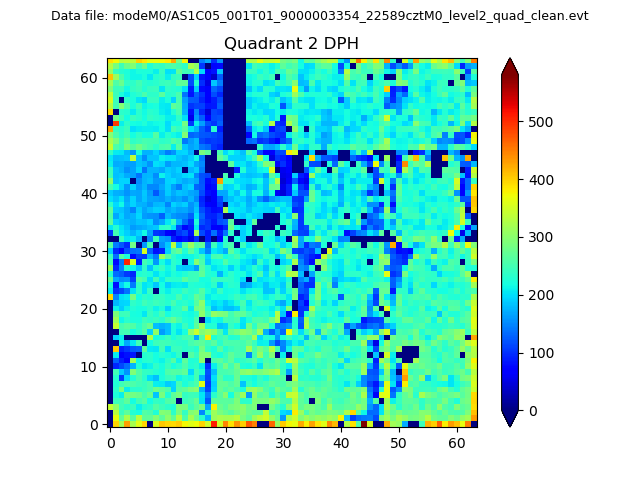
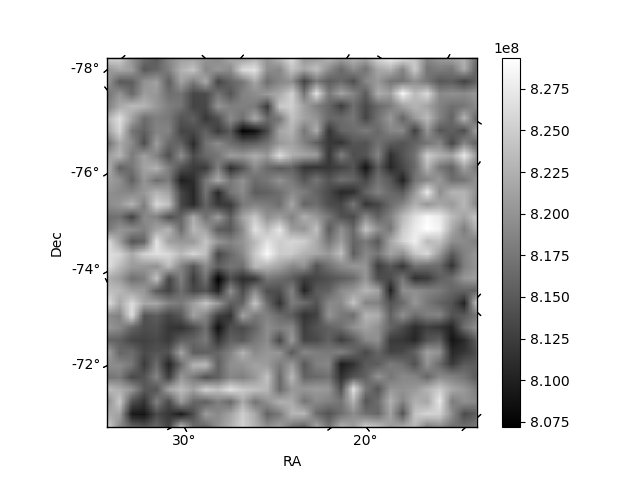
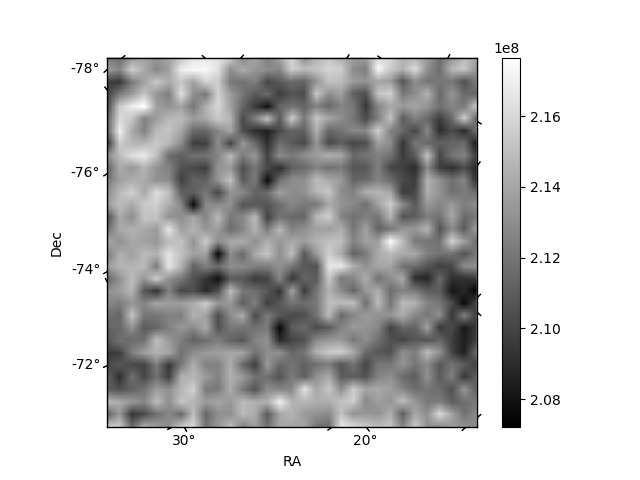
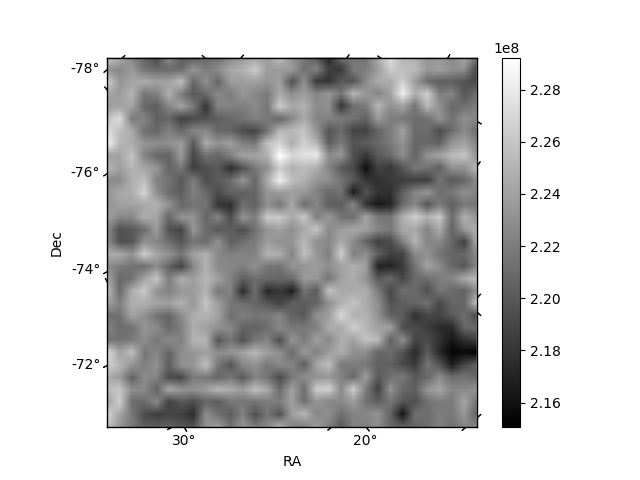
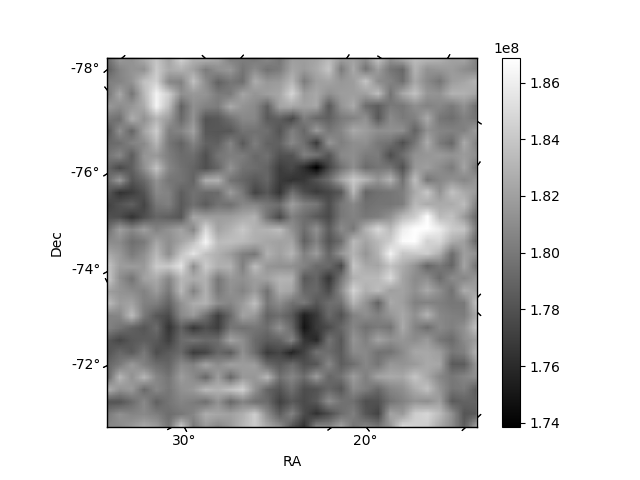
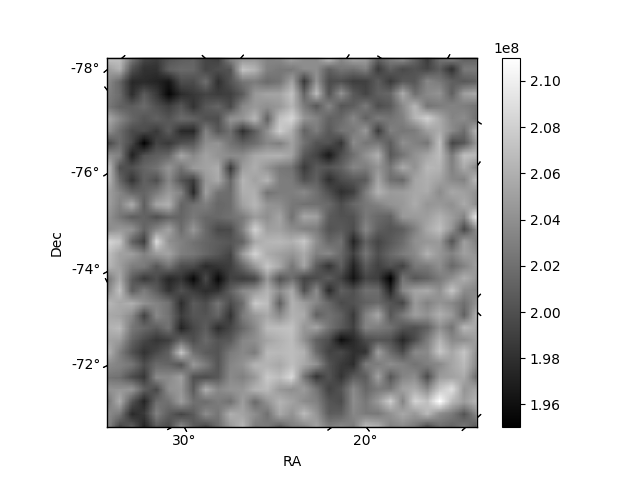
Histogram calculated using DETX and DETY for each event in the final _common_clean file
| Quadrant A | 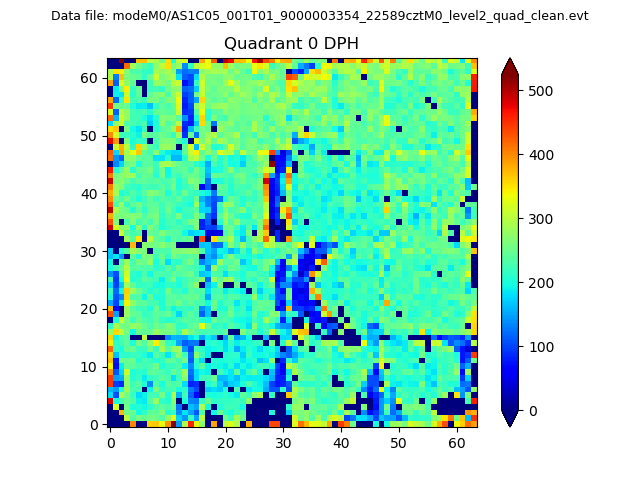 |
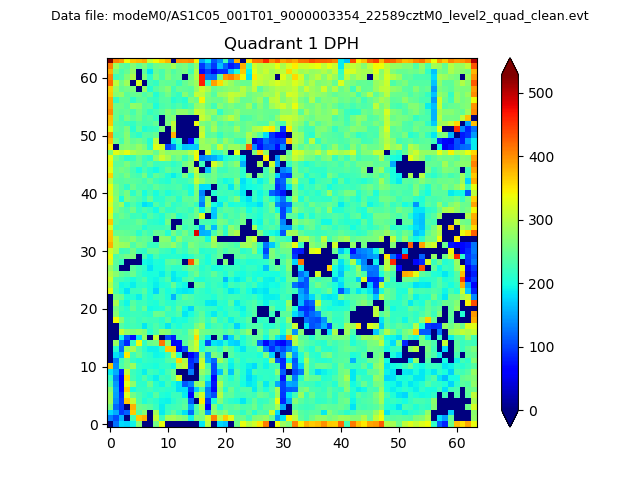 |
Quadrant B |
|---|---|---|---|
| Quadrant D | 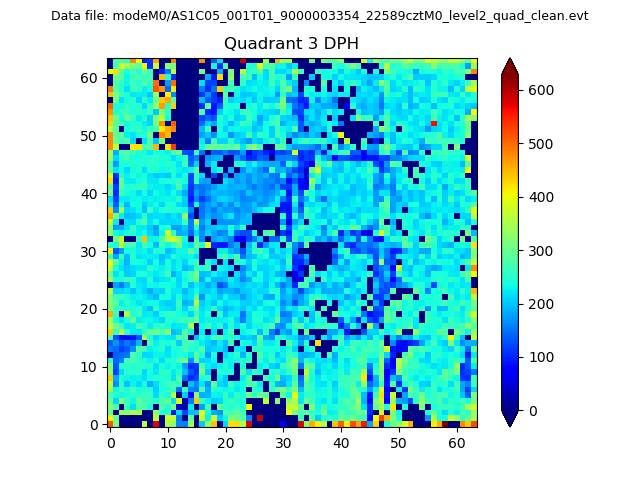 |
 |
Quadrant C |
| Plot type | Count rate plots | Images |
|---|---|---|
| Comparison with Poisson distribution Blue bars denote a histogram of data divided into 1 sec bins. Red curve is a Poisson curve with rate = median count rate of data. |
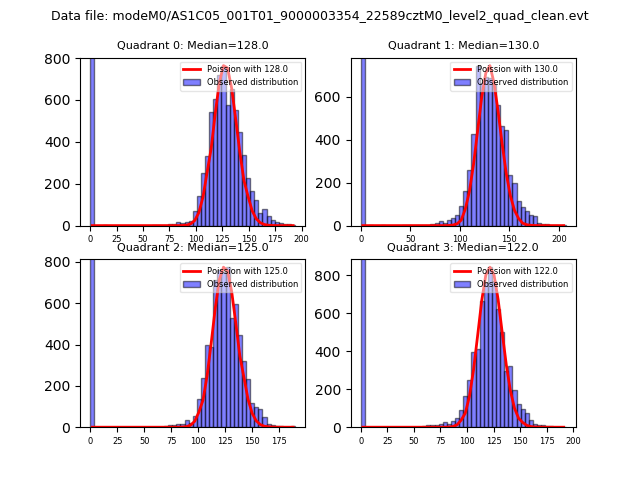 |
 |
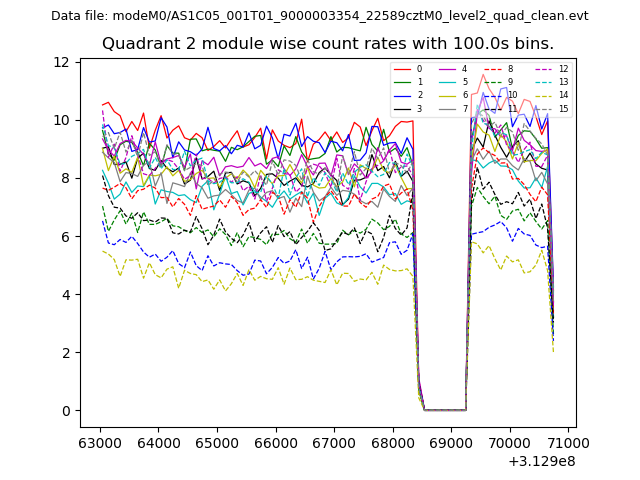
| Quadrant-wise count rates Data is divided into 100 sec bins |
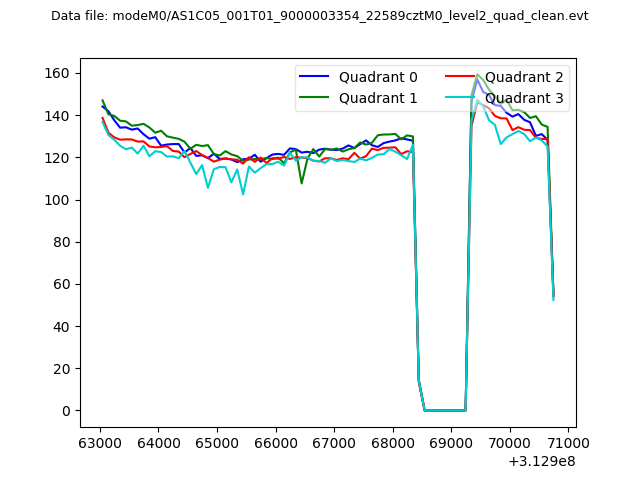 |
|
| Module-wise count rates for Quadrant A Data is divided into 100 sec bins |
 |
 |
| Module-wise count rates for Quadrant B Data is divided into 100 sec bins |
 |
 |
| Module-wise count rates for Quadrant C Data is divided into 100 sec bins |
 |
 |
| Module-wise count rates for Quadrant D Data is divided into 100 sec bins |
 |
 |
| Parameter | Plot |
|---|---|
| CZT HV Monitor | 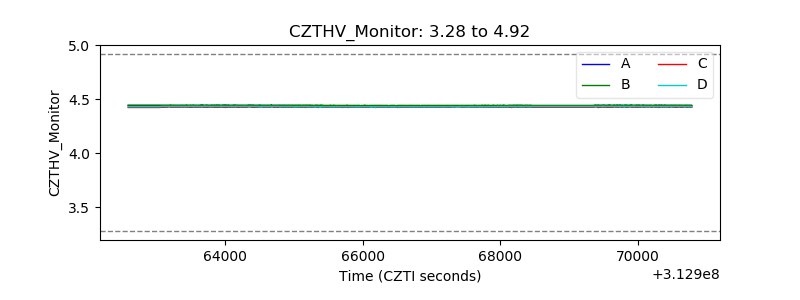 |
| D_VDD | 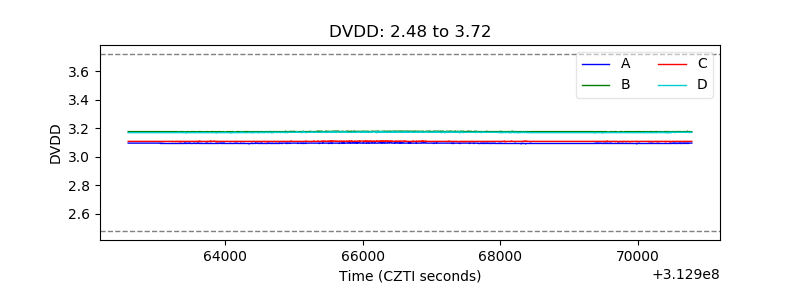 |
| Temperature 1 | 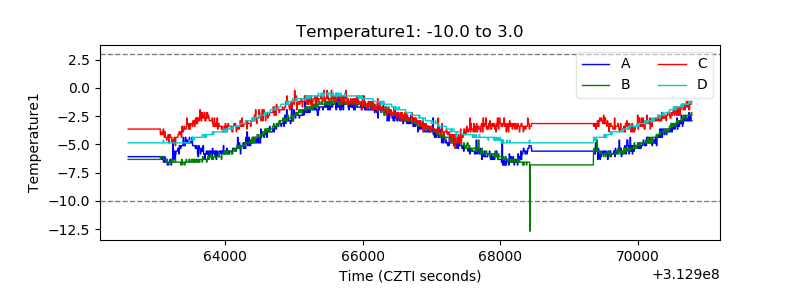 |
| Veto HV Monitor | 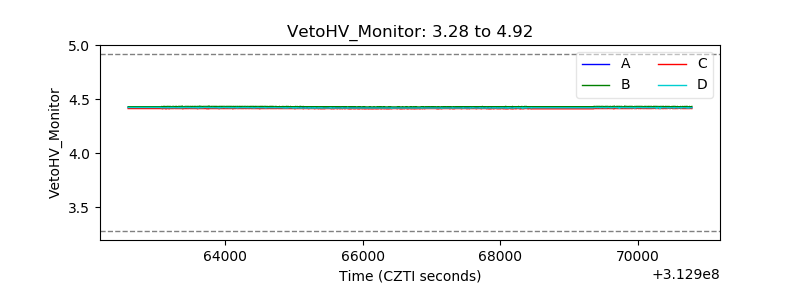 |
| Veto LLD | 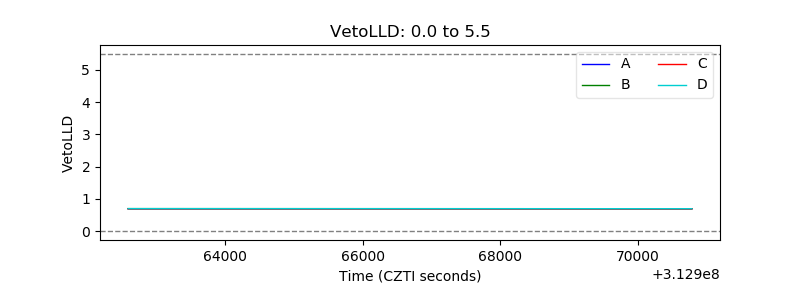 |
| Alpha Counter | 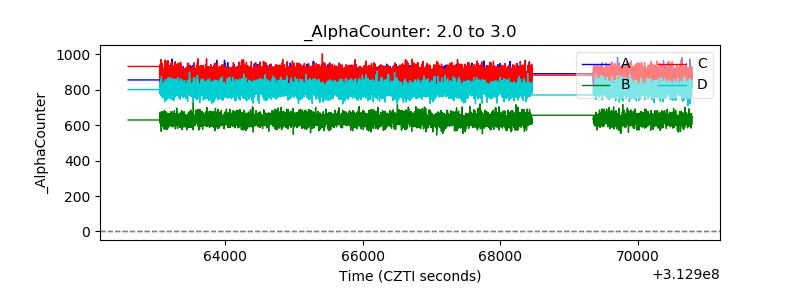 |
| _CPM_Rate | 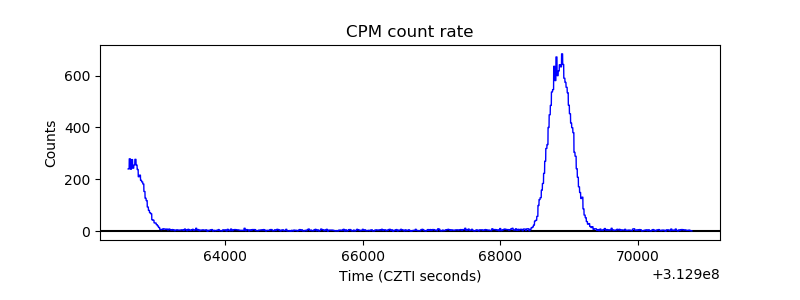 |
| CZT Counter | 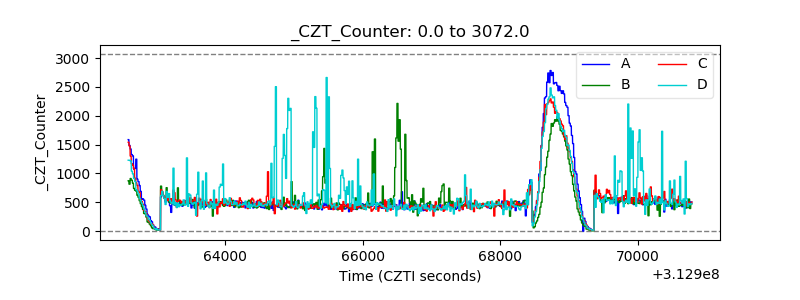 |
| +2.5 Volts monitor |  |
| +5 Volts monitor |  |
| _ROLL_ROT |  |
| _Roll_DEC |  |
| _Roll_RA | 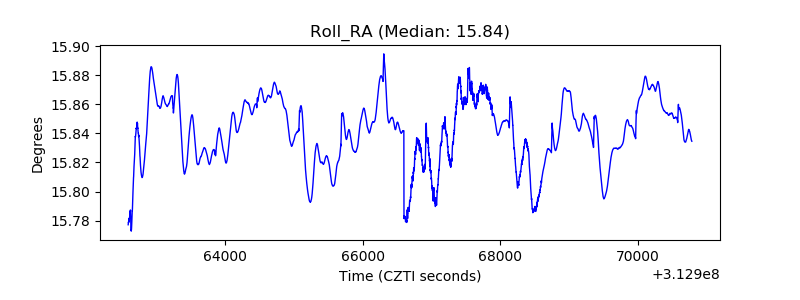 |
| Veto Counter |  |