| Param | Original file | Final file |
|---|---|---|
| Filename | modeM0/AS1C05_001T01_9000003354_22590cztM0_level2.evt | modeM0/AS1C05_001T01_9000003354_22590cztM0_level2_quad_clean.evt |
| Size (bytes) | 477,005,760 | 134,084,160 |
| Size | 454.9 MB | 127.9 MB |
| Events in quadrant A | 3,241,026 | 912,317 |
| Events in quadrant B | 3,549,065 | 924,446 |
| Events in quadrant C | 3,514,401 | 882,980 |
| Events in quadrant D | 3,682,943 | 870,842 |
| Mode M9 | |||
|---|---|---|---|
| Quadrant | BADHDUFLAG | Total packets | Discarded packets |
| A | 0 | 10 | 0 |
| B | 0 | 10 | 0 |
| C | 0 | 10 | 0 |
| D | 0 | 10 | 0 |
| Mode SS | |||
|---|---|---|---|
| Quadrant | BADHDUFLAG | Total packets | Discarded packets |
| A | 0 | 138 | 0 |
| B | 0 | 138 | 0 |
| C | 0 | 138 | 0 |
| D | 0 | 138 | 0 |
| Mode M0 | |||
|---|---|---|---|
| Quadrant | BADHDUFLAG | Total packets | Discarded packets |
| A | 0 | 14054 | 1 |
| B | 0 | 14817 | 1 |
| C | 0 | 14670 | 1 |
| D | 0 | 15577 | 1 |
| Quadrant | Total seconds | Saturated seconds | Saturation percentage |
|---|---|---|---|
| A | 6750 | 61 | 0.903704% |
| B | 6750 | 95 | 1.407407% |
| C | 6750 | 119 | 1.762963% |
| D | 6750 | 106 | 1.570370% |
Noise dominated data is calculated using 1-second bins in cleaned event files. If a bin has >2000 counts, and if more than 50% of those come from <1% of pixels, then it is considered to be noise-dominated and hence unusable.
| Quadrant | # 1 sec bins | Bins with >0 counts | Bins with >2000 counts | High rate bins dominated by noise | Noise dominated (total time) | Noise dominated (detector-on time) | Marked lightcurve |
|---|---|---|---|---|---|---|---|
| A | 7760 | 6751 | 0 | 0 | 0.00% | 0.00% | 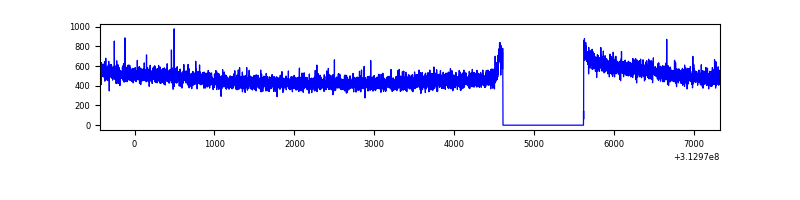 |
| B | 7760 | 6751 | 13 | 13 | 0.17% | 0.19% | 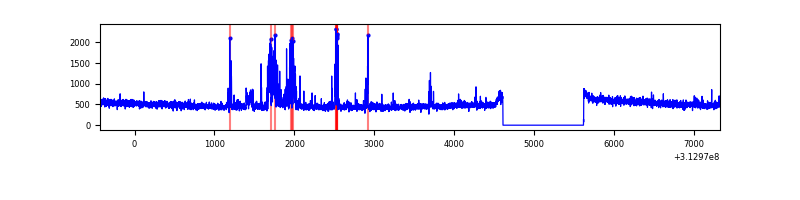 |
| C | 7760 | 6751 | 0 | 0 | 0.00% | 0.00% |  |
| D | 7760 | 6751 | 25 | 25 | 0.32% | 0.37% | 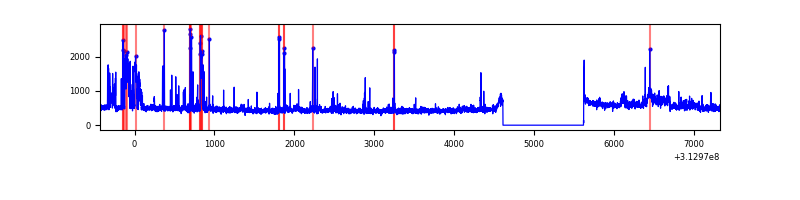 |
Top three noisy pixels from each quadrant. If the there are fewer than three noisy pixels in the level2.evt file, extra rows are filled as -1
| Pixel properties | Quadrant properties | ||||||
|---|---|---|---|---|---|---|---|
| Quadrant | DetID | PixID | Counts | Sigma | Mean | Median | Sigma |
| A | 11 | 47 | 10872 | 59.64 | 838 | 821 | 168.5 |
| A | 13 | 254 | 10620 | 58.14 | 838 | 821 | 168.5 |
| A | 0 | 226 | 7405 | 39.07 | 838 | 821 | 168.5 |
| B | 15 | 33 | 222003 | 1416.43 | 827 | 806 | 156.2 |
| B | 0 | 190 | 42022 | 263.93 | 827 | 806 | 156.2 |
| B | 12 | 111 | 18189 | 111.31 | 827 | 806 | 156.2 |
| C | 10 | 222 | 231217 | 1254.49 | 799 | 805 | 183.7 |
| C | 14 | 238 | 127906 | 692.01 | 799 | 805 | 183.7 |
| C | 10 | 22 | 38586 | 205.7 | 799 | 805 | 183.7 |
| D | 1 | 52 | 421331 | 2143.85 | 816 | 792 | 196.2 |
| D | 12 | 227 | 89981 | 454.67 | 816 | 792 | 196.2 |
| D | 13 | 249 | 52367 | 262.92 | 816 | 792 | 196.2 |
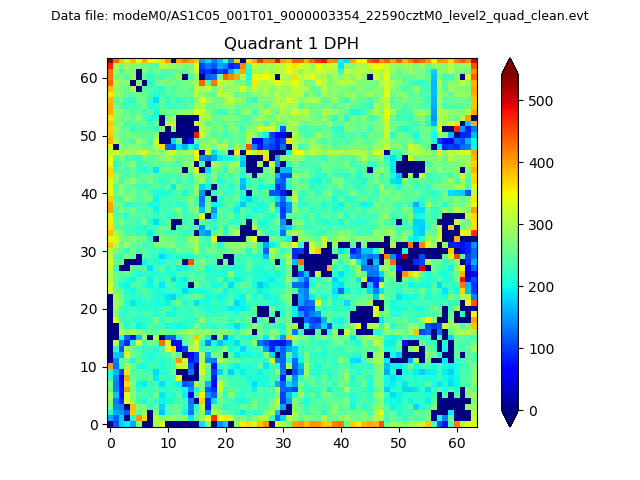
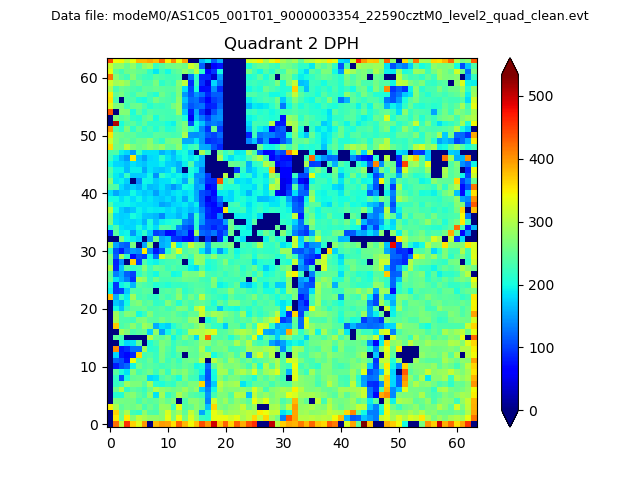
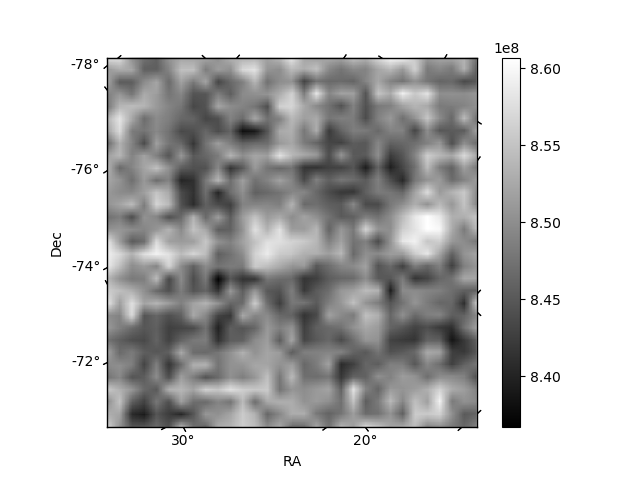
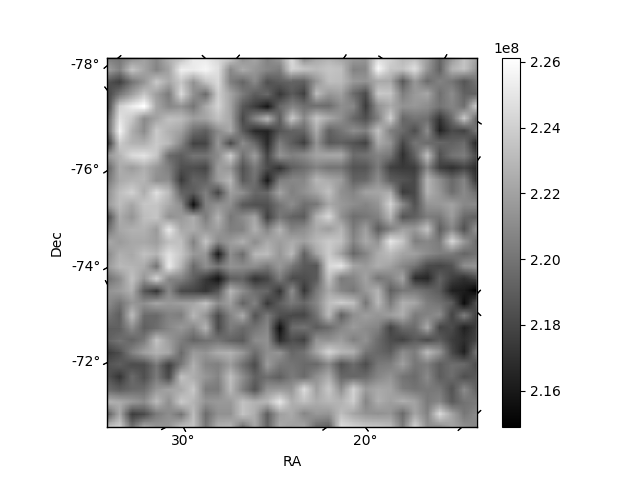
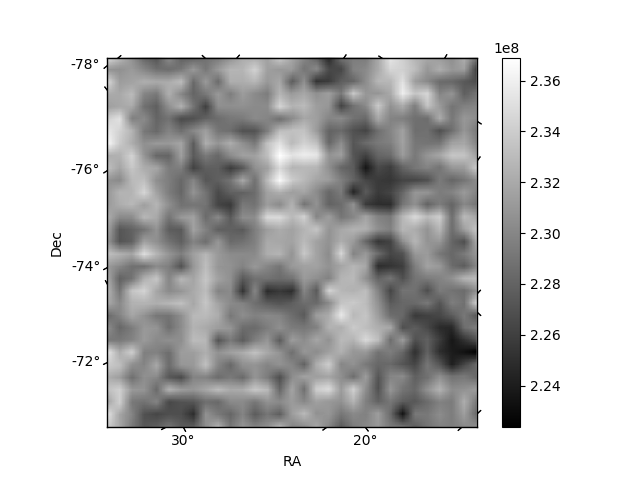
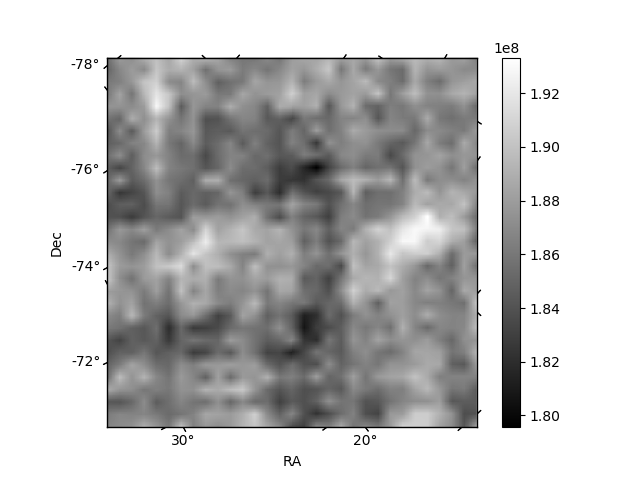
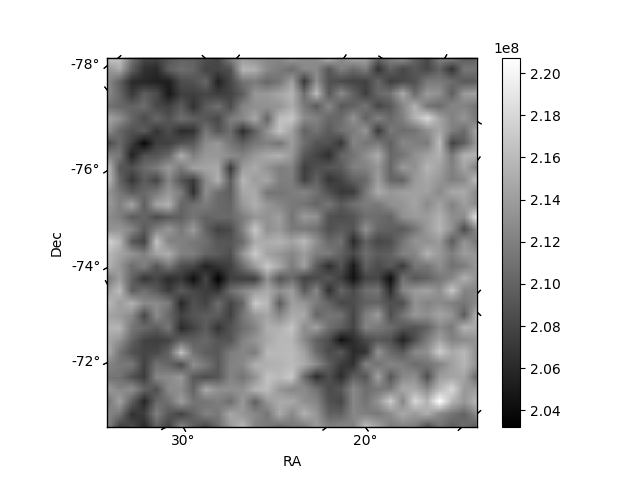
Histogram calculated using DETX and DETY for each event in the final _common_clean file
| Quadrant A | 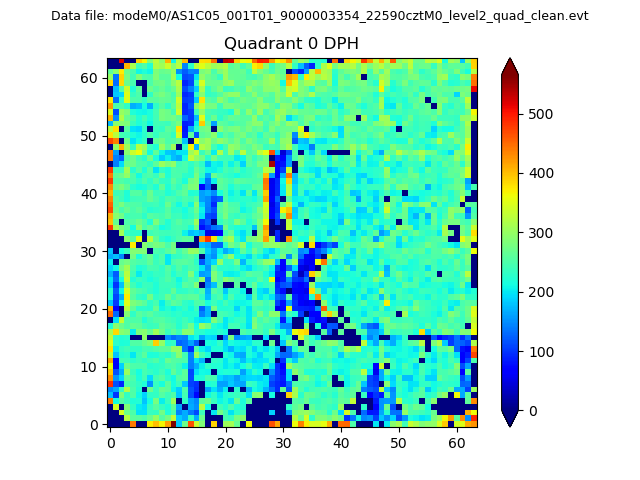 |
 |
Quadrant B |
|---|---|---|---|
| Quadrant D | 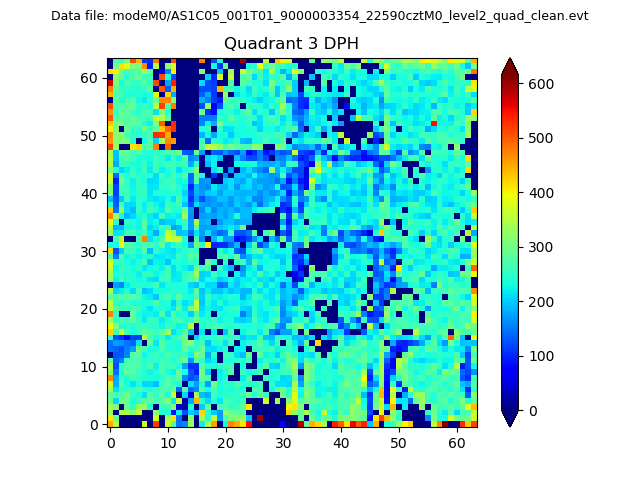 |
 |
Quadrant C |
| Plot type | Count rate plots | Images |
|---|---|---|
| Comparison with Poisson distribution Blue bars denote a histogram of data divided into 1 sec bins. Red curve is a Poisson curve with rate = median count rate of data. |
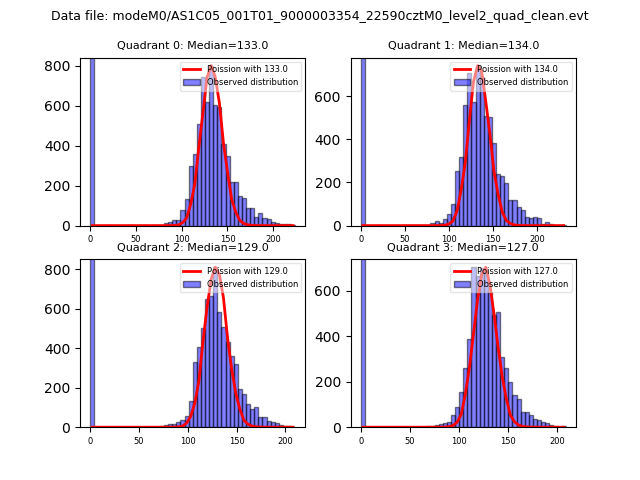 |
 |
| Quadrant-wise count rates Data is divided into 100 sec bins |
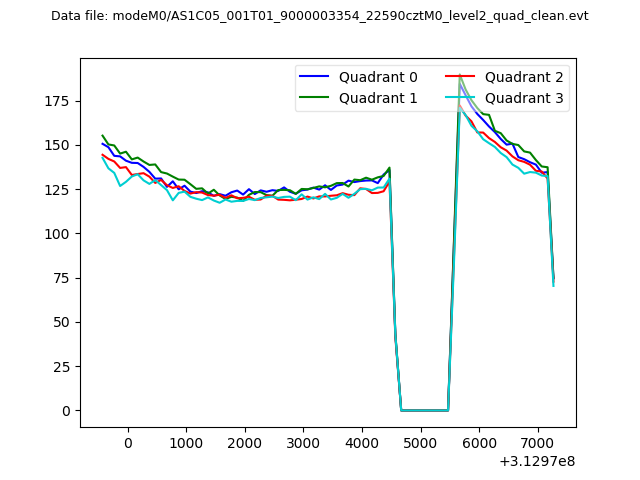 |
|
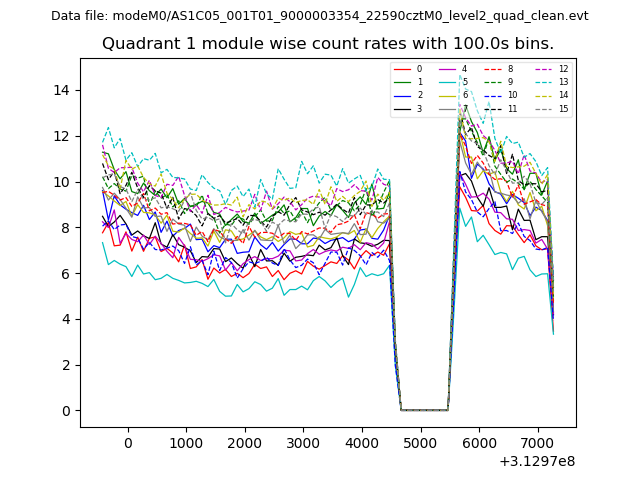
| Module-wise count rates for Quadrant A Data is divided into 100 sec bins |
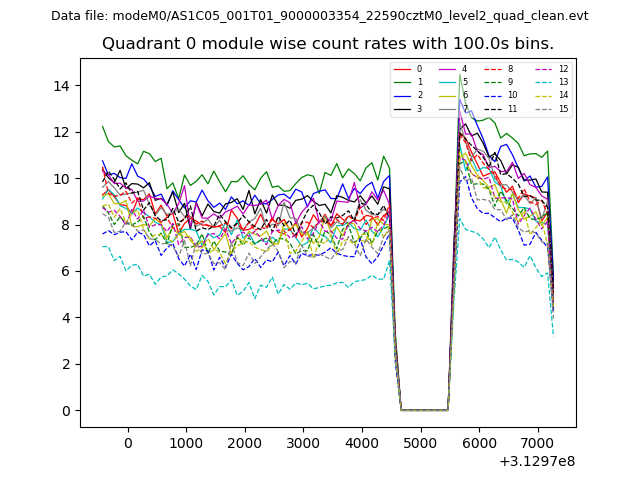 |
 |
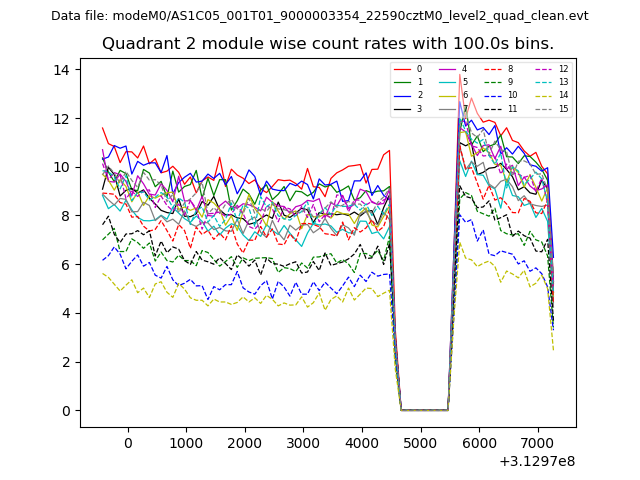
| Module-wise count rates for Quadrant B Data is divided into 100 sec bins |
 |
 |
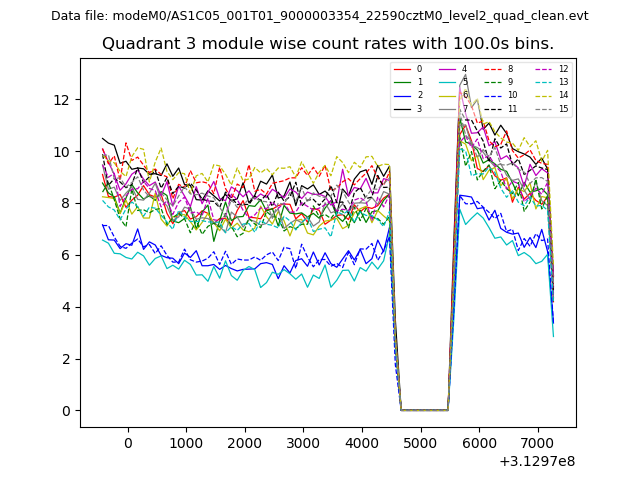
| Module-wise count rates for Quadrant C Data is divided into 100 sec bins |
 |
 |
| Module-wise count rates for Quadrant D Data is divided into 100 sec bins |
 |
 |
| Parameter | Plot |
|---|---|
| CZT HV Monitor | 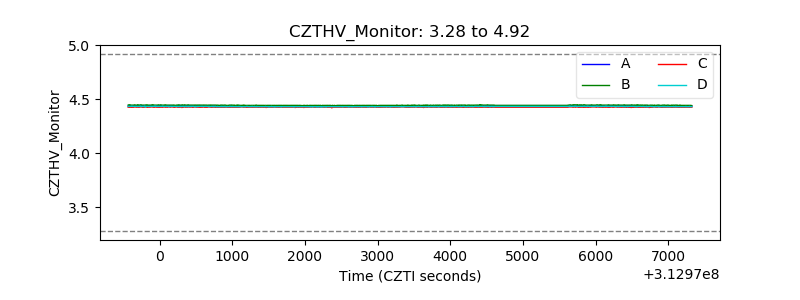 |
| D_VDD | 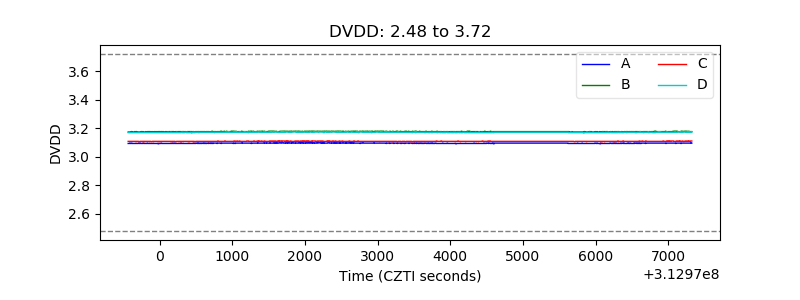 |
| Temperature 1 | 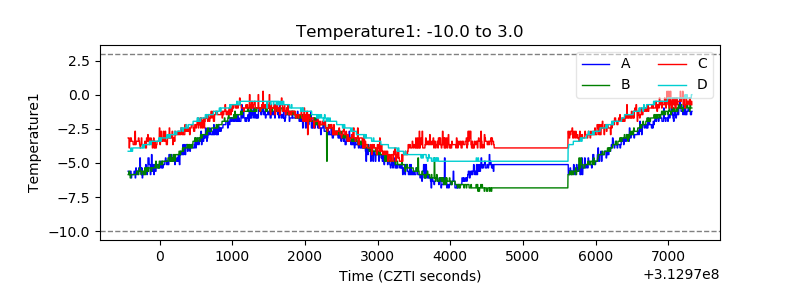 |
| Veto HV Monitor |  |
| Veto LLD | 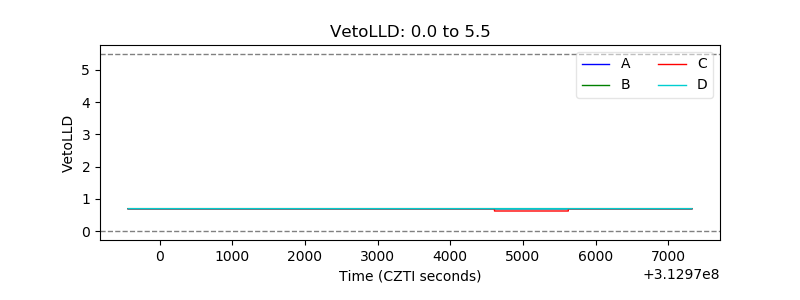 |
| Alpha Counter | 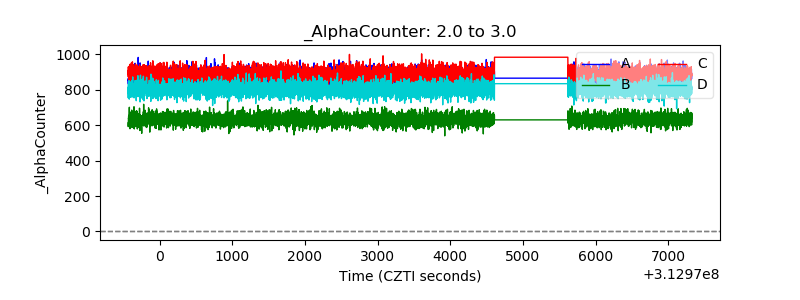 |
| _CPM_Rate | 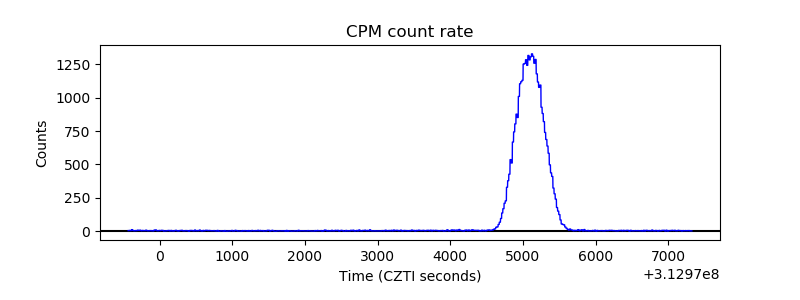 |
| CZT Counter | 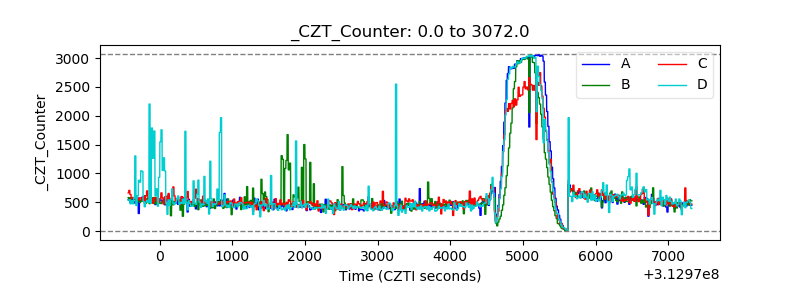 |
| +2.5 Volts monitor |  |
| +5 Volts monitor |  |
| _ROLL_ROT | 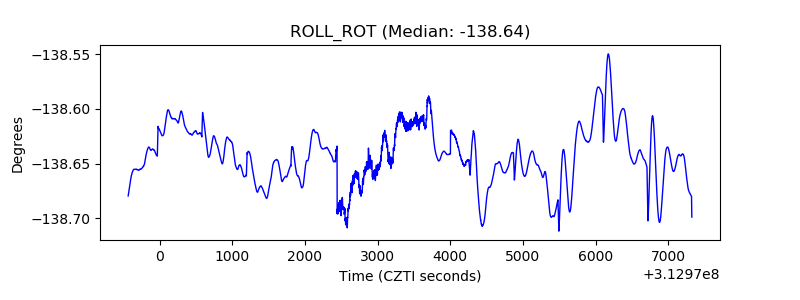 |
| _Roll_DEC | 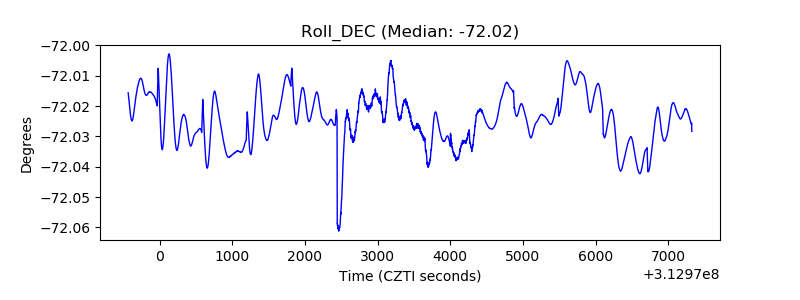 |
| _Roll_RA | 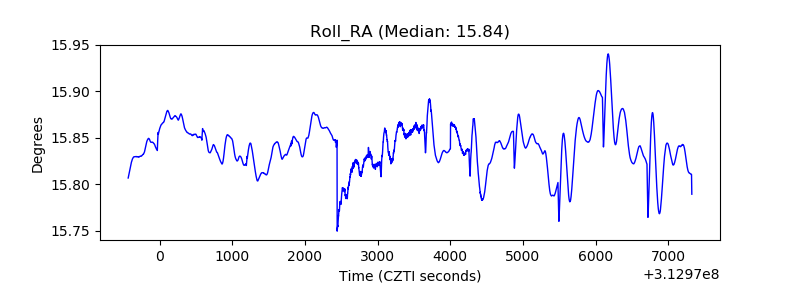 |
| Veto Counter | 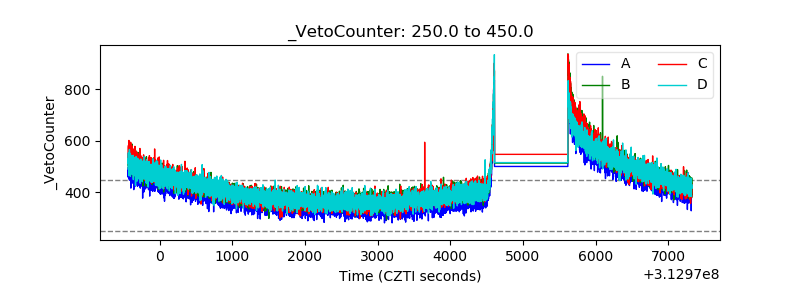 |