| Param | Original file | Final file |
|---|---|---|
| Filename | modeM0/AS1C05_001T01_9000003354_22593cztM0_level2.evt | modeM0/AS1C05_001T01_9000003354_22593cztM0_level2_quad_clean.evt |
| Size (bytes) | 478,575,360 | 130,230,720 |
| Size | 456.4 MB | 124.2 MB |
| Events in quadrant A | 3,033,530 | 913,031 |
| Events in quadrant B | 3,673,028 | 910,268 |
| Events in quadrant C | 3,106,124 | 861,465 |
| Events in quadrant D | 4,274,618 | 841,479 |
| Mode M9 | |||
|---|---|---|---|
| Quadrant | BADHDUFLAG | Total packets | Discarded packets |
| A | 0 | 12 | 0 |
| B | 0 | 12 | 0 |
| C | 0 | 12 | 0 |
| D | 0 | 12 | 0 |
| Mode SS | |||
|---|---|---|---|
| Quadrant | BADHDUFLAG | Total packets | Discarded packets |
| A | 0 | 122 | 0 |
| B | 0 | 122 | 0 |
| C | 0 | 122 | 0 |
| D | 0 | 122 | 0 |
| Mode M0 | |||
|---|---|---|---|
| Quadrant | BADHDUFLAG | Total packets | Discarded packets |
| A | 0 | 12926 | 1 |
| B | 0 | 14920 | 1 |
| C | 0 | 13010 | 1 |
| D | 0 | 16712 | 1 |
| Quadrant | Total seconds | Saturated seconds | Saturation percentage |
|---|---|---|---|
| A | 5988 | 43 | 0.718103% |
| B | 5989 | 143 | 2.387711% |
| C | 5989 | 78 | 1.302388% |
| D | 5988 | 238 | 3.974616% |
Noise dominated data is calculated using 1-second bins in cleaned event files. If a bin has >2000 counts, and if more than 50% of those come from <1% of pixels, then it is considered to be noise-dominated and hence unusable.
| Quadrant | # 1 sec bins | Bins with >0 counts | Bins with >2000 counts | High rate bins dominated by noise | Noise dominated (total time) | Noise dominated (detector-on time) | Marked lightcurve |
|---|---|---|---|---|---|---|---|
| A | 7243 | 5989 | 0 | 0 | 0.00% | 0.00% | 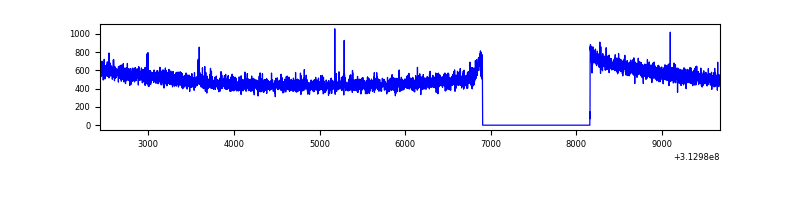 |
| B | 7244 | 5990 | 49 | 49 | 0.68% | 0.82% | 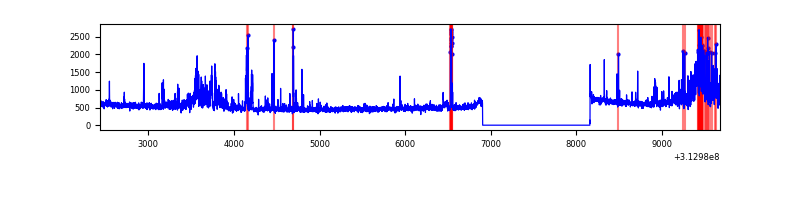 |
| C | 7244 | 5990 | 0 | 0 | 0.00% | 0.00% | 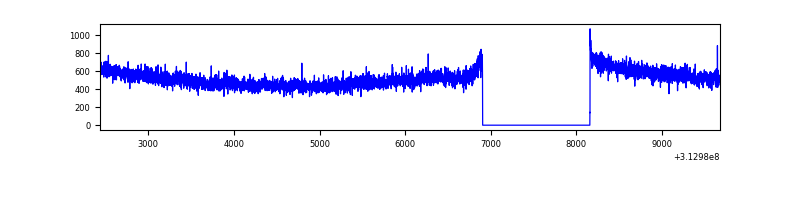 |
| D | 7243 | 5989 | 208 | 208 | 2.87% | 3.47% | 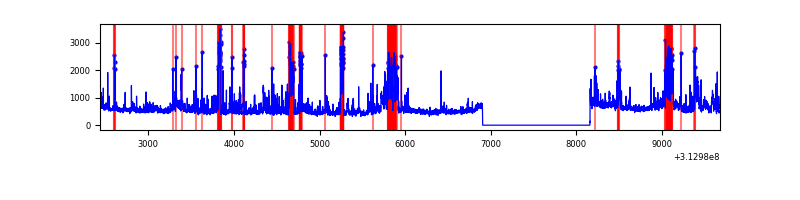 |
Top three noisy pixels from each quadrant. If the there are fewer than three noisy pixels in the level2.evt file, extra rows are filled as -1
| Pixel properties | Quadrant properties | ||||||
|---|---|---|---|---|---|---|---|
| Quadrant | DetID | PixID | Counts | Sigma | Mean | Median | Sigma |
| A | 13 | 254 | 10751 | 64.49 | 785 | 773 | 154.7 |
| A | 0 | 226 | 6913 | 39.68 | 785 | 773 | 154.7 |
| A | 3 | 137 | 5927 | 33.31 | 785 | 773 | 154.7 |
| B | 15 | 33 | 245452 | 1730.23 | 771 | 755 | 141.4 |
| B | 15 | 35 | 121290 | 852.29 | 771 | 755 | 141.4 |
| B | 0 | 229 | 103643 | 727.51 | 771 | 755 | 141.4 |
| C | 10 | 222 | 123756 | 734.9 | 733 | 738 | 167.4 |
| C | 14 | 238 | 119169 | 707.49 | 733 | 738 | 167.4 |
| C | 13 | 61 | 5251 | 26.96 | 733 | 738 | 167.4 |
| D | 1 | 52 | 1064849 | 5946.66 | 744 | 723 | 178.9 |
| D | 15 | 0 | 96899 | 537.46 | 744 | 723 | 178.9 |
| D | 12 | 227 | 87593 | 485.45 | 744 | 723 | 178.9 |
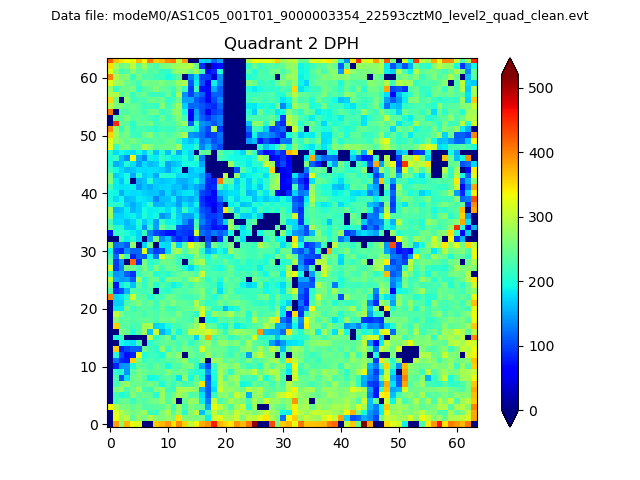
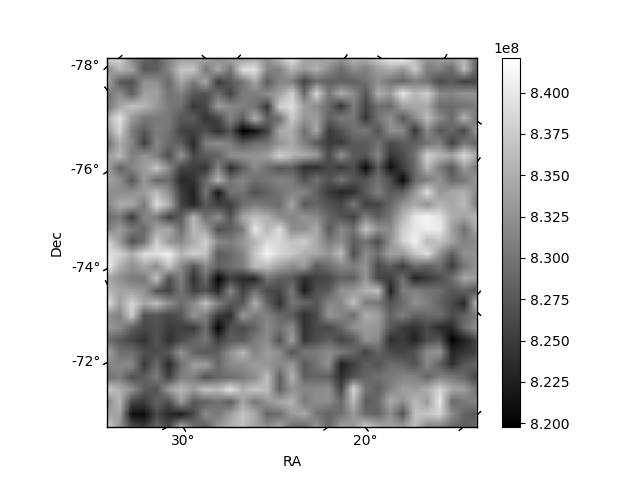
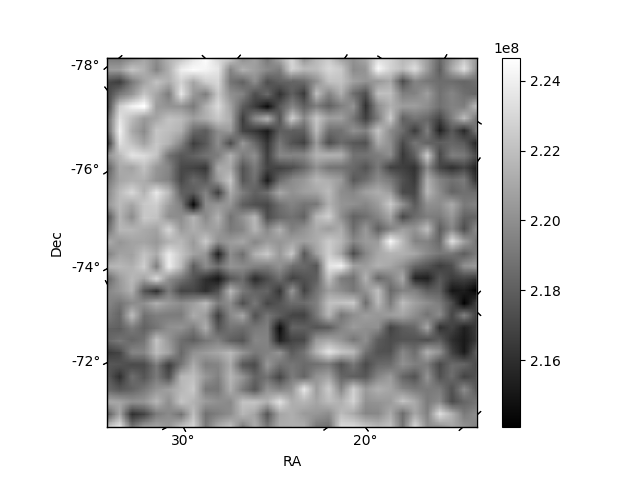
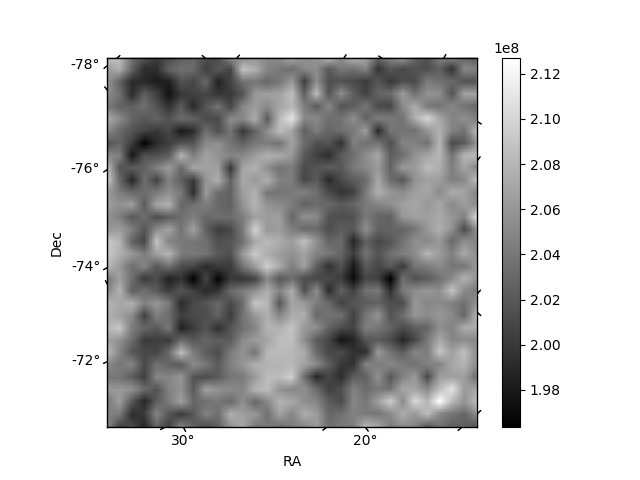
Histogram calculated using DETX and DETY for each event in the final _common_clean file
| Quadrant A | 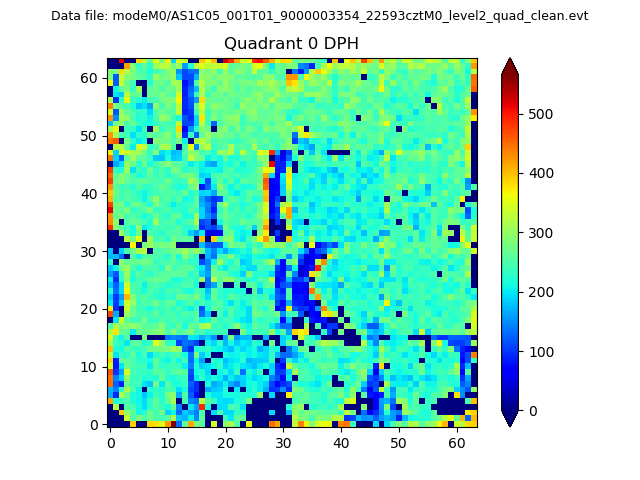 |
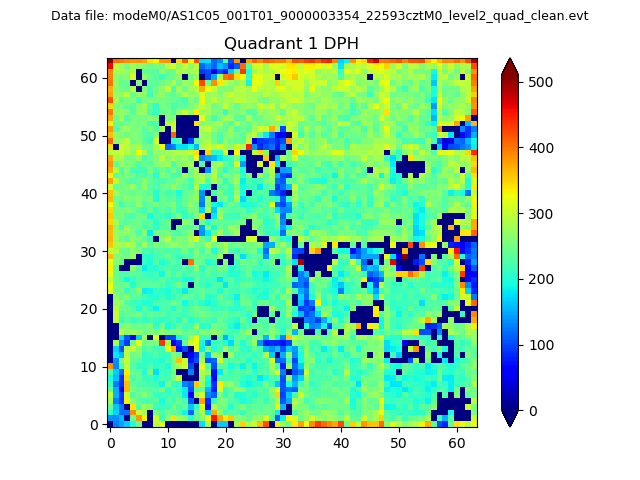 |
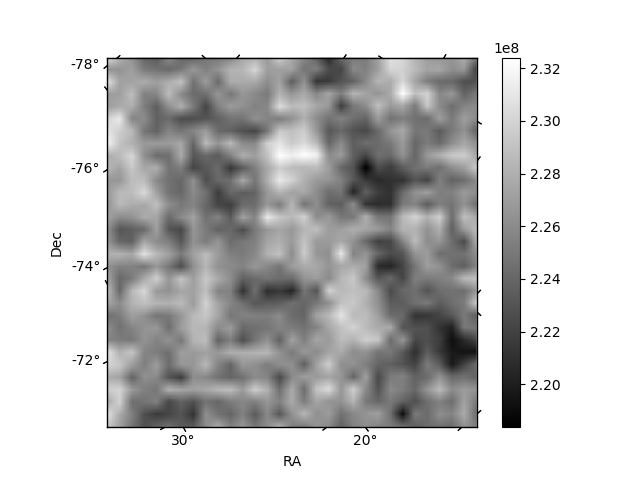
Quadrant B |
|---|---|---|---|
| Quadrant D | 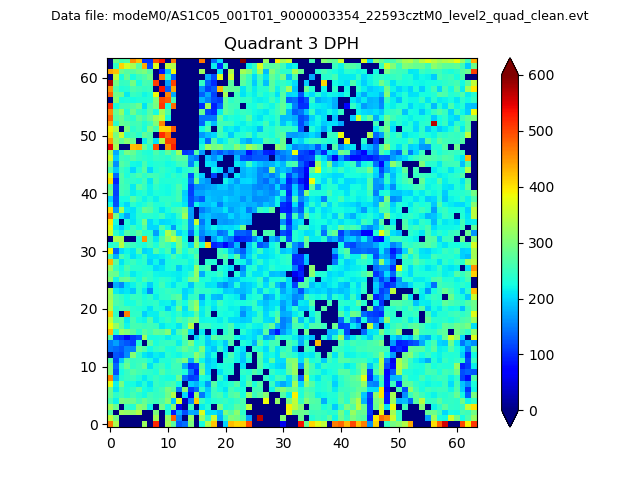 |
 |
Quadrant C |
| Plot type | Count rate plots | Images |
|---|---|---|
| Comparison with Poisson distribution Blue bars denote a histogram of data divided into 1 sec bins. Red curve is a Poisson curve with rate = median count rate of data. |
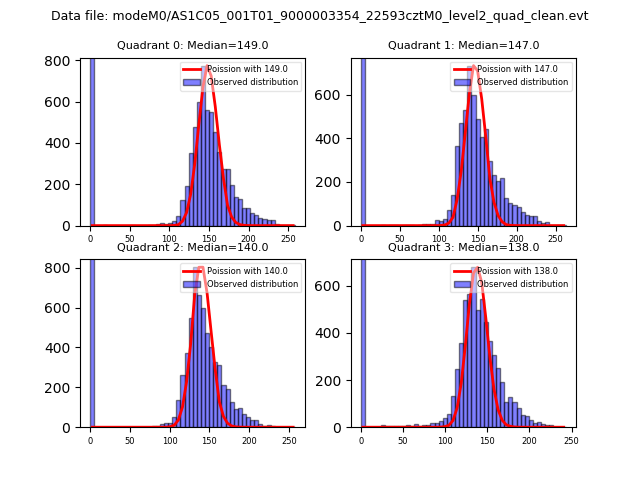 |
 |
| Quadrant-wise count rates Data is divided into 100 sec bins |
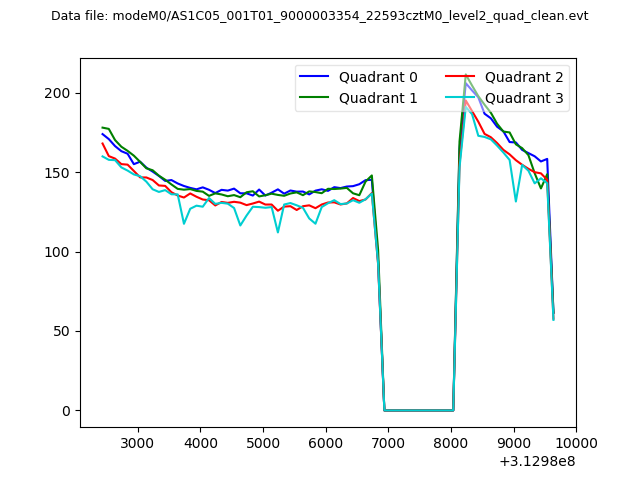 |
|
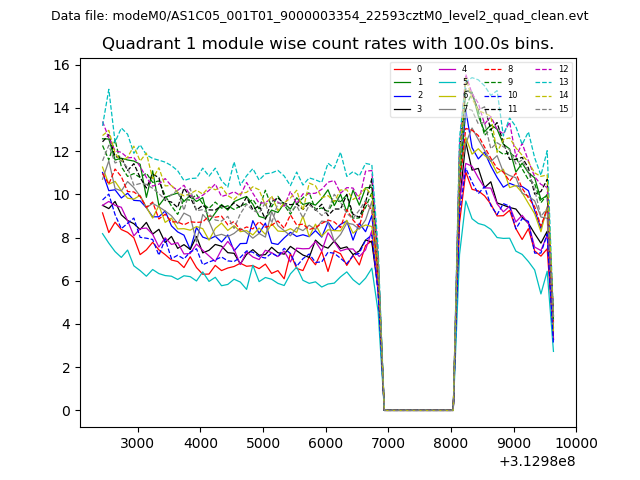
| Module-wise count rates for Quadrant A Data is divided into 100 sec bins |
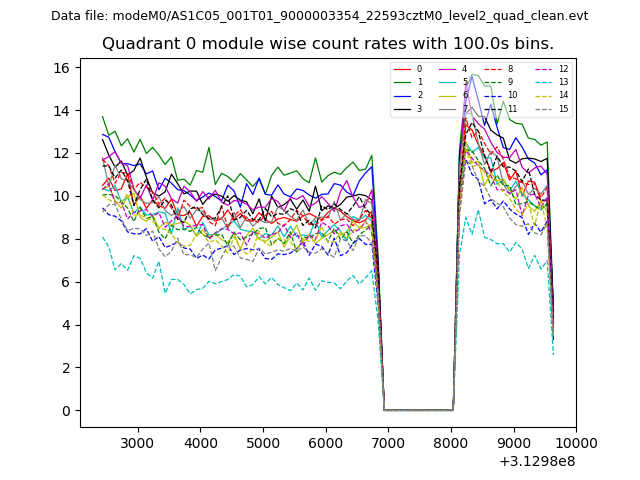 |
 |
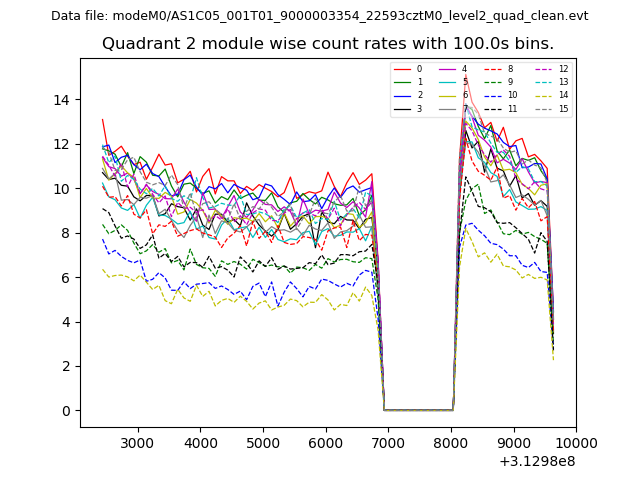
| Module-wise count rates for Quadrant B Data is divided into 100 sec bins |
 |
 |
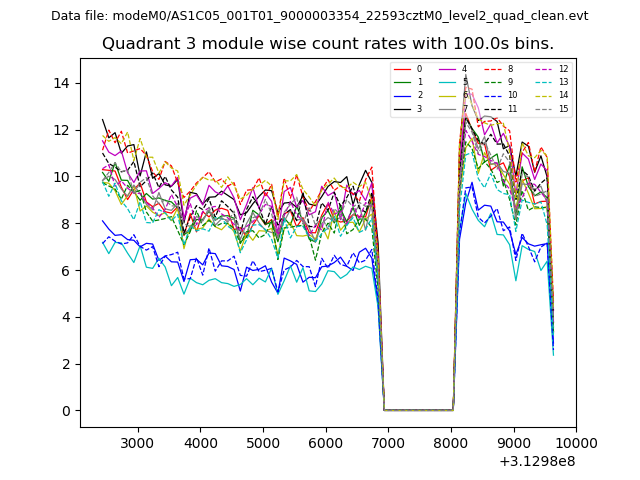
| Module-wise count rates for Quadrant C Data is divided into 100 sec bins |
 |
 |
| Module-wise count rates for Quadrant D Data is divided into 100 sec bins |
 |
 |
| Parameter | Plot |
|---|---|
| CZT HV Monitor | 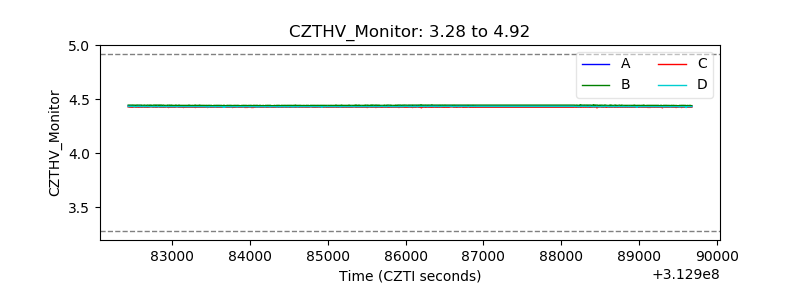 |
| D_VDD | 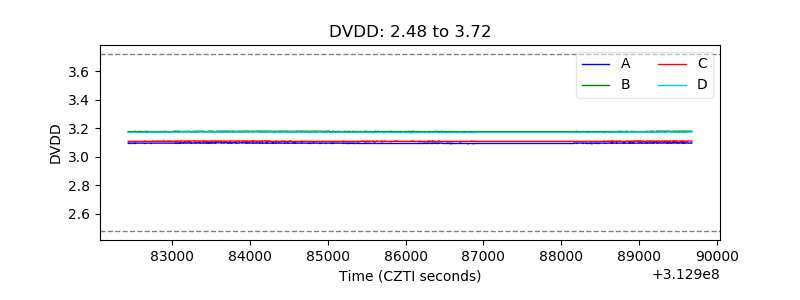 |
| Temperature 1 | 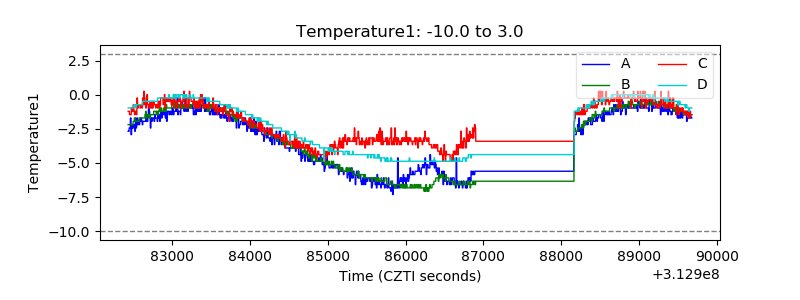 |
| Veto HV Monitor | 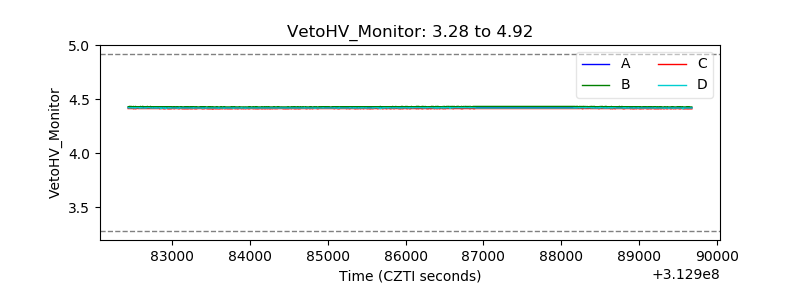 |
| Veto LLD | 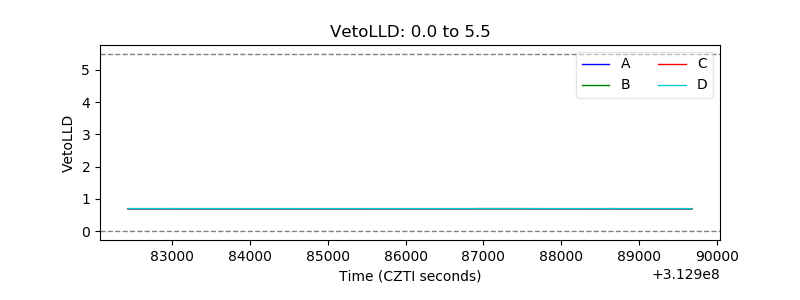 |
| Alpha Counter | 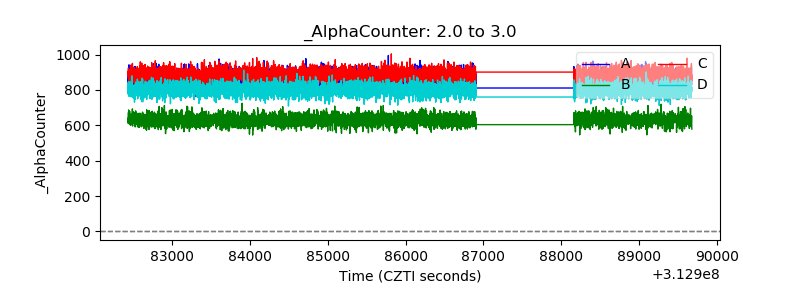 |
| _CPM_Rate | 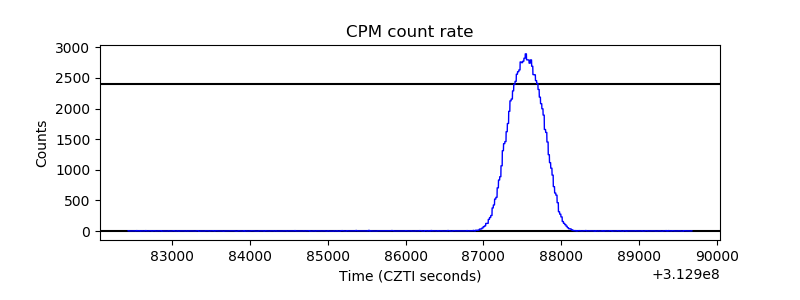 |
| CZT Counter | 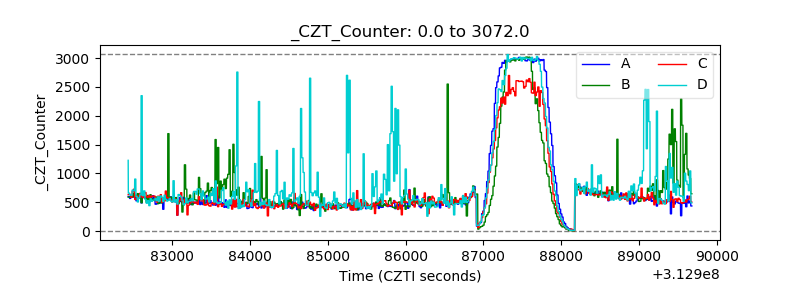 |
| +2.5 Volts monitor |  |
| +5 Volts monitor |  |
| _ROLL_ROT | 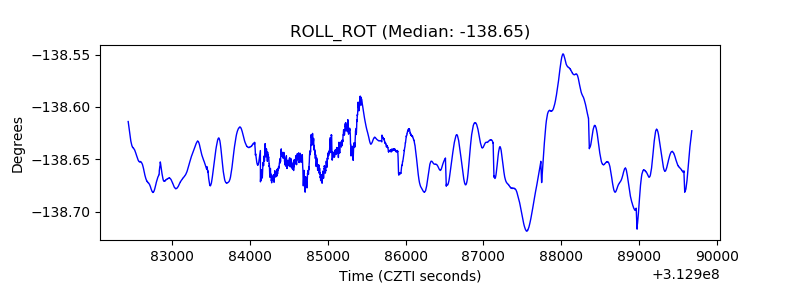 |
| _Roll_DEC | 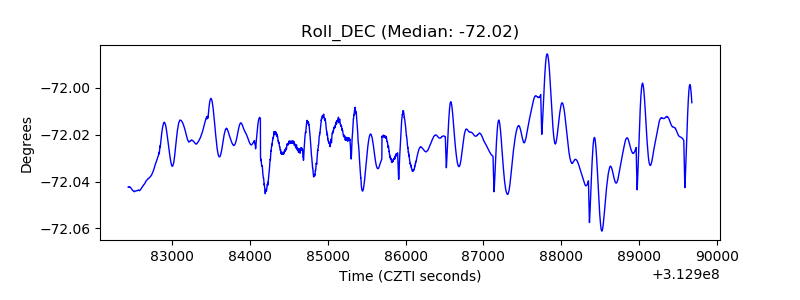 |
| _Roll_RA | 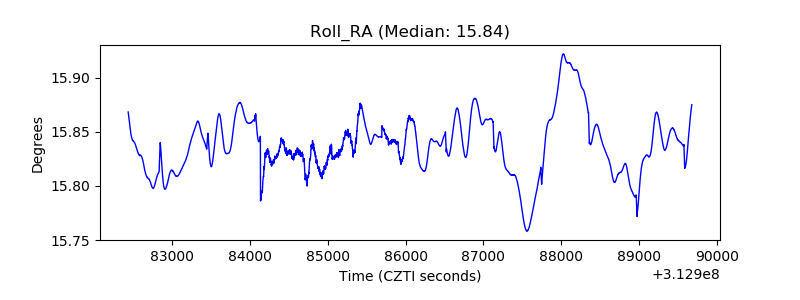 |
| Veto Counter | 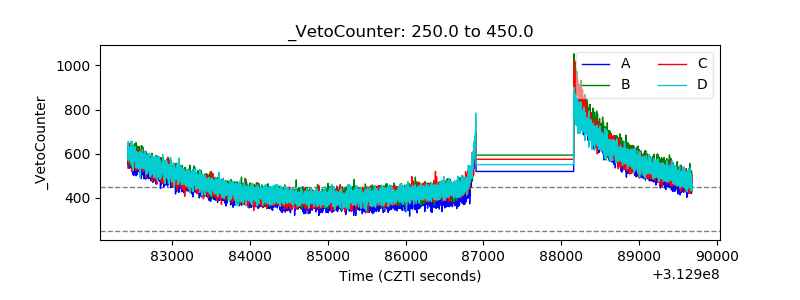 |