| Param | Original file | Final file |
|---|---|---|
| Filename | modeM0/AS1C05_001T01_9000003354_22594cztM0_level2.evt | modeM0/AS1C05_001T01_9000003354_22594cztM0_level2_quad_clean.evt |
| Size (bytes) | 518,083,200 | 133,191,360 |
| Size | 494.1 MB | 127.0 MB |
| Events in quadrant A | 3,107,728 | 947,699 |
| Events in quadrant B | 3,705,851 | 944,265 |
| Events in quadrant C | 3,155,012 | 884,284 |
| Events in quadrant D | 5,309,065 | 832,931 |
| Mode M9 | |||
|---|---|---|---|
| Quadrant | BADHDUFLAG | Total packets | Discarded packets |
| A | 0 | 13 | 0 |
| B | 0 | 13 | 0 |
| C | 0 | 13 | 0 |
| D | 0 | 13 | 0 |
| Mode SS | |||
|---|---|---|---|
| Quadrant | BADHDUFLAG | Total packets | Discarded packets |
| A | 0 | 124 | 0 |
| B | 0 | 124 | 0 |
| C | 0 | 124 | 0 |
| D | 0 | 124 | 0 |
| Mode M0 | |||
|---|---|---|---|
| Quadrant | BADHDUFLAG | Total packets | Discarded packets |
| A | 0 | 13130 | 1 |
| B | 0 | 15107 | 1 |
| C | 0 | 13176 | 1 |
| D | 0 | 19884 | 2 |
| Quadrant | Total seconds | Saturated seconds | Saturation percentage |
|---|---|---|---|
| A | 6081 | 56 | 0.920901% |
| B | 6082 | 171 | 2.811575% |
| C | 6082 | 65 | 1.068727% |
| D | 6081 | 592 | 9.735241% |
Noise dominated data is calculated using 1-second bins in cleaned event files. If a bin has >2000 counts, and if more than 50% of those come from <1% of pixels, then it is considered to be noise-dominated and hence unusable.
| Quadrant | # 1 sec bins | Bins with >0 counts | Bins with >2000 counts | High rate bins dominated by noise | Noise dominated (total time) | Noise dominated (detector-on time) | Marked lightcurve |
|---|---|---|---|---|---|---|---|
| A | 7401 | 6082 | 0 | 0 | 0.00% | 0.00% | 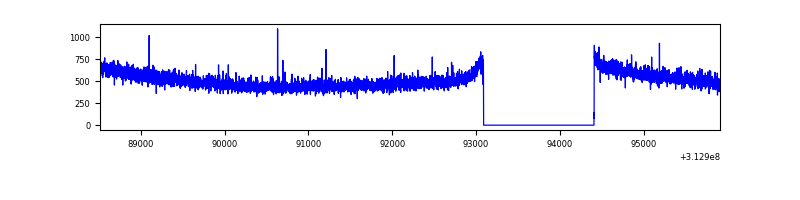 |
| B | 7402 | 6083 | 41 | 41 | 0.55% | 0.67% | 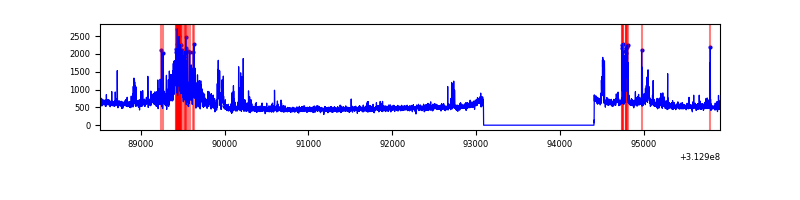 |
| C | 7402 | 6083 | 0 | 0 | 0.00% | 0.00% | 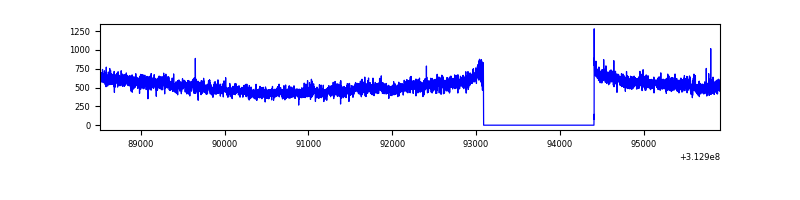 |
| D | 7401 | 6082 | 547 | 547 | 7.39% | 8.99% | 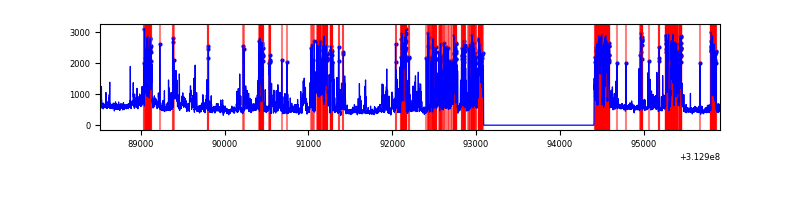 |
Top three noisy pixels from each quadrant. If the there are fewer than three noisy pixels in the level2.evt file, extra rows are filled as -1
| Pixel properties | Quadrant properties | ||||||
|---|---|---|---|---|---|---|---|
| Quadrant | DetID | PixID | Counts | Sigma | Mean | Median | Sigma |
| A | 13 | 254 | 10107 | 57.91 | 805 | 792 | 160.8 |
| A | 0 | 226 | 7203 | 39.86 | 805 | 792 | 160.8 |
| A | 3 | 137 | 6059 | 32.75 | 805 | 792 | 160.8 |
| B | 15 | 33 | 338136 | 2335.55 | 790 | 775 | 144.4 |
| B | 0 | 229 | 99810 | 685.62 | 790 | 775 | 144.4 |
| B | 15 | 35 | 84919 | 582.53 | 790 | 775 | 144.4 |
| C | 14 | 238 | 122111 | 713.88 | 746 | 751 | 170.0 |
| C | 10 | 222 | 114776 | 670.73 | 746 | 751 | 170.0 |
| C | 0 | 207 | 6782 | 35.48 | 746 | 751 | 170.0 |
| D | 1 | 52 | 1472686 | 8343.97 | 732 | 712 | 176.4 |
| D | 12 | 233 | 754898 | 4275.15 | 732 | 712 | 176.4 |
| D | 10 | 230 | 114151 | 643.04 | 732 | 712 | 176.4 |
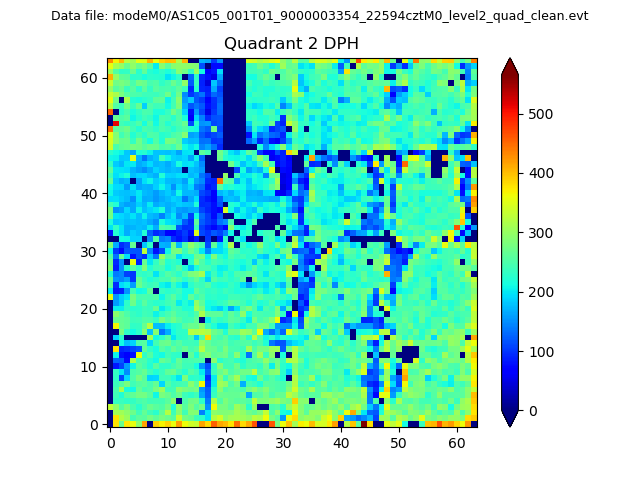
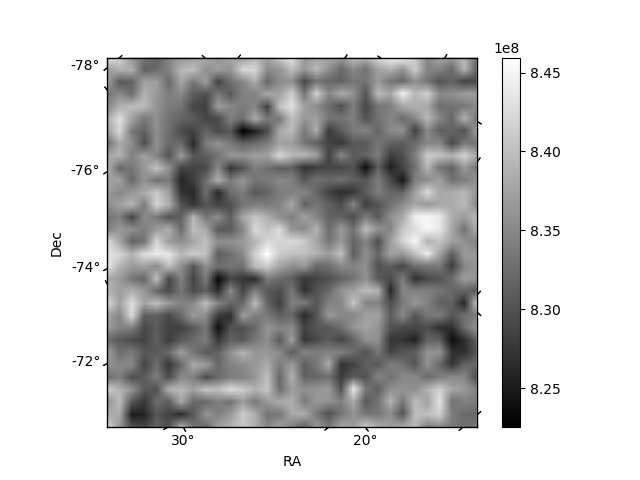
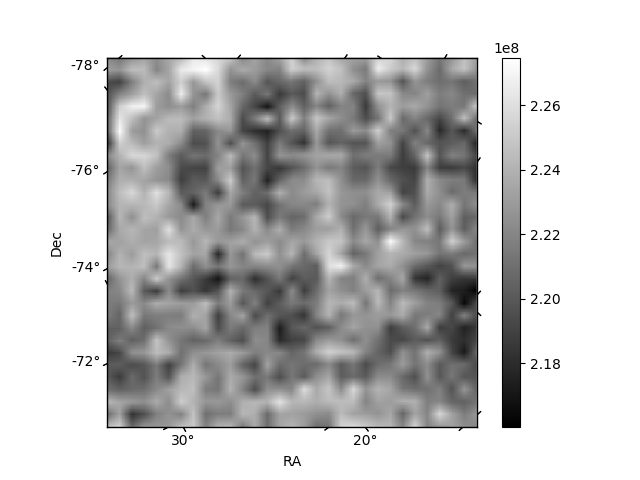
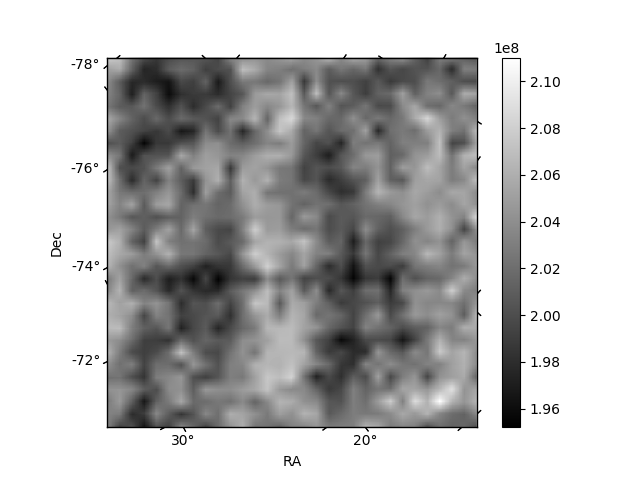
Histogram calculated using DETX and DETY for each event in the final _common_clean file
| Quadrant A | 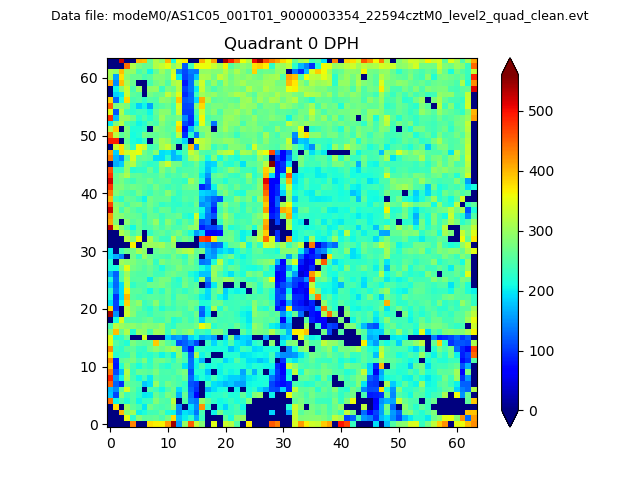 |
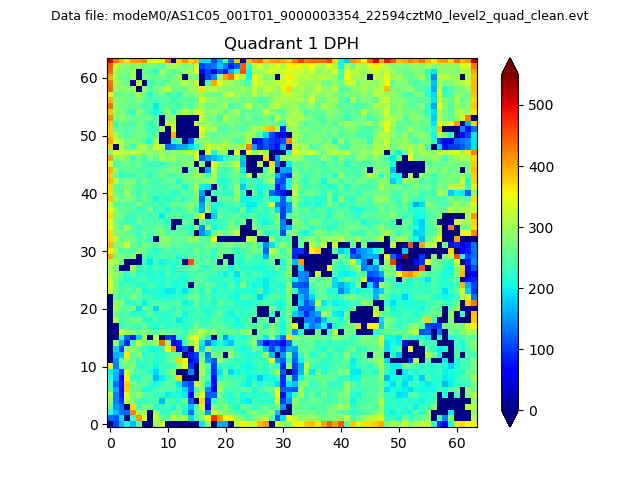 |
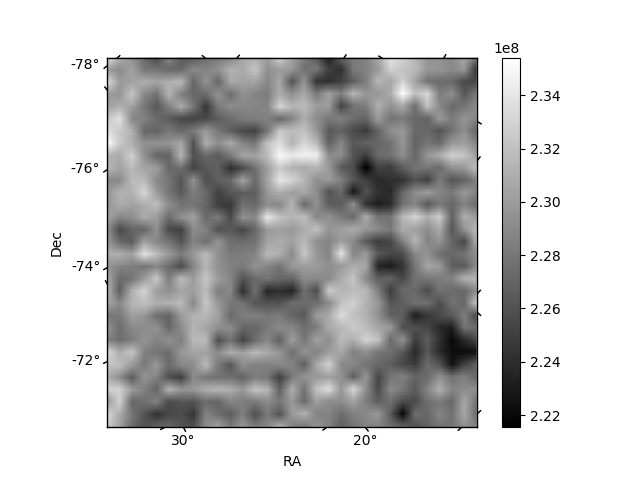
Quadrant B |
|---|---|---|---|
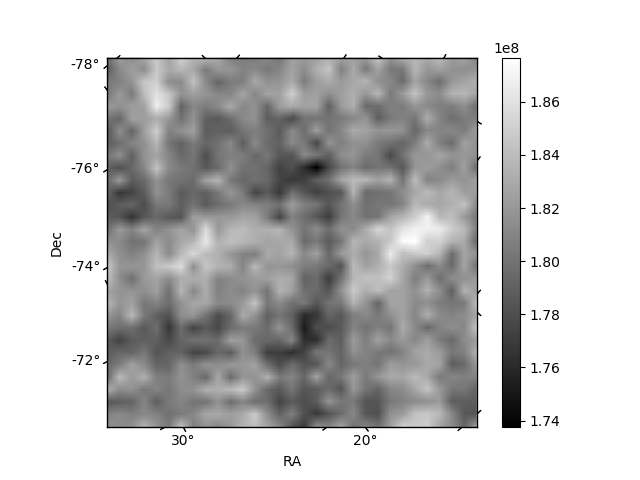
| Quadrant D | 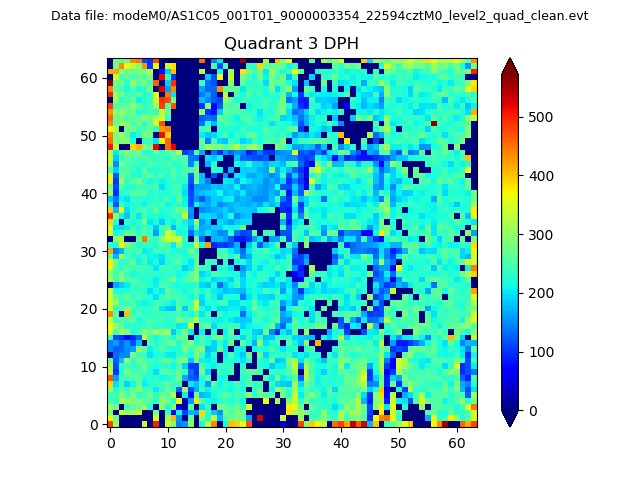 |
 |
Quadrant C |
| Plot type | Count rate plots | Images |
|---|---|---|
| Comparison with Poisson distribution Blue bars denote a histogram of data divided into 1 sec bins. Red curve is a Poisson curve with rate = median count rate of data. |
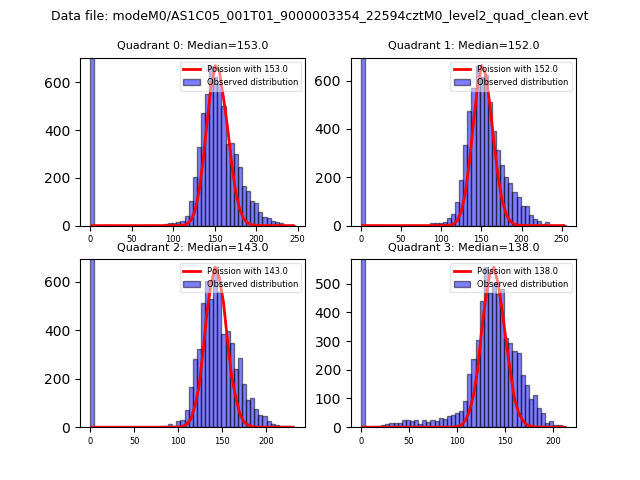 |
 |
| Quadrant-wise count rates Data is divided into 100 sec bins |
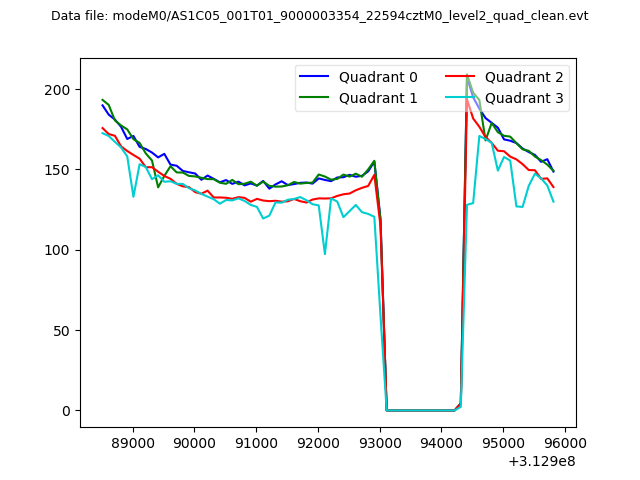 |
|
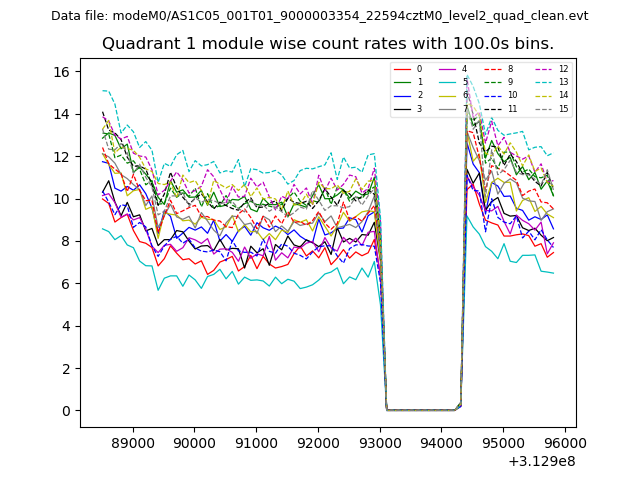
| Module-wise count rates for Quadrant A Data is divided into 100 sec bins |
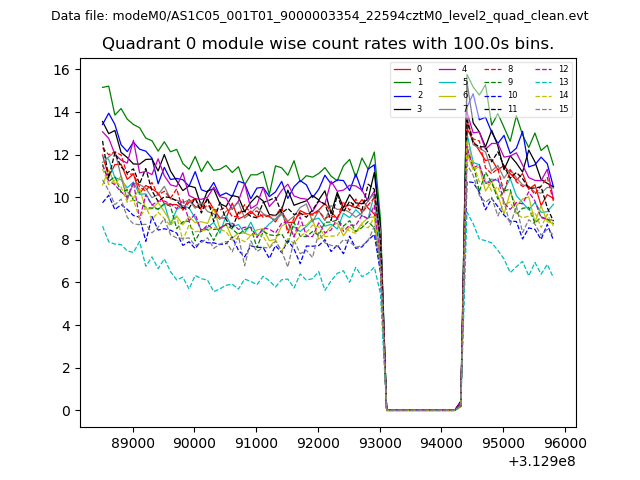 |
 |
| Module-wise count rates for Quadrant B Data is divided into 100 sec bins |
 |
 |
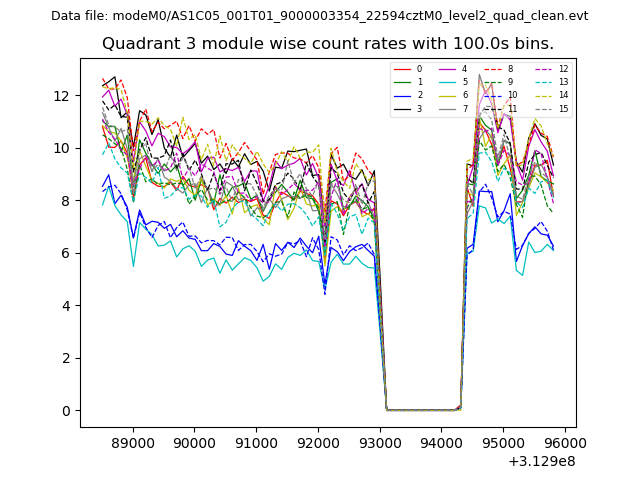
| Module-wise count rates for Quadrant C Data is divided into 100 sec bins |
 |
 |
| Module-wise count rates for Quadrant D Data is divided into 100 sec bins |
 |
 |
| Parameter | Plot |
|---|---|
| CZT HV Monitor | 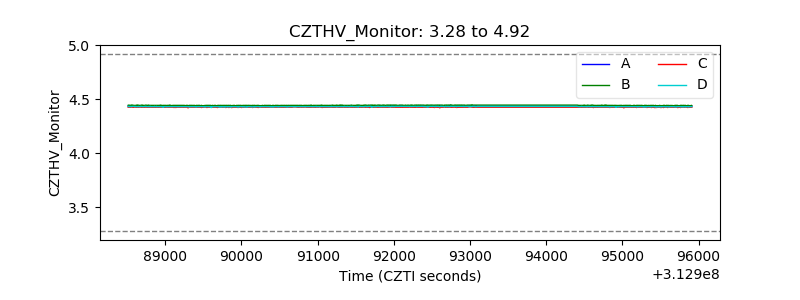 |
| D_VDD |  |
| Temperature 1 | 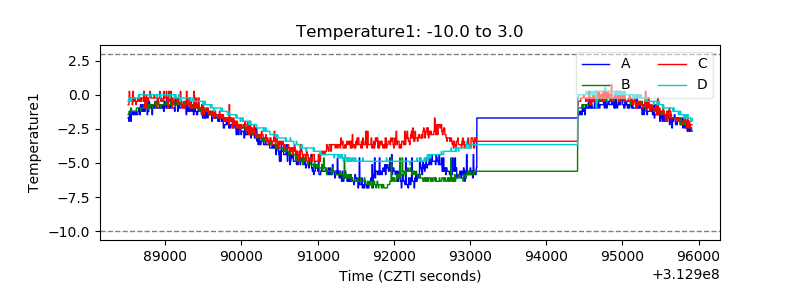 |
| Veto HV Monitor | 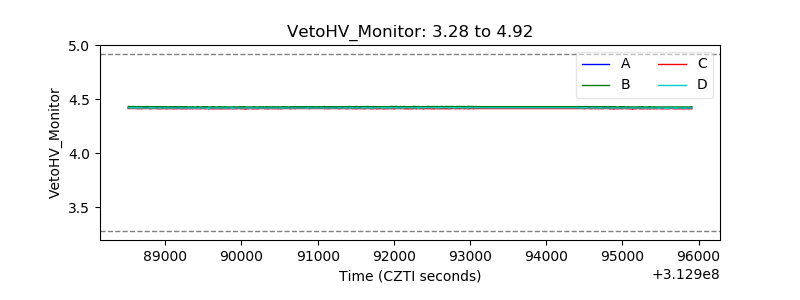 |
| Veto LLD |  |
| Alpha Counter | 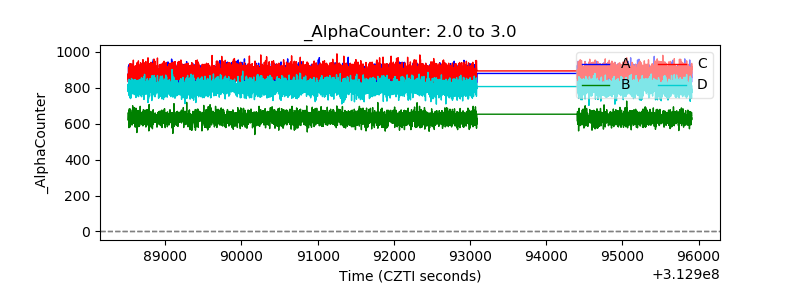 |
| _CPM_Rate | 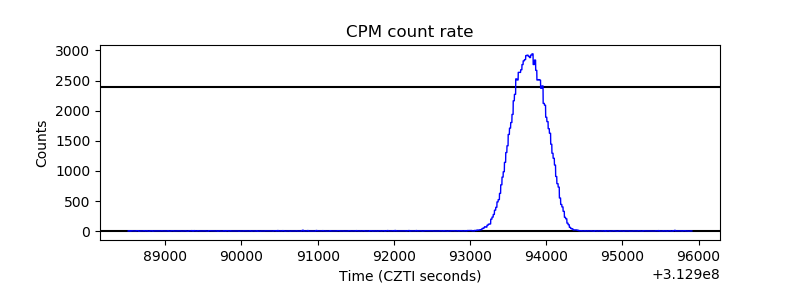 |
| CZT Counter | 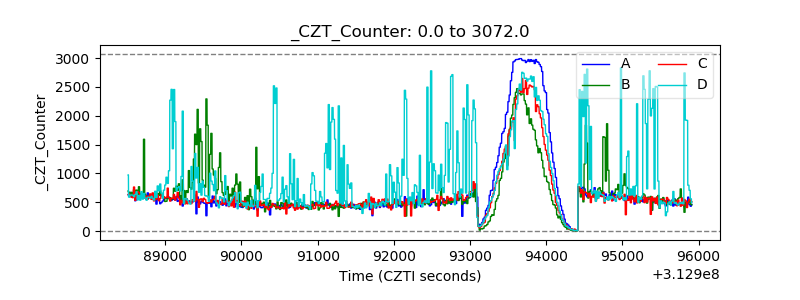 |
| +2.5 Volts monitor |  |
| +5 Volts monitor |  |
| _ROLL_ROT | 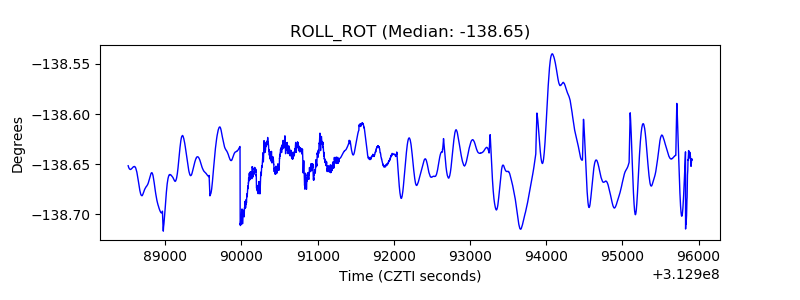 |
| _Roll_DEC | 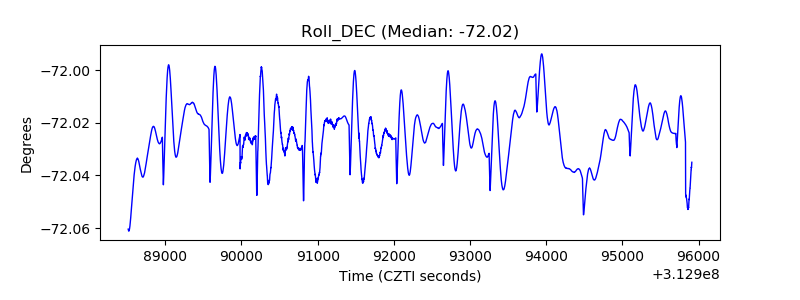 |
| _Roll_RA | 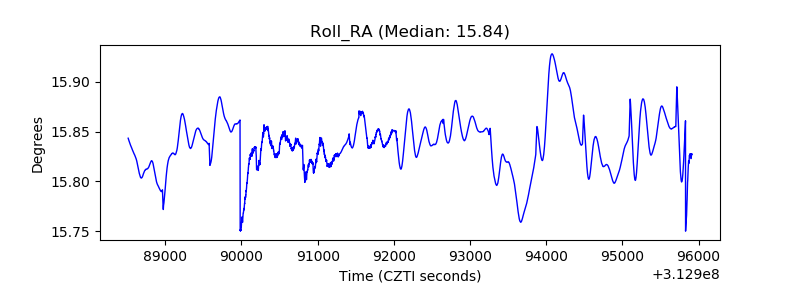 |
| Veto Counter | 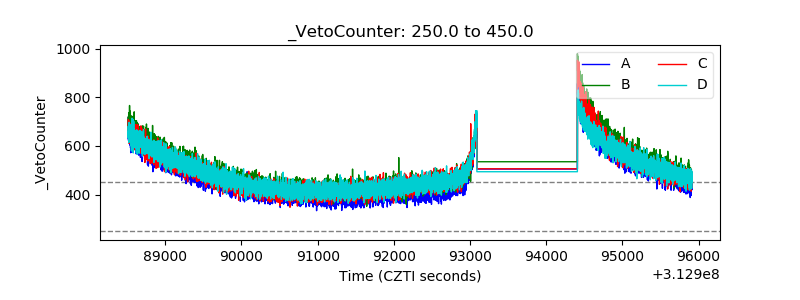 |