| Param | Original file | Final file |
|---|---|---|
| Filename | modeM0/AS1C05_001T01_9000003354_22596cztM0_level2.evt | modeM0/AS1C05_001T01_9000003354_22596cztM0_level2_quad_clean.evt |
| Size (bytes) | 444,726,720 | 131,186,880 |
| Size | 424.1 MB | 125.1 MB |
| Events in quadrant A | 3,078,754 | 910,874 |
| Events in quadrant B | 3,448,032 | 920,914 |
| Events in quadrant C | 3,129,279 | 857,771 |
| Events in quadrant D | 3,383,893 | 843,792 |
| Mode M9 | |||
|---|---|---|---|
| Quadrant | BADHDUFLAG | Total packets | Discarded packets |
| A | 0 | 13 | 0 |
| B | 0 | 14 | 0 |
| C | 0 | 14 | 0 |
| D | 0 | 14 | 0 |
| Mode SS | |||
|---|---|---|---|
| Quadrant | BADHDUFLAG | Total packets | Discarded packets |
| A | 0 | 128 | 0 |
| B | 0 | 128 | 0 |
| C | 0 | 128 | 0 |
| D | 0 | 128 | 0 |
| Mode M0 | |||
|---|---|---|---|
| Quadrant | BADHDUFLAG | Total packets | Discarded packets |
| A | 0 | 13291 | 2 |
| B | 0 | 14352 | 3 |
| C | 0 | 13367 | 2 |
| D | 0 | 14237 | 2 |
| Quadrant | Total seconds | Saturated seconds | Saturation percentage |
|---|---|---|---|
| A | 6309 | 34 | 0.538913% |
| B | 6308 | 57 | 0.903614% |
| C | 6308 | 65 | 1.030438% |
| D | 6308 | 36 | 0.570704% |
Noise dominated data is calculated using 1-second bins in cleaned event files. If a bin has >2000 counts, and if more than 50% of those come from <1% of pixels, then it is considered to be noise-dominated and hence unusable.
| Quadrant | # 1 sec bins | Bins with >0 counts | Bins with >2000 counts | High rate bins dominated by noise | Noise dominated (total time) | Noise dominated (detector-on time) | Marked lightcurve |
|---|---|---|---|---|---|---|---|
| A | 7584 | 6311 | 1 | 1 | 0.01% | 0.02% | 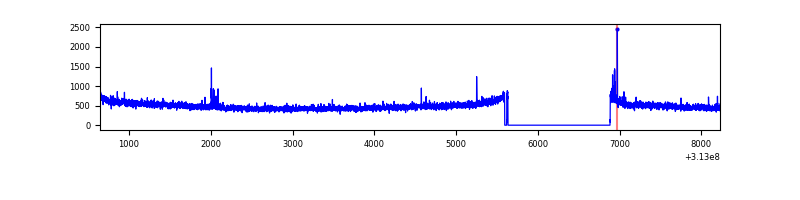 |
| B | 7583 | 6310 | 11 | 11 | 0.15% | 0.17% | 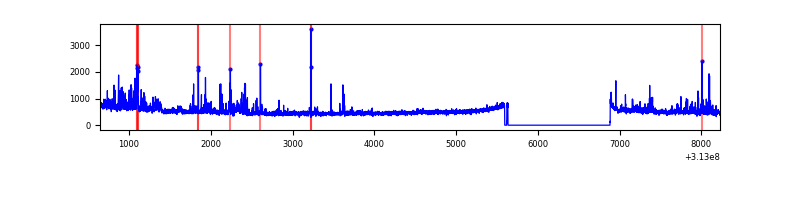 |
| C | 7583 | 6310 | 2 | 2 | 0.03% | 0.03% | 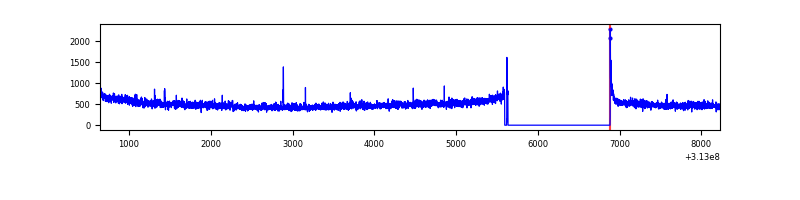 |
| D | 7583 | 6310 | 28 | 28 | 0.37% | 0.44% | 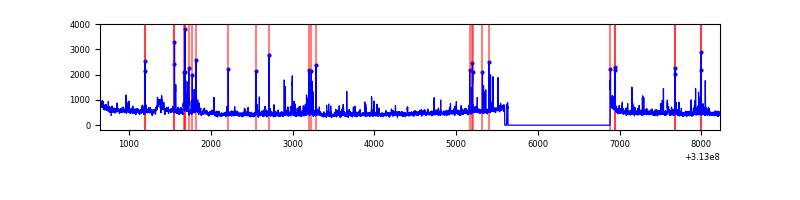 |
Top three noisy pixels from each quadrant. If the there are fewer than three noisy pixels in the level2.evt file, extra rows are filled as -1
| Pixel properties | Quadrant properties | ||||||
|---|---|---|---|---|---|---|---|
| Quadrant | DetID | PixID | Counts | Sigma | Mean | Median | Sigma |
| A | 14 | 238 | 12127 | 71.85 | 789 | 776 | 158.0 |
| A | 4 | 2 | 11873 | 70.24 | 789 | 776 | 158.0 |
| A | 13 | 254 | 11458 | 67.61 | 789 | 776 | 158.0 |
| B | 0 | 190 | 110860 | 756.58 | 788 | 770 | 145.5 |
| B | 0 | 229 | 73315 | 498.56 | 788 | 770 | 145.5 |
| B | 0 | 228 | 69278 | 470.81 | 788 | 770 | 145.5 |
| C | 14 | 238 | 119852 | 698.39 | 740 | 743 | 170.5 |
| C | 10 | 222 | 91213 | 530.47 | 740 | 743 | 170.5 |
| C | 0 | 10 | 20137 | 113.72 | 740 | 743 | 170.5 |
| D | 1 | 52 | 198045 | 1085.17 | 751 | 728 | 181.8 |
| D | 12 | 227 | 119966 | 655.76 | 751 | 728 | 181.8 |
| D | 12 | 233 | 46712 | 252.89 | 751 | 728 | 181.8 |
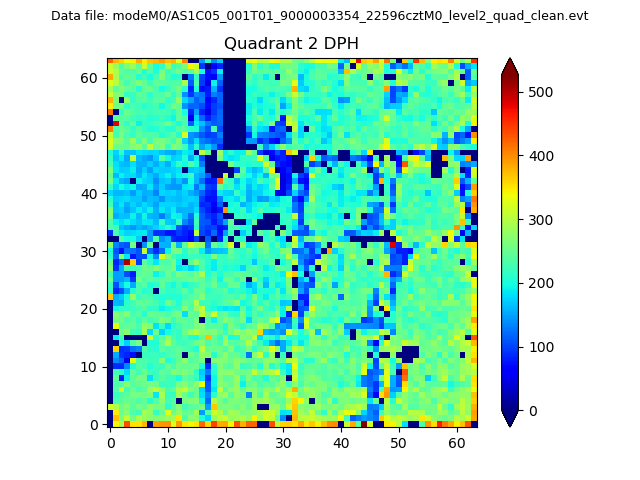
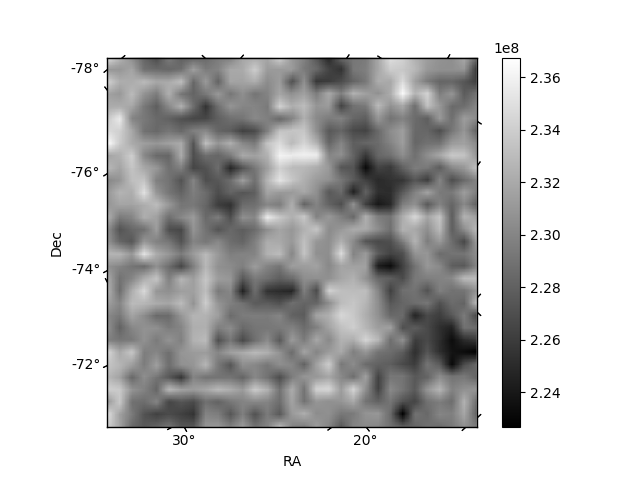
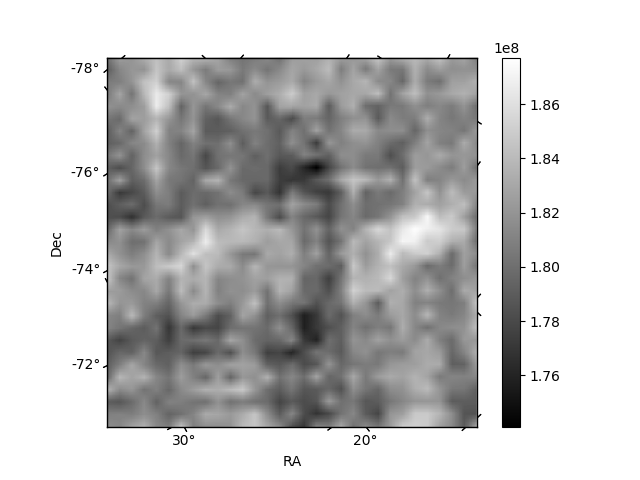
Histogram calculated using DETX and DETY for each event in the final _common_clean file
| Quadrant A | 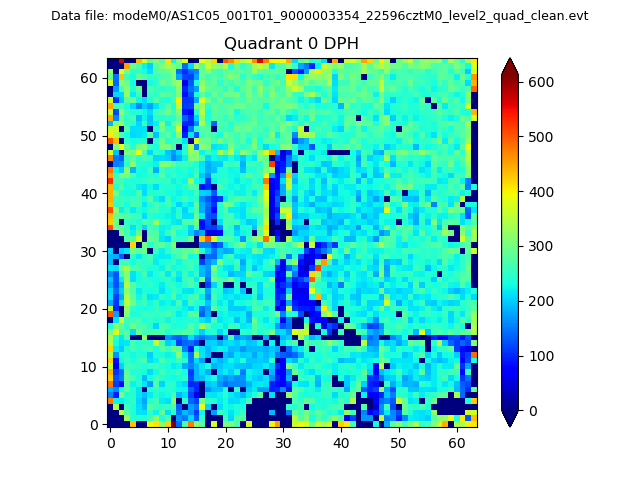 |
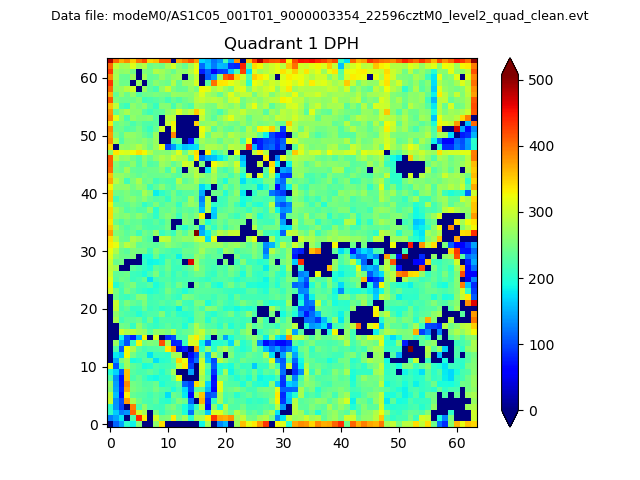 |
Quadrant B |
|---|---|---|---|
| Quadrant D | 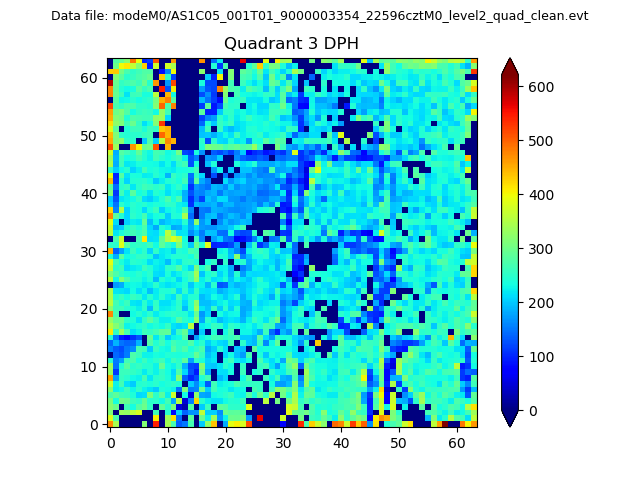 |
 |
Quadrant C |
| Plot type | Count rate plots | Images |
|---|---|---|
| Comparison with Poisson distribution Blue bars denote a histogram of data divided into 1 sec bins. Red curve is a Poisson curve with rate = median count rate of data. |
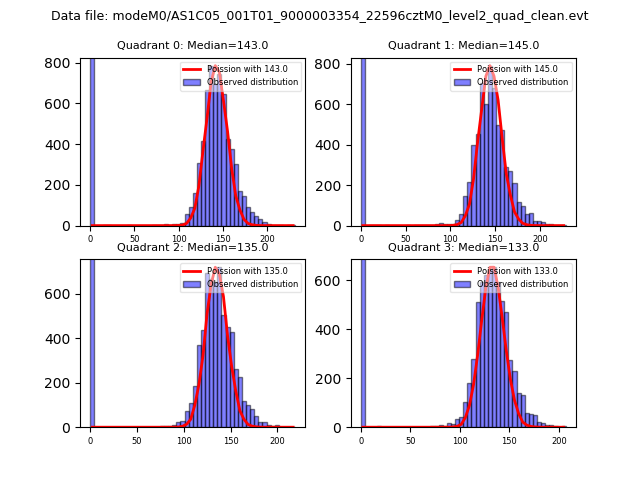 |
 |
| Quadrant-wise count rates Data is divided into 100 sec bins |
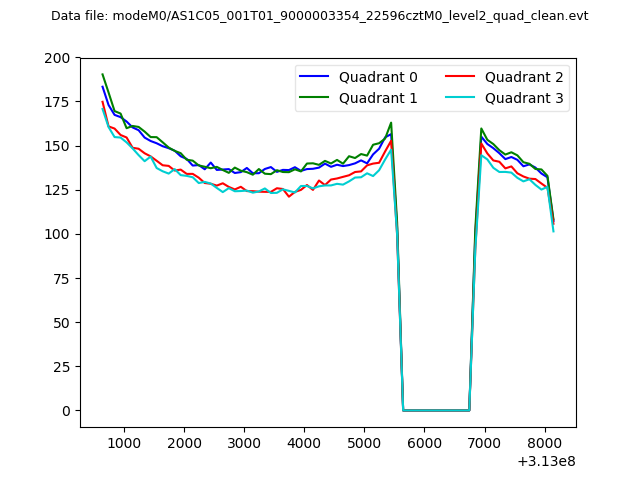 |
|
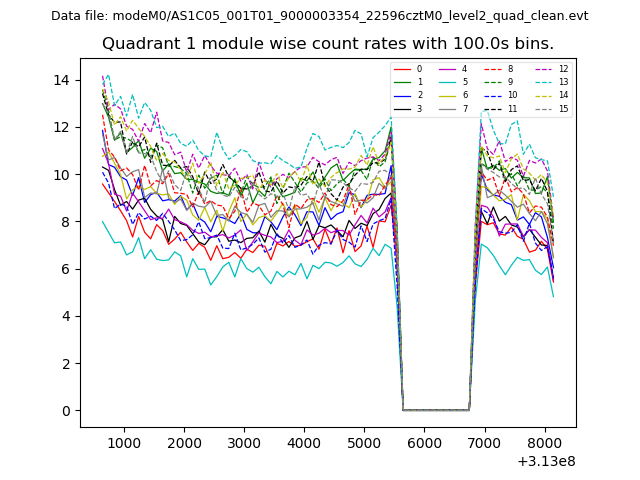
| Module-wise count rates for Quadrant A Data is divided into 100 sec bins |
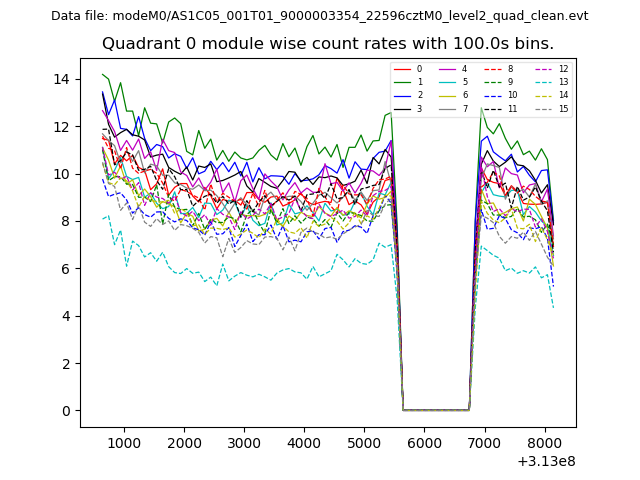 |
 |
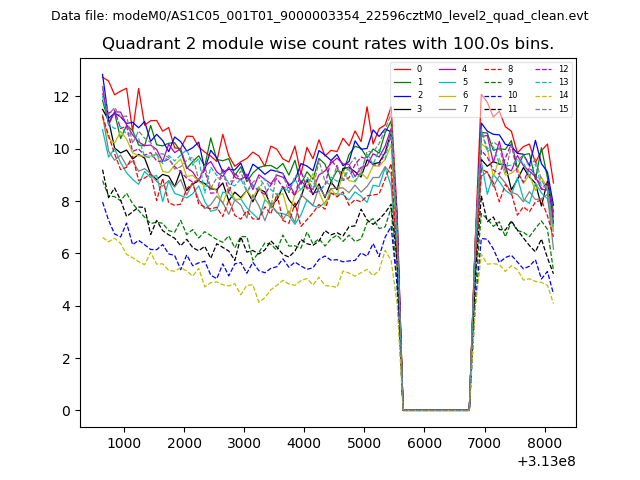
| Module-wise count rates for Quadrant B Data is divided into 100 sec bins |
 |
 |
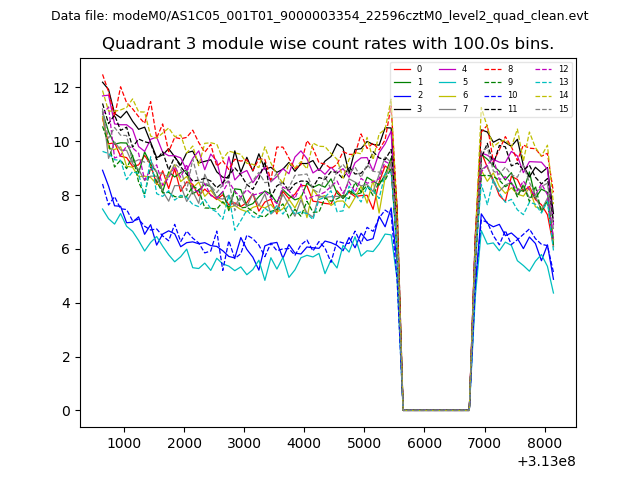
| Module-wise count rates for Quadrant C Data is divided into 100 sec bins |
 |
 |
| Module-wise count rates for Quadrant D Data is divided into 100 sec bins |
 |
 |
| Parameter | Plot |
|---|---|
| CZT HV Monitor | 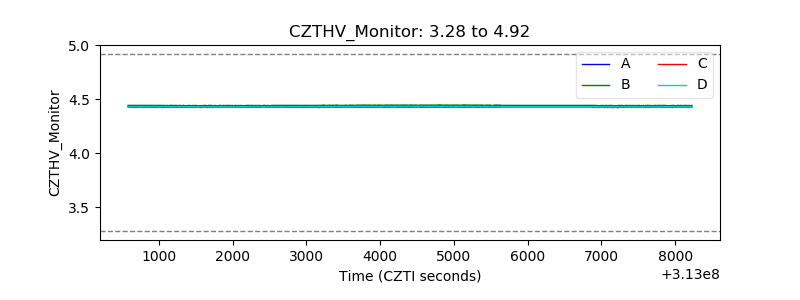 |
| D_VDD |  |
| Temperature 1 | 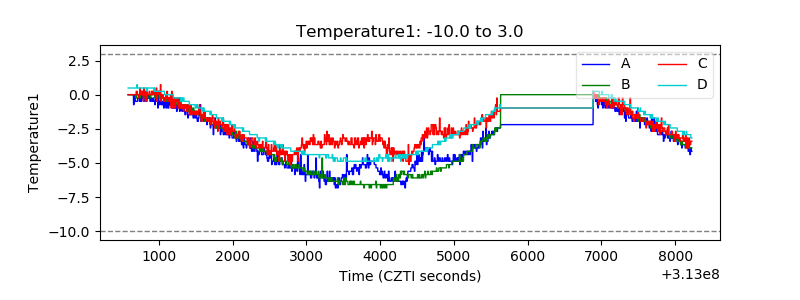 |
| Veto HV Monitor | 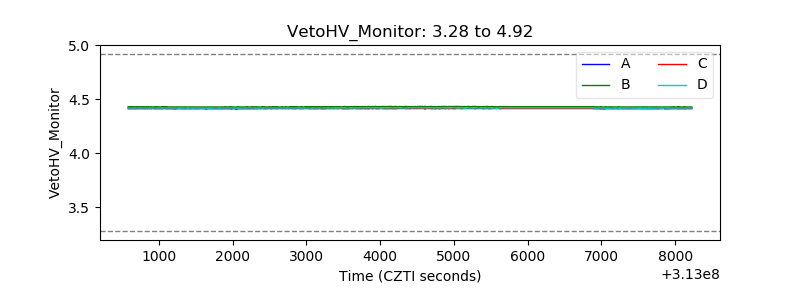 |
| Veto LLD | 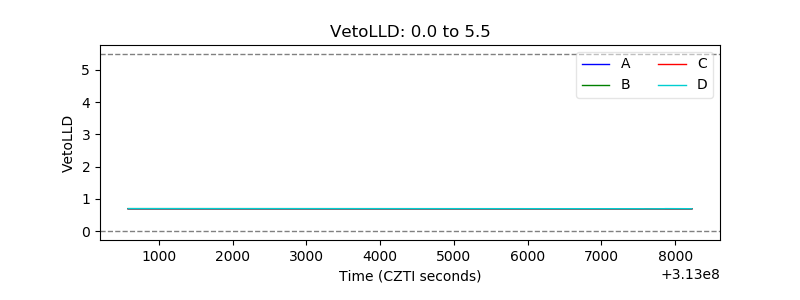 |
| Alpha Counter | 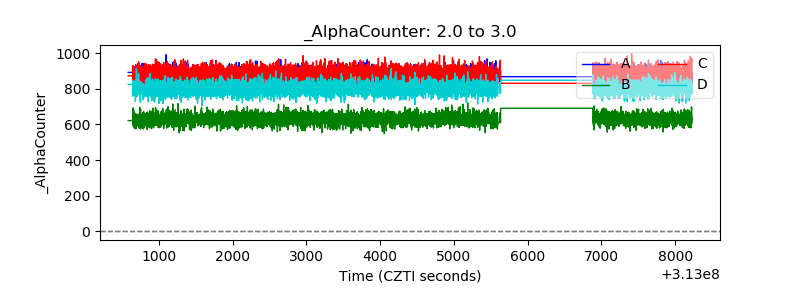 |
| _CPM_Rate | 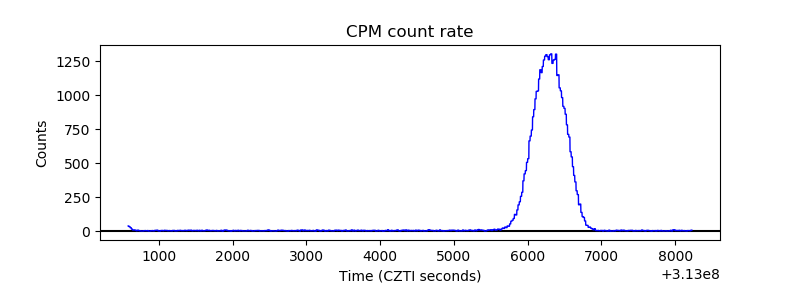 |
| CZT Counter | 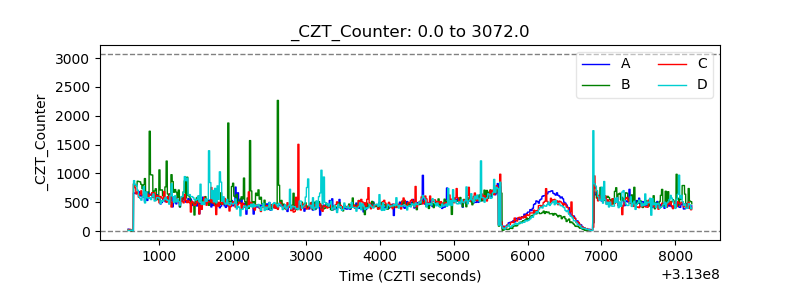 |
| +2.5 Volts monitor |  |
| +5 Volts monitor |  |
| _ROLL_ROT | 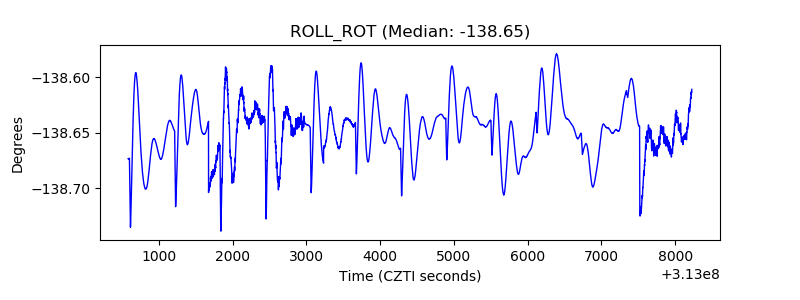 |
| _Roll_DEC | 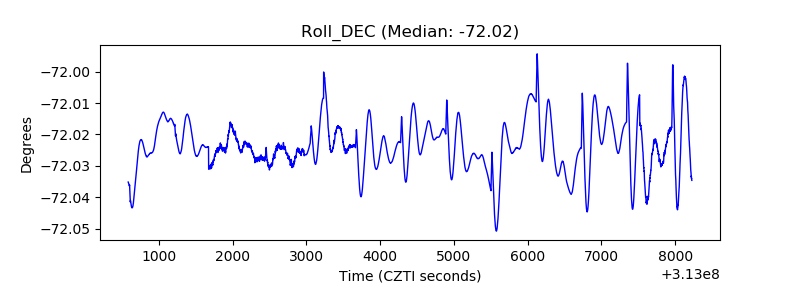 |
| _Roll_RA |  |
| Veto Counter | 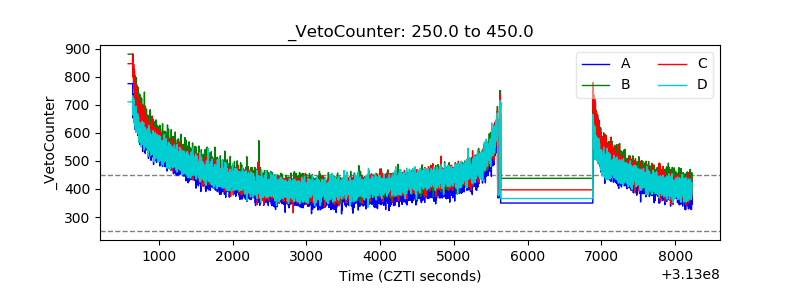 |