| Param | Original file | Final file |
|---|---|---|
| Filename | modeM0/AS1C05_006T01_9000003356cztM0_level2.fits | modeM0/AS1C05_006T01_9000003356cztM0_level2_quad_clean.evt |
| Size (bytes) | 424,903,680 | 434,162,880 |
| Size | 405.2 MB | 414.0 MB |
| Events in quadrant A | 2,593,452 | 2,628,345 |
| Events in quadrant B | 2,489,130 | 2,644,740 |
| Events in quadrant C | 2,504,350 | 2,497,126 |
| Events in quadrant D | 2,223,484 | 2,320,729 |
| Mode SS | |||
|---|---|---|---|
| Quadrant | BADHDUFLAG | Total packets | Discarded packets |
| A | 0 | 906 | 0 |
| B | 0 | 906 | 0 |
| C | 0 | 906 | 0 |
| D | 0 | 906 | 0 |
| Mode M0 | |||
|---|---|---|---|
| Quadrant | BADHDUFLAG | Total packets | Discarded packets |
| A | 0 | 93980 | 0 |
| B | 0 | 94125 | 0 |
| C | 0 | 91890 | 0 |
| D | 0 | 96219 | 0 |
| Mode M9 | |||
|---|---|---|---|
| Quadrant | BADHDUFLAG | Total packets | Discarded packets |
| A | 0 | 52 | 0 |
| B | 0 | 52 | 0 |
| C | 0 | 52 | 0 |
| D | 0 | 52 | 0 |
| Quadrant | Total seconds | Saturated seconds | Saturation percentage |
|---|---|---|---|
| A | 44552 | 627 | 1.407344% |
| B | 44552 | 637 | 1.429790% |
| C | 44552 | 665 | 1.492638% |
| D | 44552 | 341 | 0.765398% |
Noise dominated data is calculated using 1-second bins in cleaned event files. If a bin has >2000 counts, and if more than 50% of those come from <1% of pixels, then it is considered to be noise-dominated and hence unusable.
| Quadrant | # 1 sec bins | Bins with >0 counts | Bins with >2000 counts | High rate bins dominated by noise | Noise dominated (total time) | Noise dominated (detector-on time) | Marked lightcurve |
|---|---|---|---|---|---|---|---|
| A | 49687 | 44553 | 0 | 0 | 0.00% | 0.00% |  |
| B | 49687 | 44552 | 0 | 0 | 0.00% | 0.00% |  |
| C | 49687 | 44553 | 0 | 0 | 0.00% | 0.00% |  |
| D | 49687 | 44550 | 0 | 0 | 0.00% | 0.00% |  |
Top three noisy pixels from each quadrant. If the there are fewer than three noisy pixels in the level2.evt file, extra rows are filled as -1
| Pixel properties | Quadrant properties | ||||||
|---|---|---|---|---|---|---|---|
| Quadrant | DetID | PixID | Counts | Sigma | Mean | Median | Sigma |
| A | 0 | 29 | 2484 | 11.05 | 673 | 628 | 167.9 |
| A | 7 | 110 | 2041 | 8.42 | 673 | 628 | 167.9 |
| A | 0 | 30 | 1971 | 8.0 | 673 | 628 | 167.9 |
| B | 2 | 9 | 1992 | 10.31 | 657 | 625 | 132.6 |
| B | 2 | 8 | 1644 | 7.69 | 657 | 625 | 132.6 |
| B | 3 | 17 | 1631 | 7.59 | 657 | 625 | 132.6 |
| C | 12 | 241 | 1744 | 6.66 | 661 | 614 | 169.6 |
| C | 7 | 111 | 1707 | 6.45 | 661 | 614 | 169.6 |
| C | 9 | 233 | 1706 | 6.44 | 661 | 614 | 169.6 |
| D | 13 | 238 | 1692 | 6.59 | 633 | 574 | 169.6 |
| D | 3 | 14 | 1665 | 6.43 | 633 | 574 | 169.6 |
| D | 6 | 231 | 1563 | 5.83 | 633 | 574 | 169.6 |
Histogram calculated using DETX and DETY for each event in the final _common_clean file
| Quadrant A | 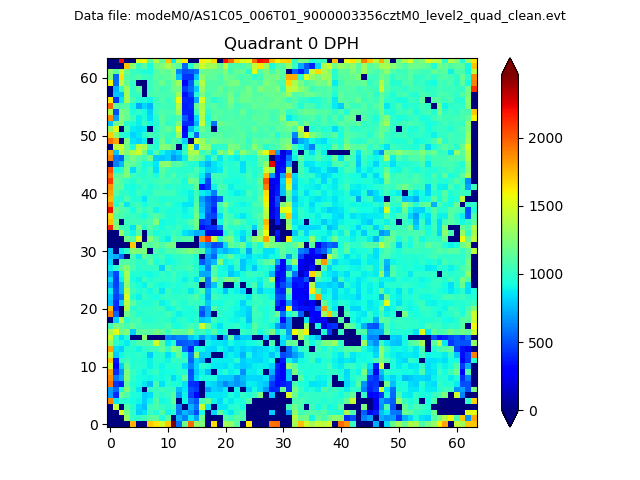 |
 |
Quadrant B |
|---|---|---|---|
| Quadrant D |  |
 |
Quadrant C |
| Plot type | Count rate plots | Images |
|---|---|---|
| Comparison with Poisson distribution Blue bars denote a histogram of data divided into 1 sec bins. Red curve is a Poisson curve with rate = median count rate of data. |
 |
 |
| Quadrant-wise count rates Data is divided into 100 sec bins |
 |
|
| Module-wise count rates for Quadrant A Data is divided into 100 sec bins |
 |
 |
| Module-wise count rates for Quadrant B Data is divided into 100 sec bins |
 |
 |
| Module-wise count rates for Quadrant C Data is divided into 100 sec bins |
 |
 |
| Module-wise count rates for Quadrant D Data is divided into 100 sec bins |
 |
 |
| Parameter | Plot |
|---|---|
| CZT HV Monitor |  |
| D_VDD |  |
| Temperature 1 |  |
| Veto HV Monitor |  |
| Veto LLD |  |
| Alpha Counter |  |
| _CPM_Rate |  |
| CZT Counter |  |
| +2.5 Volts monitor |  |
| +5 Volts monitor |  |
| _ROLL_ROT |  |
| _Roll_DEC |  |
| _Roll_RA |  |
| Veto Counter |  |