| Param | Original file | Final file |
|---|---|---|
| Filename | modeM0/AS1C05_006T01_9000003356_22598cztM0_level2.evt | modeM0/AS1C05_006T01_9000003356_22598cztM0_level2_quad_clean.evt |
| Size (bytes) | 337,979,520 | 63,322,560 |
| Size | 322.3 MB | 60.4 MB |
| Events in quadrant A | 2,365,829 | 401,288 |
| Events in quadrant B | 2,515,234 | 405,233 |
| Events in quadrant C | 2,375,477 | 387,151 |
| Events in quadrant D | 2,645,094 | 379,675 |
| Mode SS | |||
|---|---|---|---|
| Quadrant | BADHDUFLAG | Total packets | Discarded packets |
| A | 0 | 100 | 0 |
| B | 0 | 100 | 0 |
| C | 0 | 100 | 0 |
| D | 0 | 100 | 0 |
| Mode M0 | |||
|---|---|---|---|
| Quadrant | BADHDUFLAG | Total packets | Discarded packets |
| A | 0 | 10105 | 1 |
| B | 0 | 10547 | 1 |
| C | 0 | 10100 | 1 |
| D | 0 | 11204 | 1 |
| Mode M9 | |||
|---|---|---|---|
| Quadrant | BADHDUFLAG | Total packets | Discarded packets |
| A | 0 | 6 | 0 |
| B | 0 | 6 | 0 |
| C | 0 | 6 | 0 |
| D | 0 | 6 | 0 |
| Quadrant | Total seconds | Saturated seconds | Saturation percentage |
|---|---|---|---|
| A | 4901 | 46 | 0.938584% |
| B | 4901 | 83 | 1.693532% |
| C | 4901 | 67 | 1.367068% |
| D | 4901 | 45 | 0.918180% |
Noise dominated data is calculated using 1-second bins in cleaned event files. If a bin has >2000 counts, and if more than 50% of those come from <1% of pixels, then it is considered to be noise-dominated and hence unusable.
| Quadrant | # 1 sec bins | Bins with >0 counts | Bins with >2000 counts | High rate bins dominated by noise | Noise dominated (total time) | Noise dominated (detector-on time) | Marked lightcurve |
|---|---|---|---|---|---|---|---|
| A | 5486 | 4902 | 0 | 0 | 0.00% | 0.00% | 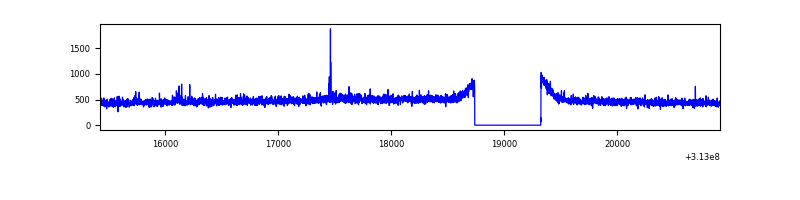 |
| B | 5486 | 4902 | 3 | 3 | 0.05% | 0.06% | 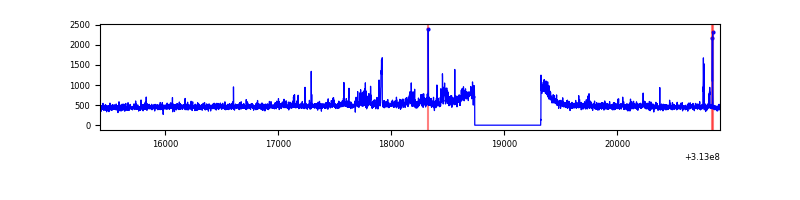 |
| C | 5486 | 4902 | 0 | 0 | 0.00% | 0.00% | 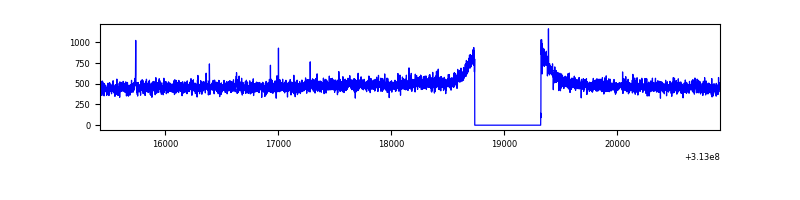 |
| D | 5486 | 4902 | 8 | 8 | 0.15% | 0.16% | 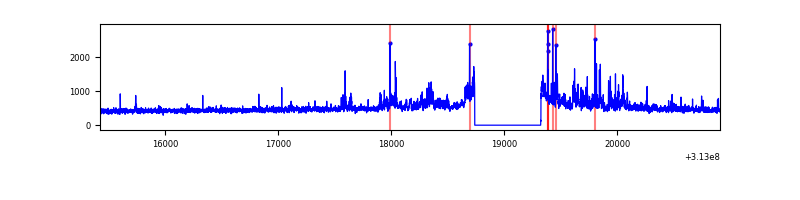 |
Top three noisy pixels from each quadrant. If the there are fewer than three noisy pixels in the level2.evt file, extra rows are filled as -1
| Pixel properties | Quadrant properties | ||||||
|---|---|---|---|---|---|---|---|
| Quadrant | DetID | PixID | Counts | Sigma | Mean | Median | Sigma |
| A | 14 | 235 | 19590 | 152.62 | 607 | 592 | 124.5 |
| A | 13 | 254 | 8896 | 66.71 | 607 | 592 | 124.5 |
| A | 0 | 226 | 5377 | 38.44 | 607 | 592 | 124.5 |
| B | 0 | 229 | 51884 | 438.53 | 604 | 588 | 117.0 |
| B | 0 | 190 | 36953 | 310.88 | 604 | 588 | 117.0 |
| B | 5 | 172 | 24800 | 206.99 | 604 | 588 | 117.0 |
| C | 14 | 238 | 91587 | 662.64 | 580 | 584 | 137.3 |
| C | 10 | 222 | 15181 | 106.29 | 580 | 584 | 137.3 |
| C | 13 | 61 | 4031 | 25.1 | 580 | 584 | 137.3 |
| D | 1 | 239 | 202239 | 1380.76 | 592 | 574 | 146.1 |
| D | 1 | 52 | 119762 | 816.05 | 592 | 574 | 146.1 |
| D | 7 | 38 | 32025 | 215.34 | 592 | 574 | 146.1 |
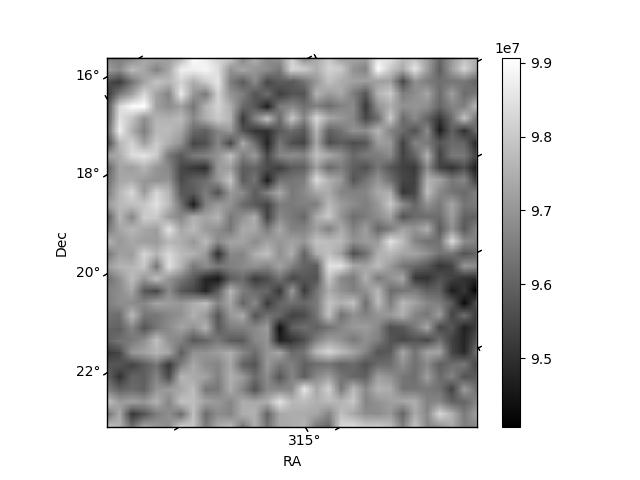
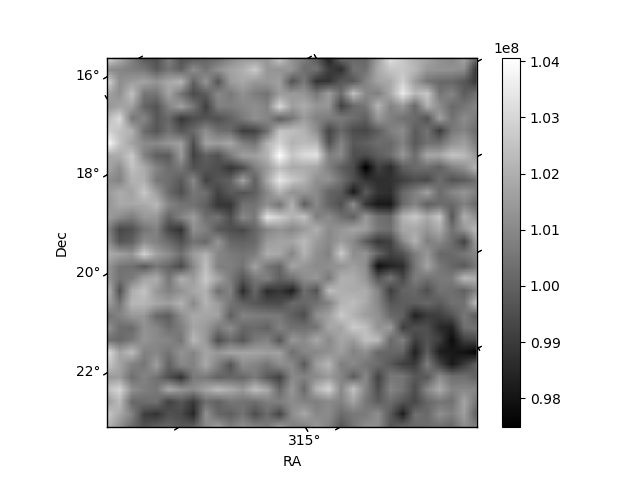
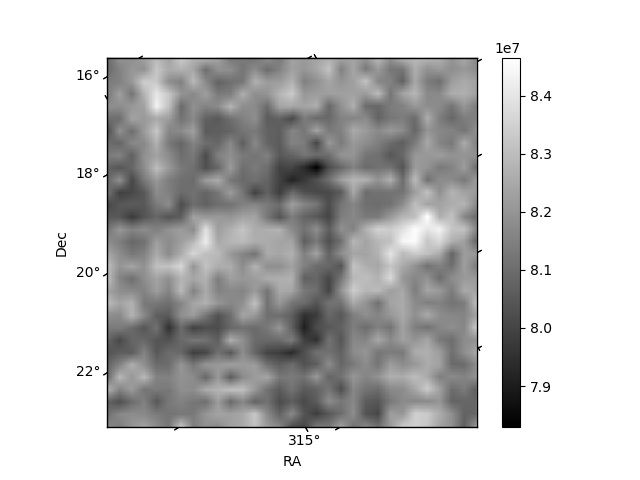
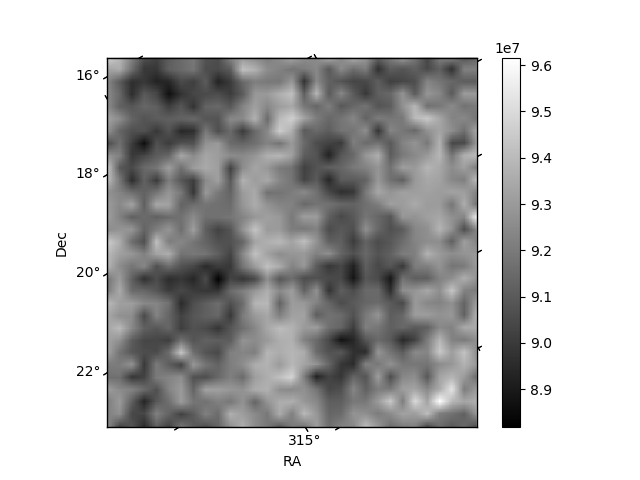
Histogram calculated using DETX and DETY for each event in the final _common_clean file
| Quadrant A | 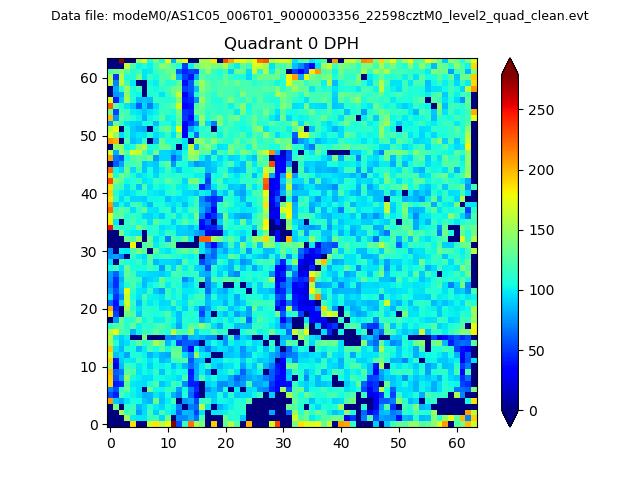 |
 |
Quadrant B |
|---|---|---|---|
| Quadrant D | 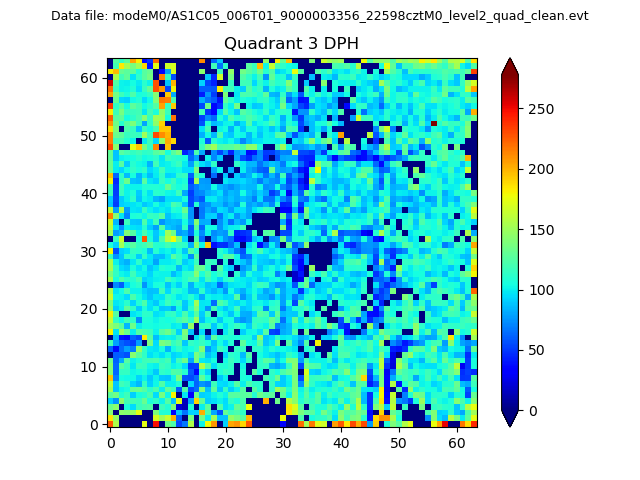 |
 |
Quadrant C |
| Plot type | Count rate plots | Images |
|---|---|---|
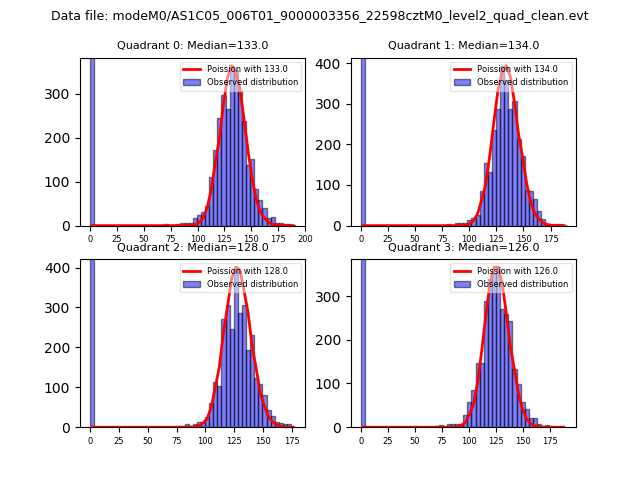
| Comparison with Poisson distribution Blue bars denote a histogram of data divided into 1 sec bins. Red curve is a Poisson curve with rate = median count rate of data. |
 |
 |
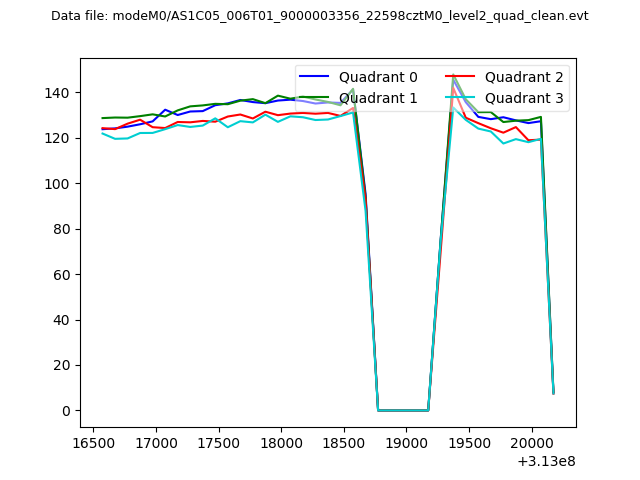
| Quadrant-wise count rates Data is divided into 100 sec bins |
 |
|
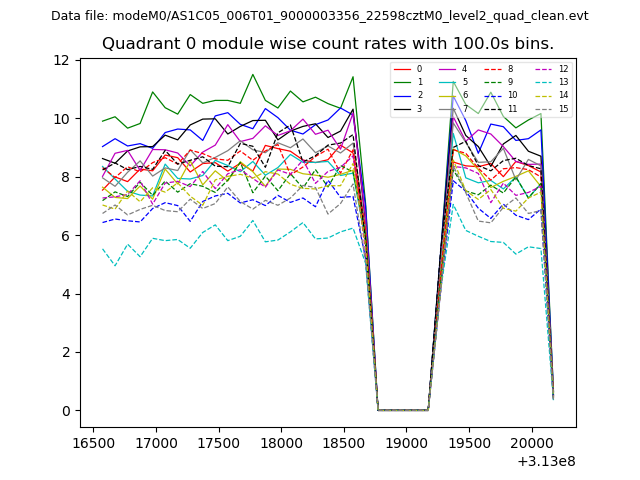
| Module-wise count rates for Quadrant A Data is divided into 100 sec bins |
 |
 |
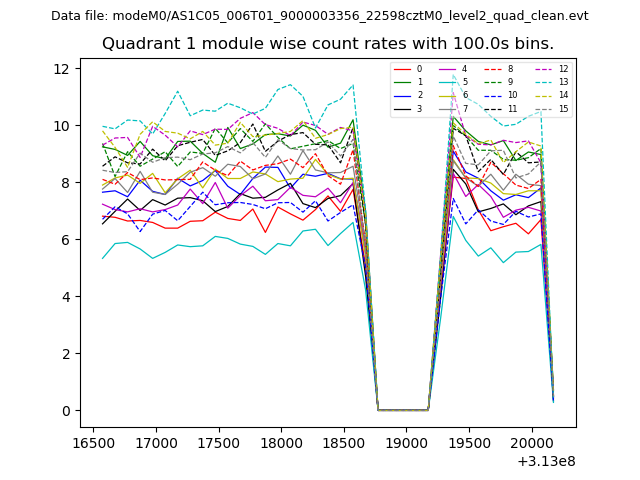
| Module-wise count rates for Quadrant B Data is divided into 100 sec bins |
 |
 |
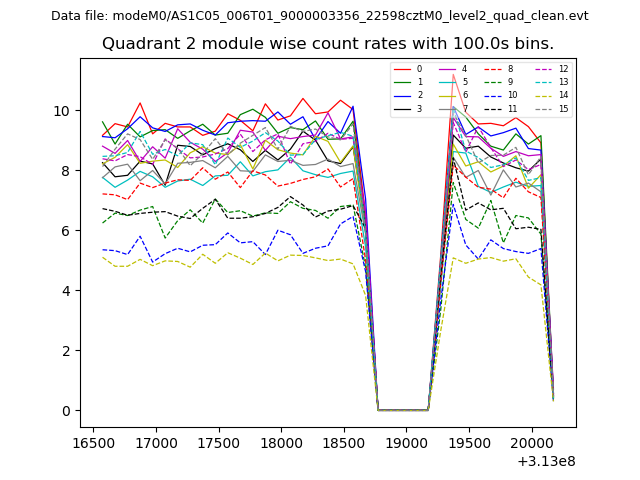
| Module-wise count rates for Quadrant C Data is divided into 100 sec bins |
 |
 |
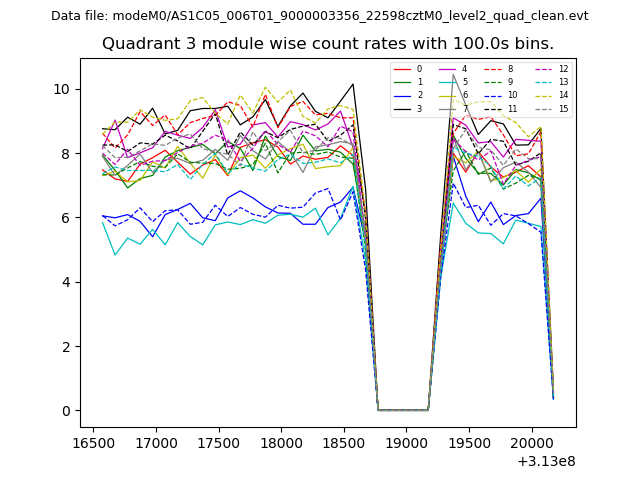
| Module-wise count rates for Quadrant D Data is divided into 100 sec bins |
 |
 |
| Parameter | Plot |
|---|---|
| CZT HV Monitor | 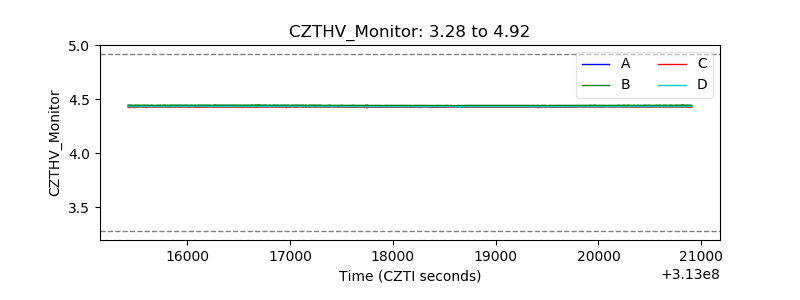 |
| D_VDD | 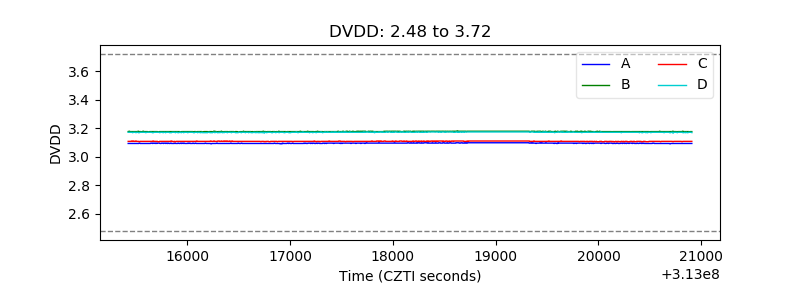 |
| Temperature 1 |  |
| Veto HV Monitor | 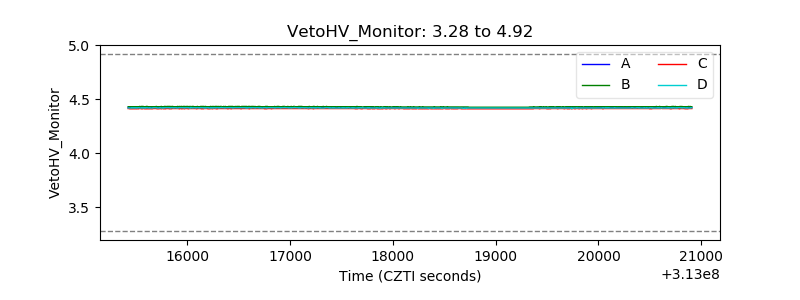 |
| Veto LLD | 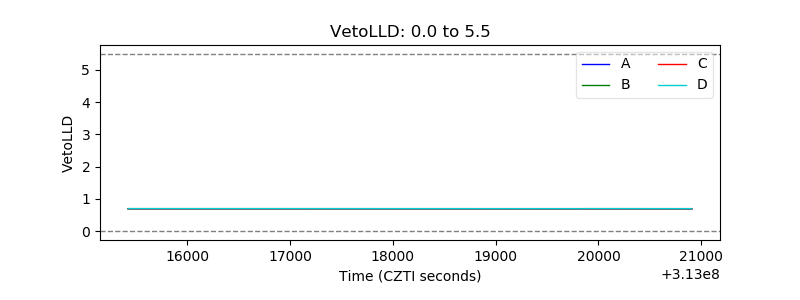 |
| Alpha Counter | 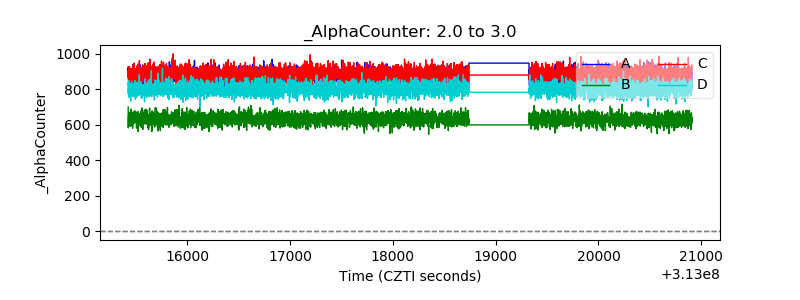 |
| _CPM_Rate | 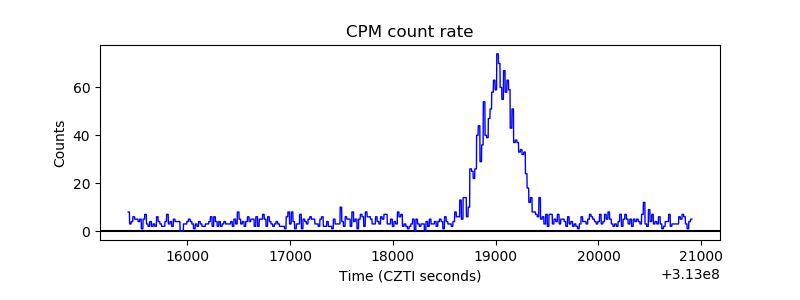 |
| CZT Counter | 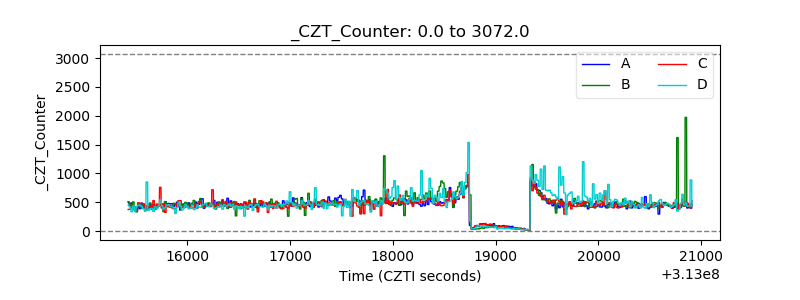 |
| +2.5 Volts monitor |  |
| +5 Volts monitor | 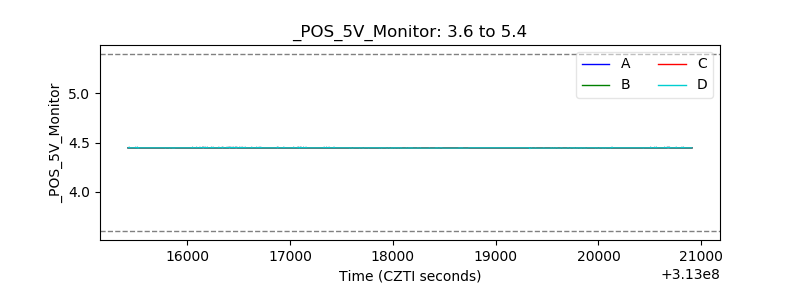 |
| _ROLL_ROT | 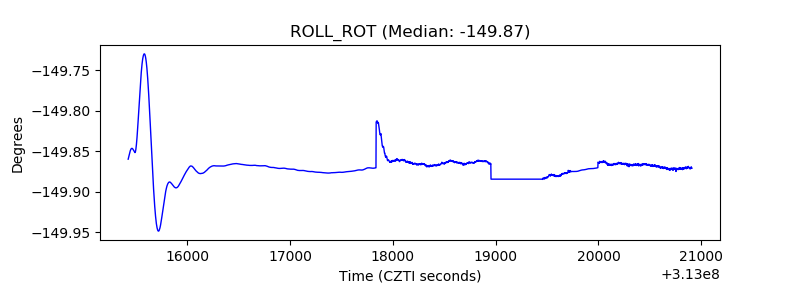 |
| _Roll_DEC | 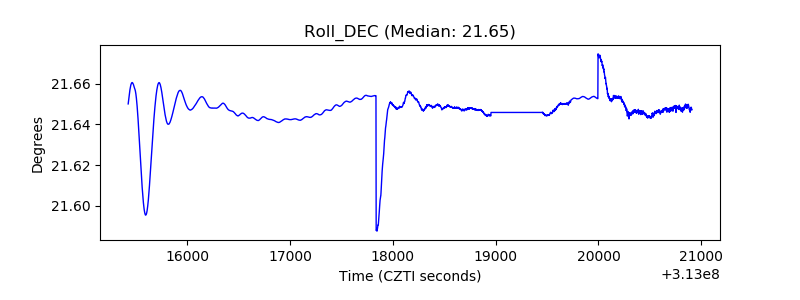 |
| _Roll_RA | 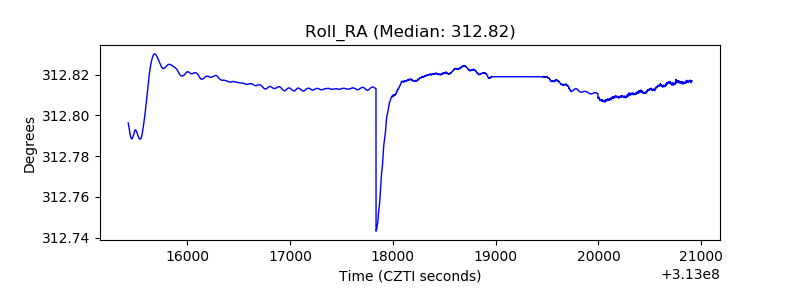 |
| Veto Counter | 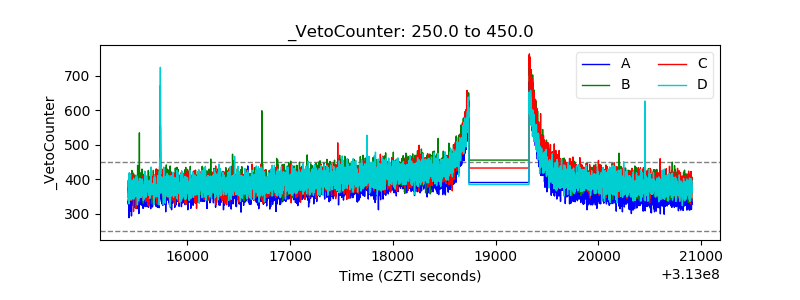 |