| Param | Original file | Final file |
|---|---|---|
| Filename | modeM0/AS1C05_006T01_9000003356_22600cztM0_level2.evt | modeM0/AS1C05_006T01_9000003356_22600cztM0_level2_quad_clean.evt |
| Size (bytes) | 968,667,840 | 165,133,440 |
| Size | 923.8 MB | 157.5 MB |
| Events in quadrant A | 7,392,556 | 1,019,872 |
| Events in quadrant B | 7,120,893 | 1,034,575 |
| Events in quadrant C | 6,862,275 | 995,257 |
| Events in quadrant D | 7,013,631 | 985,278 |
| Mode SS | |||
|---|---|---|---|
| Quadrant | BADHDUFLAG | Total packets | Discarded packets |
| A | 0 | 286 | 0 |
| B | 0 | 286 | 0 |
| C | 0 | 286 | 0 |
| D | 0 | 286 | 0 |
| Mode M0 | |||
|---|---|---|---|
| Quadrant | BADHDUFLAG | Total packets | Discarded packets |
| A | 0 | 31202 | 3 |
| B | 0 | 30199 | 3 |
| C | 0 | 29093 | 3 |
| D | 0 | 30512 | 3 |
| Mode M9 | |||
|---|---|---|---|
| Quadrant | BADHDUFLAG | Total packets | Discarded packets |
| A | 0 | 12 | 0 |
| B | 0 | 12 | 0 |
| C | 0 | 12 | 0 |
| D | 0 | 12 | 0 |
| Quadrant | Total seconds | Saturated seconds | Saturation percentage |
|---|---|---|---|
| A | 13987 | 355 | 2.538071% |
| B | 13988 | 328 | 2.344867% |
| C | 13988 | 263 | 1.880183% |
| D | 13987 | 140 | 1.000929% |
Noise dominated data is calculated using 1-second bins in cleaned event files. If a bin has >2000 counts, and if more than 50% of those come from <1% of pixels, then it is considered to be noise-dominated and hence unusable.
| Quadrant | # 1 sec bins | Bins with >0 counts | Bins with >2000 counts | High rate bins dominated by noise | Noise dominated (total time) | Noise dominated (detector-on time) | Marked lightcurve |
|---|---|---|---|---|---|---|---|
| A | 15162 | 13990 | 149 | 149 | 0.98% | 1.07% | 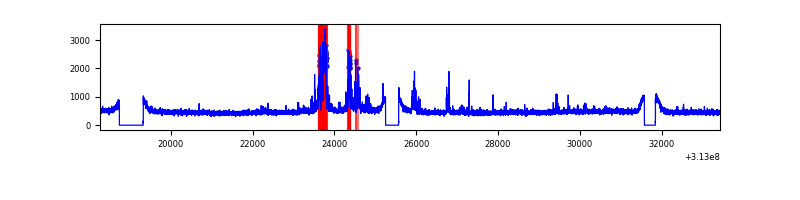 |
| B | 15163 | 13991 | 25 | 25 | 0.16% | 0.18% | 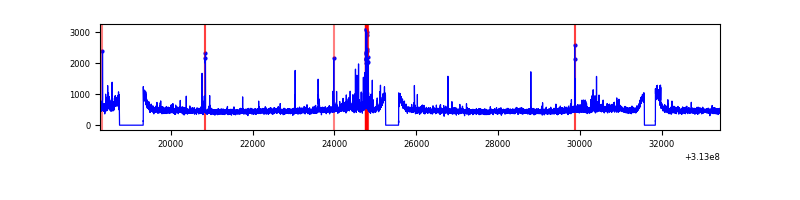 |
| C | 15163 | 13991 | 5 | 5 | 0.03% | 0.04% | 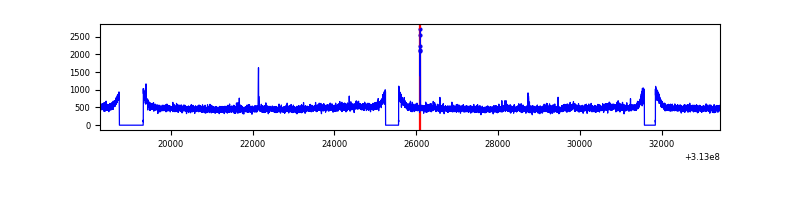 |
| D | 15162 | 13990 | 30 | 30 | 0.20% | 0.21% | 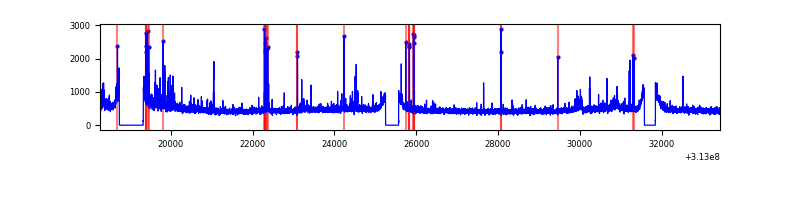 |
Top three noisy pixels from each quadrant. If the there are fewer than three noisy pixels in the level2.evt file, extra rows are filled as -1
| Pixel properties | Quadrant properties | ||||||
|---|---|---|---|---|---|---|---|
| Quadrant | DetID | PixID | Counts | Sigma | Mean | Median | Sigma |
| A | 14 | 238 | 558868 | 1618.99 | 1710 | 1671 | 344.2 |
| A | 14 | 235 | 237863 | 686.28 | 1710 | 1671 | 344.2 |
| A | 13 | 254 | 24413 | 66.08 | 1710 | 1671 | 344.2 |
| B | 0 | 245 | 138707 | 418.45 | 1710 | 1665 | 327.5 |
| B | 0 | 229 | 133495 | 402.54 | 1710 | 1665 | 327.5 |
| B | 12 | 111 | 40006 | 117.07 | 1710 | 1665 | 327.5 |
| C | 14 | 238 | 257713 | 659.19 | 1649 | 1658 | 388.4 |
| C | 10 | 222 | 102493 | 259.59 | 1649 | 1658 | 388.4 |
| C | 10 | 22 | 47891 | 119.02 | 1649 | 1658 | 388.4 |
| D | 1 | 239 | 250812 | 599.31 | 1680 | 1631 | 415.8 |
| D | 1 | 52 | 155569 | 370.24 | 1680 | 1631 | 415.8 |
| D | 12 | 227 | 102795 | 243.31 | 1680 | 1631 | 415.8 |
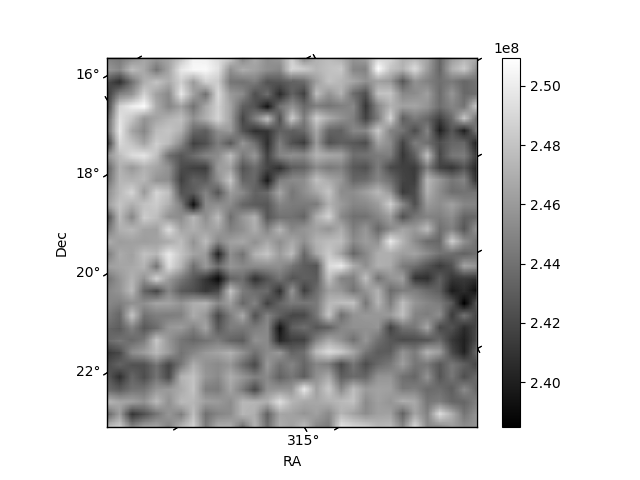
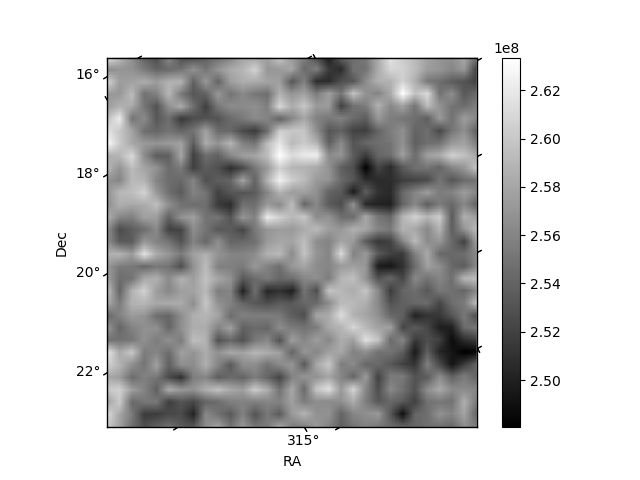
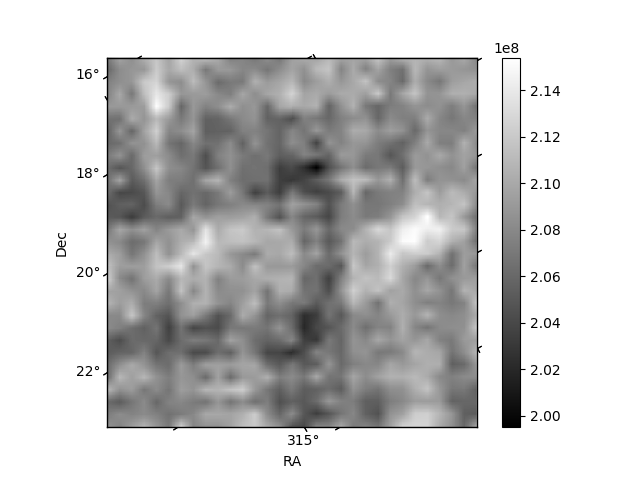
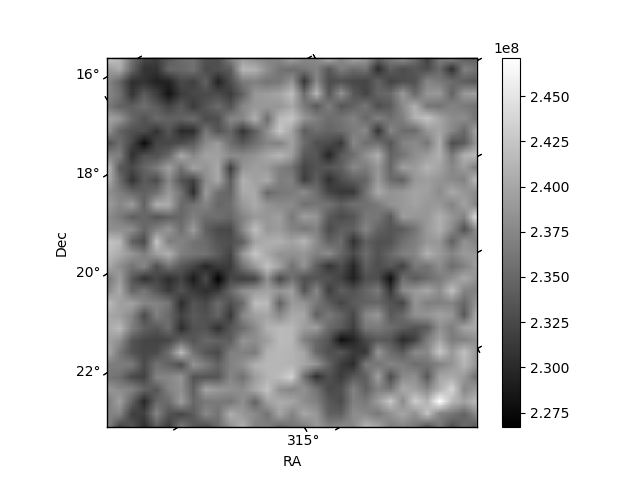
Histogram calculated using DETX and DETY for each event in the final _common_clean file
| Quadrant A | 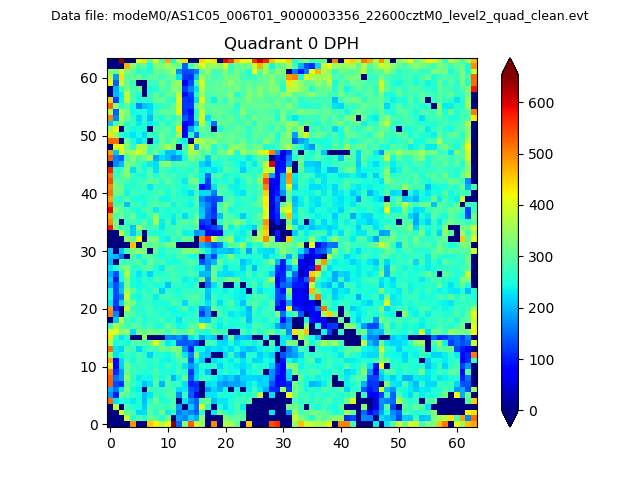 |
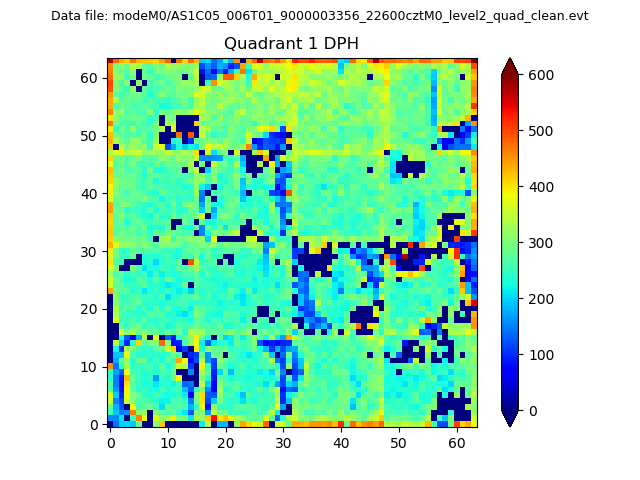 |
Quadrant B |
|---|---|---|---|
| Quadrant D | 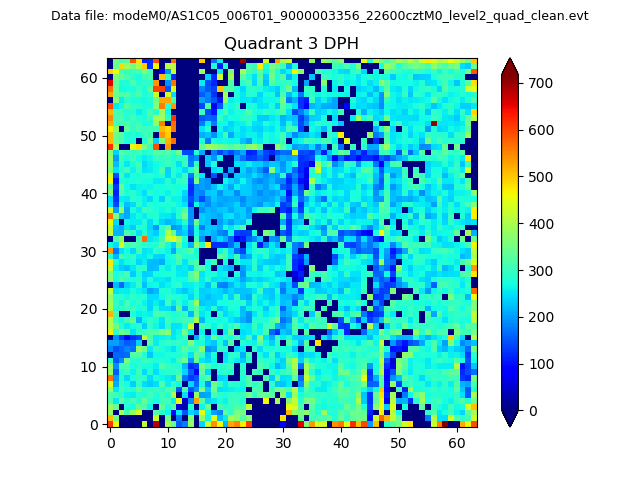 |
 |
Quadrant C |
| Plot type | Count rate plots | Images |
|---|---|---|
| Comparison with Poisson distribution Blue bars denote a histogram of data divided into 1 sec bins. Red curve is a Poisson curve with rate = median count rate of data. |
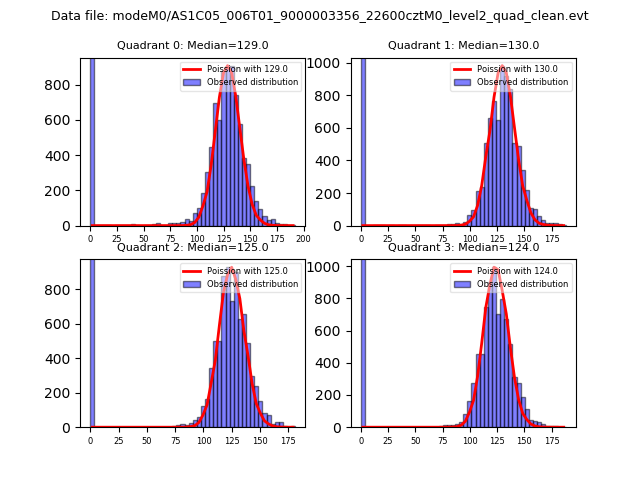 |
 |
| Quadrant-wise count rates Data is divided into 100 sec bins |
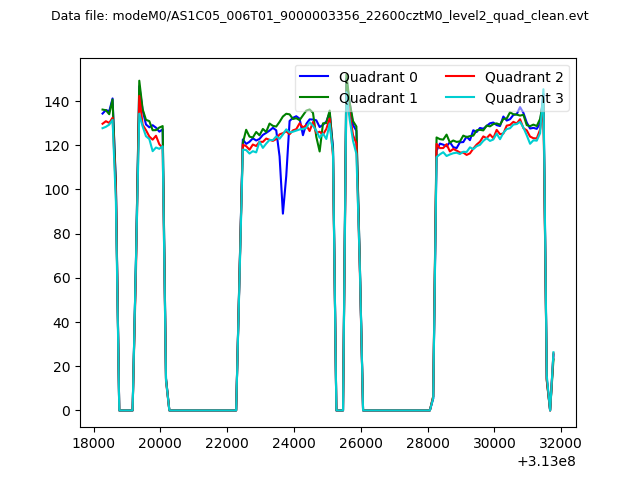 |
|
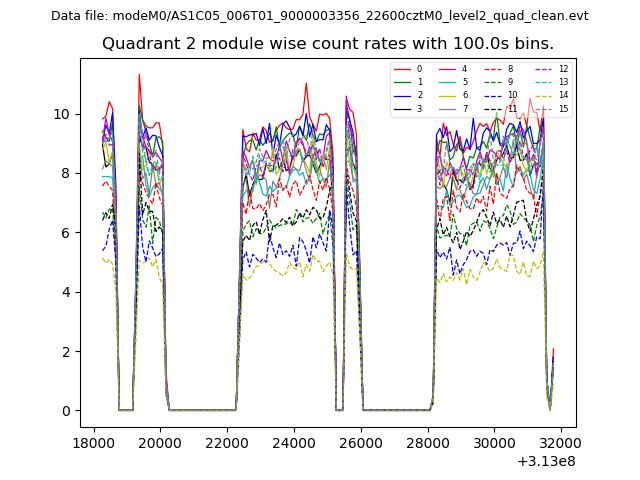
| Module-wise count rates for Quadrant A Data is divided into 100 sec bins |
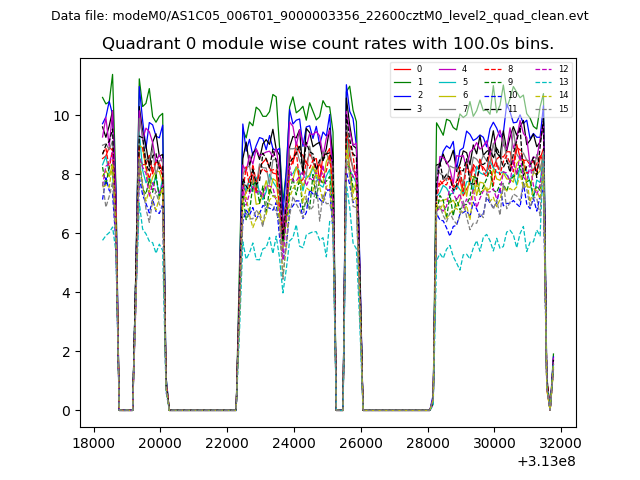 |
 |
| Module-wise count rates for Quadrant B Data is divided into 100 sec bins |
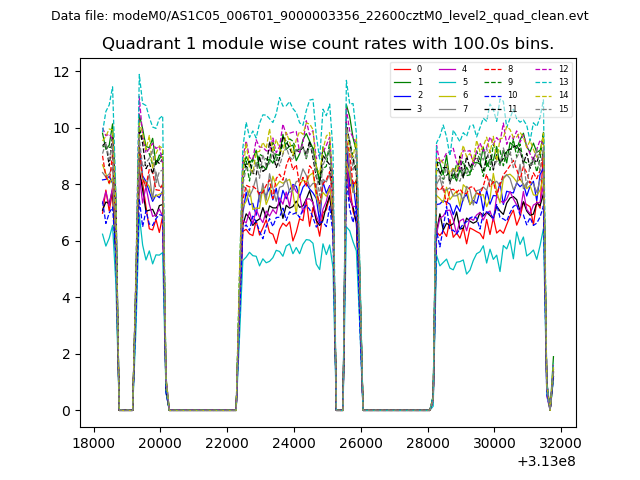 |
 |
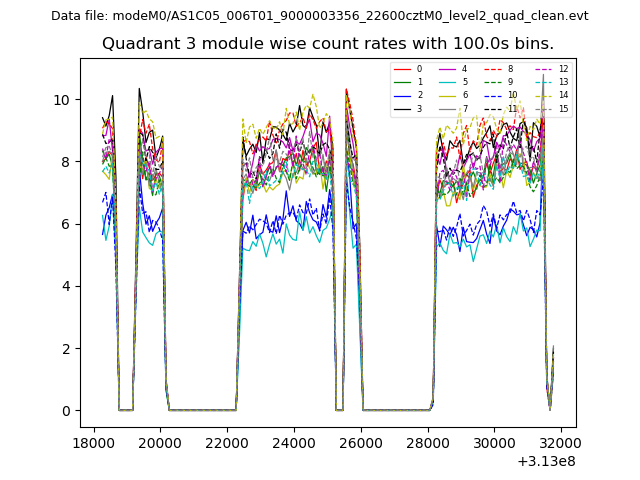
| Module-wise count rates for Quadrant C Data is divided into 100 sec bins |
 |
 |
| Module-wise count rates for Quadrant D Data is divided into 100 sec bins |
 |
 |
| Parameter | Plot |
|---|---|
| CZT HV Monitor | 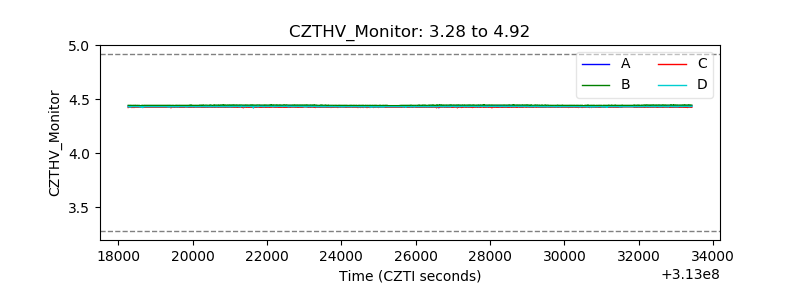 |
| D_VDD | 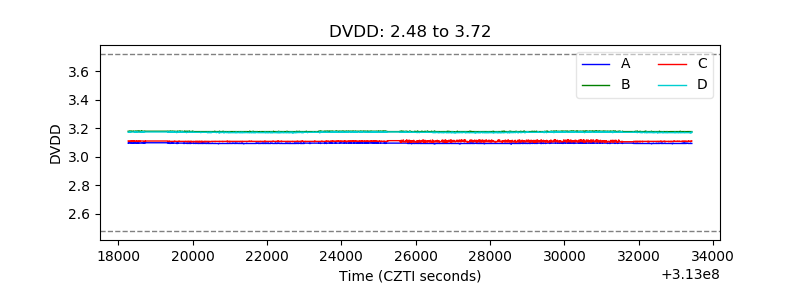 |
| Temperature 1 | 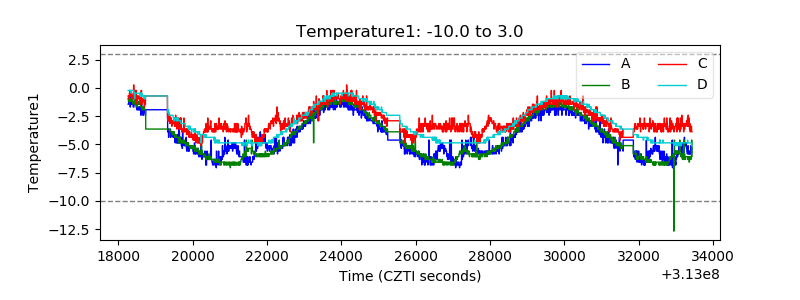 |
| Veto HV Monitor | 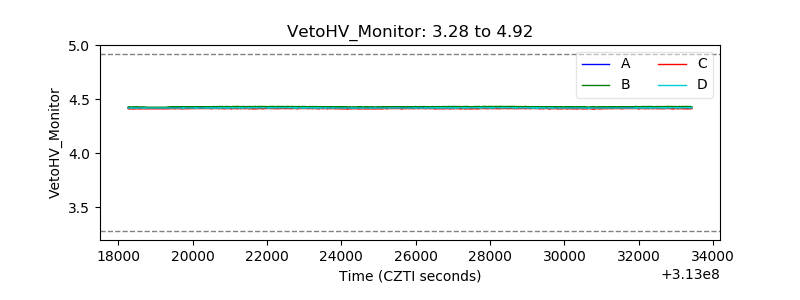 |
| Veto LLD | 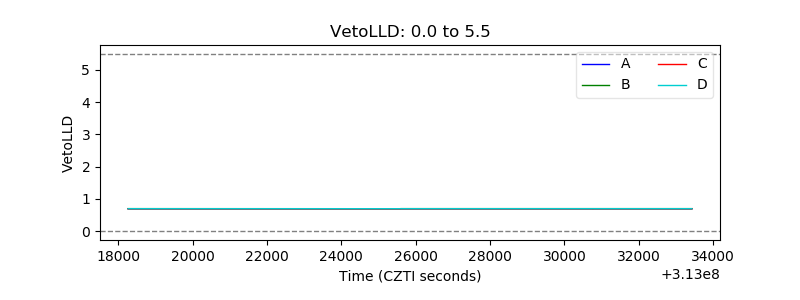 |
| Alpha Counter | 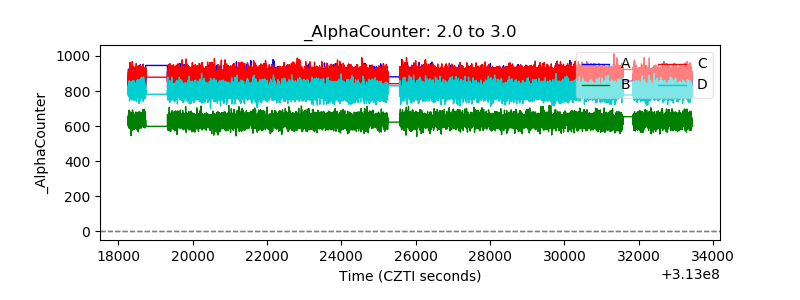 |
| _CPM_Rate | 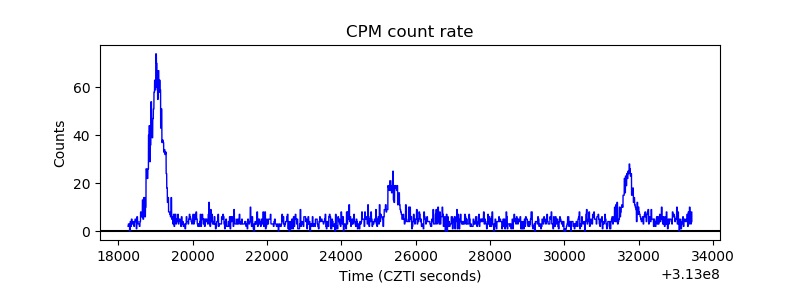 |
| CZT Counter |  |
| +2.5 Volts monitor |  |
| +5 Volts monitor | 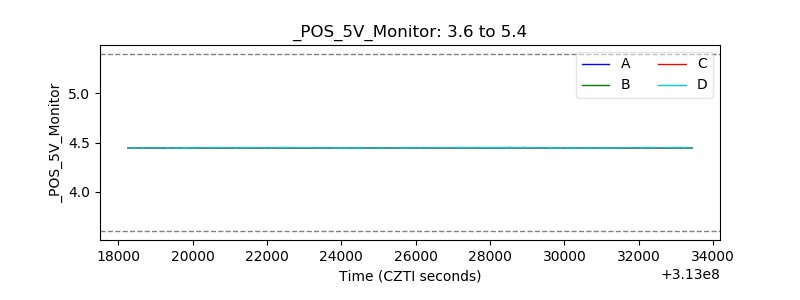 |
| _ROLL_ROT | 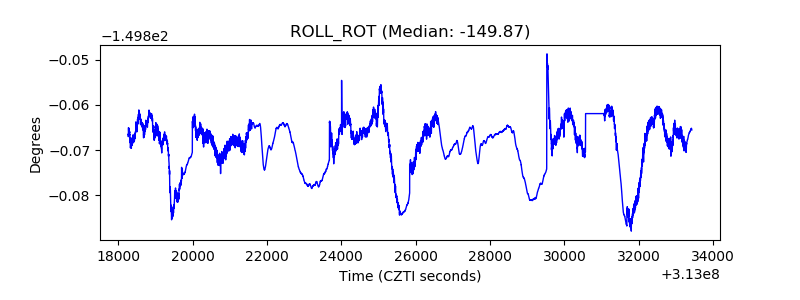 |
| _Roll_DEC | 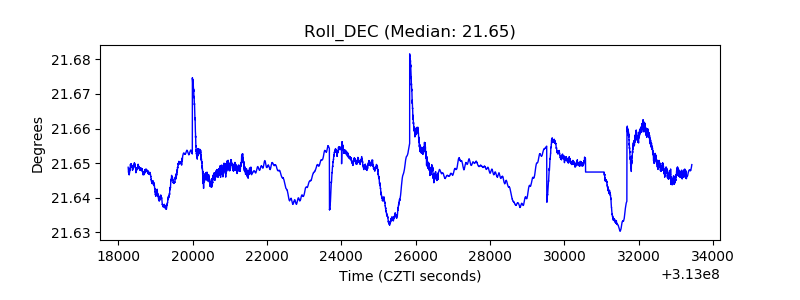 |
| _Roll_RA | 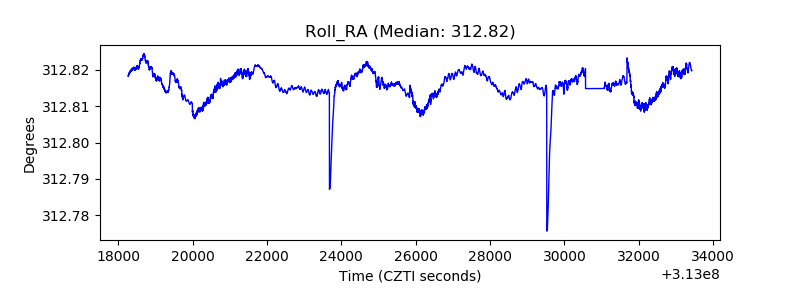 |
| Veto Counter | 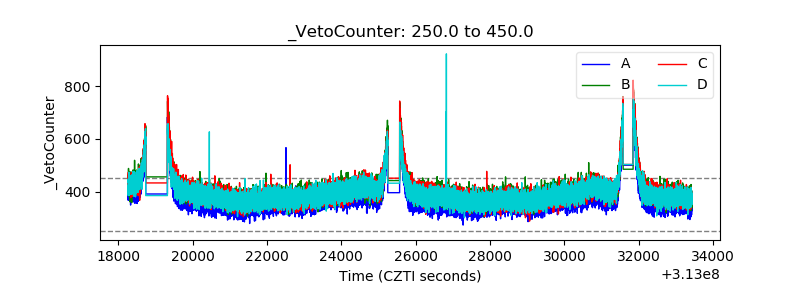 |