| Param | Original file | Final file |
|---|---|---|
| Filename | modeM0/AS1C05_006T01_9000003356_22606cztM0_level2.evt | modeM0/AS1C05_006T01_9000003356_22606cztM0_level2_quad_clean.evt |
| Size (bytes) | 429,940,800 | 101,793,600 |
| Size | 410.0 MB | 97.1 MB |
| Events in quadrant A | 3,029,800 | 681,851 |
| Events in quadrant B | 3,100,806 | 690,840 |
| Events in quadrant C | 3,044,255 | 643,136 |
| Events in quadrant D | 3,428,196 | 638,165 |
| Mode SS | |||
|---|---|---|---|
| Quadrant | BADHDUFLAG | Total packets | Discarded packets |
| A | 0 | 124 | 0 |
| B | 0 | 124 | 0 |
| C | 0 | 124 | 0 |
| D | 0 | 124 | 0 |
| Mode M0 | |||
|---|---|---|---|
| Quadrant | BADHDUFLAG | Total packets | Discarded packets |
| A | 0 | 12962 | 1 |
| B | 0 | 13154 | 1 |
| C | 0 | 12833 | 1 |
| D | 0 | 14007 | 2 |
| Mode M9 | |||
|---|---|---|---|
| Quadrant | BADHDUFLAG | Total packets | Discarded packets |
| A | 0 | 11 | 0 |
| B | 0 | 11 | 0 |
| C | 0 | 11 | 0 |
| D | 0 | 11 | 0 |
| Quadrant | Total seconds | Saturated seconds | Saturation percentage |
|---|---|---|---|
| A | 6147 | 65 | 1.057426% |
| B | 6147 | 68 | 1.106231% |
| C | 6147 | 92 | 1.496665% |
| D | 6147 | 58 | 0.943550% |
Noise dominated data is calculated using 1-second bins in cleaned event files. If a bin has >2000 counts, and if more than 50% of those come from <1% of pixels, then it is considered to be noise-dominated and hence unusable.
| Quadrant | # 1 sec bins | Bins with >0 counts | Bins with >2000 counts | High rate bins dominated by noise | Noise dominated (total time) | Noise dominated (detector-on time) | Marked lightcurve |
|---|---|---|---|---|---|---|---|
| A | 7222 | 6148 | 1 | 1 | 0.01% | 0.02% | 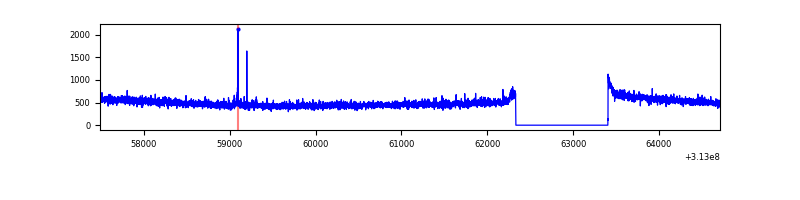 |
| B | 7222 | 6148 | 0 | 0 | 0.00% | 0.00% | 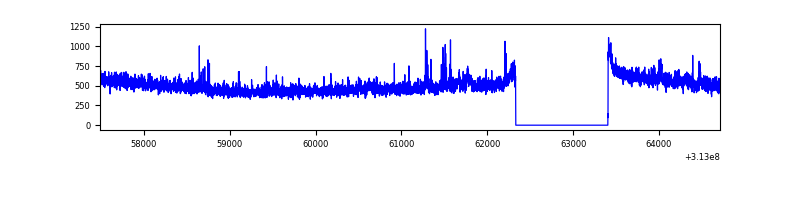 |
| C | 7222 | 6148 | 0 | 0 | 0.00% | 0.00% | 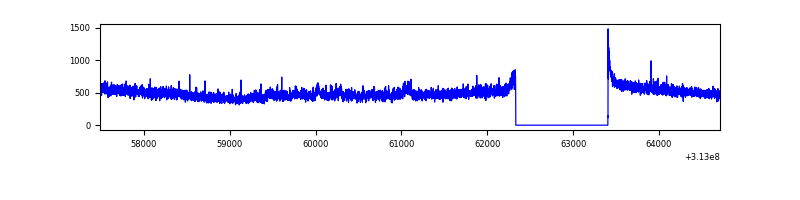 |
| D | 7222 | 6148 | 3 | 3 | 0.04% | 0.05% | 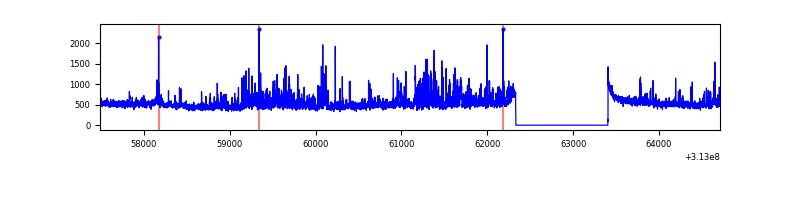 |
Top three noisy pixels from each quadrant. If the there are fewer than three noisy pixels in the level2.evt file, extra rows are filled as -1
| Pixel properties | Quadrant properties | ||||||
|---|---|---|---|---|---|---|---|
| Quadrant | DetID | PixID | Counts | Sigma | Mean | Median | Sigma |
| A | 14 | 238 | 18471 | 112.67 | 780 | 767 | 157.1 |
| A | 13 | 254 | 9864 | 57.89 | 780 | 767 | 157.1 |
| A | 0 | 226 | 6916 | 39.13 | 780 | 767 | 157.1 |
| B | 0 | 229 | 33634 | 222.94 | 771 | 753 | 147.5 |
| B | 0 | 197 | 19737 | 128.71 | 771 | 753 | 147.5 |
| B | 12 | 111 | 17546 | 113.86 | 771 | 753 | 147.5 |
| C | 14 | 238 | 117311 | 683.09 | 731 | 735 | 170.7 |
| C | 10 | 222 | 64508 | 373.68 | 731 | 735 | 170.7 |
| C | 10 | 22 | 5314 | 26.83 | 731 | 735 | 170.7 |
| D | 1 | 52 | 459495 | 2502.72 | 752 | 730 | 183.3 |
| D | 12 | 227 | 84029 | 454.43 | 752 | 730 | 183.3 |
| D | 2 | 234 | 23890 | 126.35 | 752 | 730 | 183.3 |
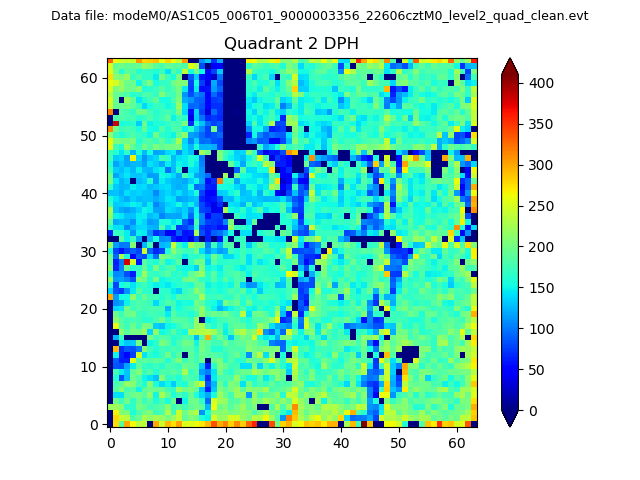
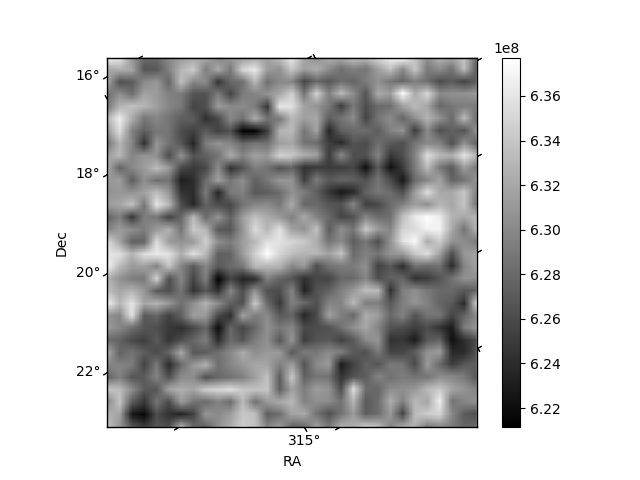
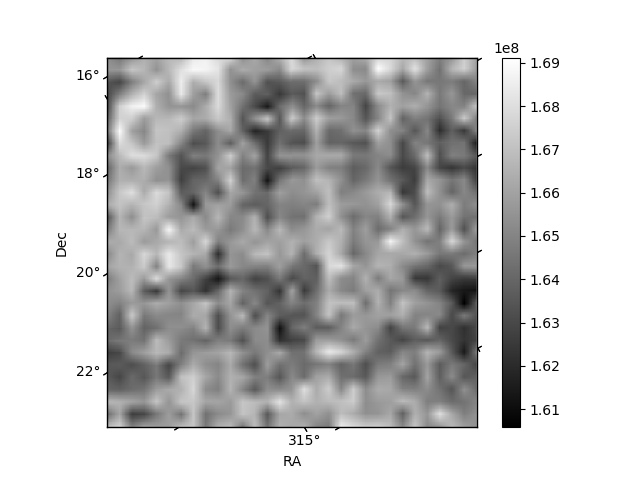
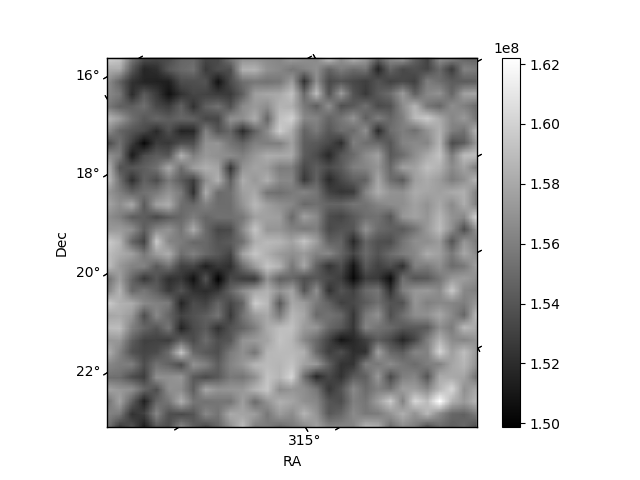
Histogram calculated using DETX and DETY for each event in the final _common_clean file
| Quadrant A | 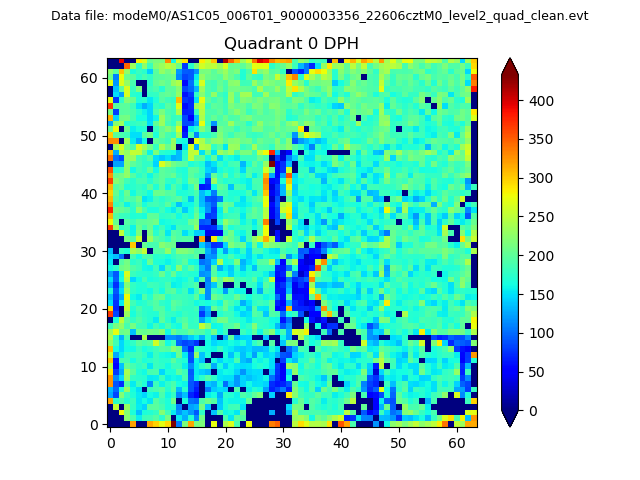 |
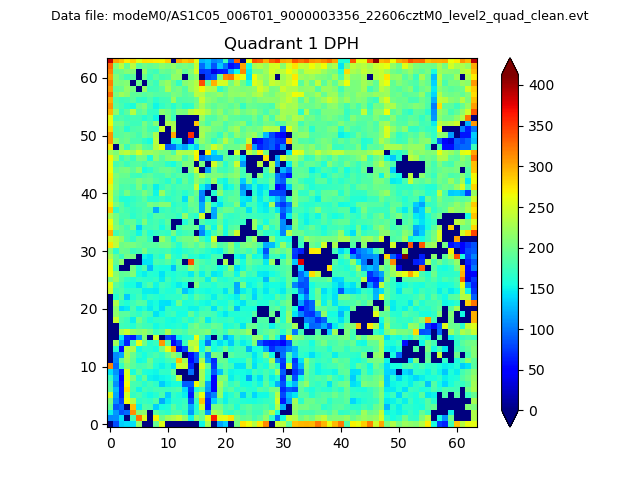 |
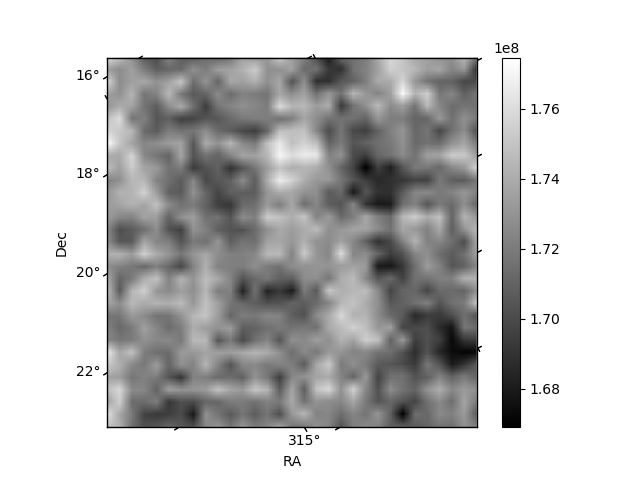
Quadrant B |
|---|---|---|---|
| Quadrant D | 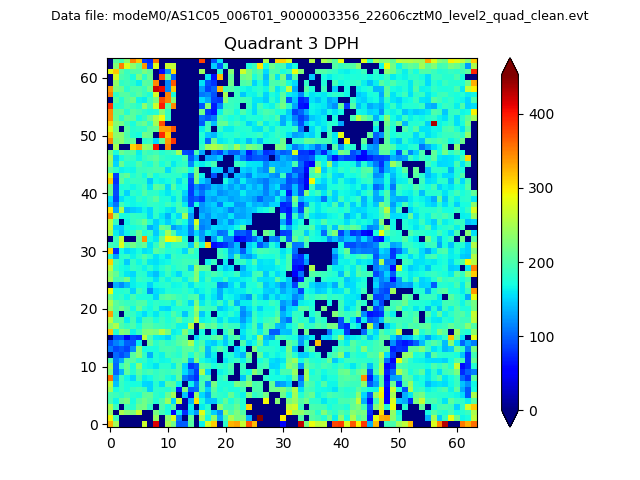 |
 |
Quadrant C |
| Plot type | Count rate plots | Images |
|---|---|---|
| Comparison with Poisson distribution Blue bars denote a histogram of data divided into 1 sec bins. Red curve is a Poisson curve with rate = median count rate of data. |
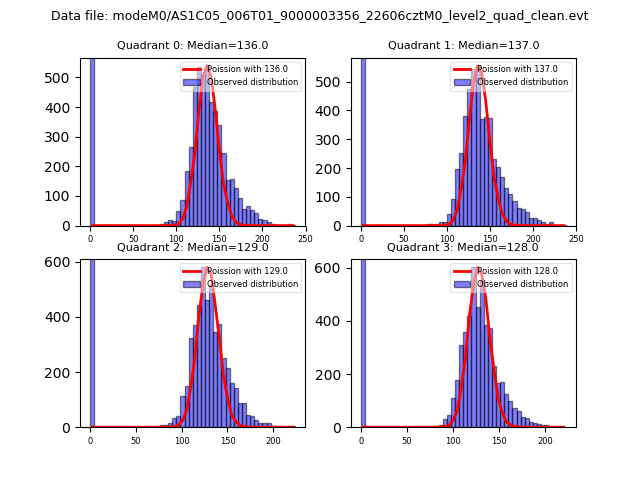 |
 |
| Quadrant-wise count rates Data is divided into 100 sec bins |
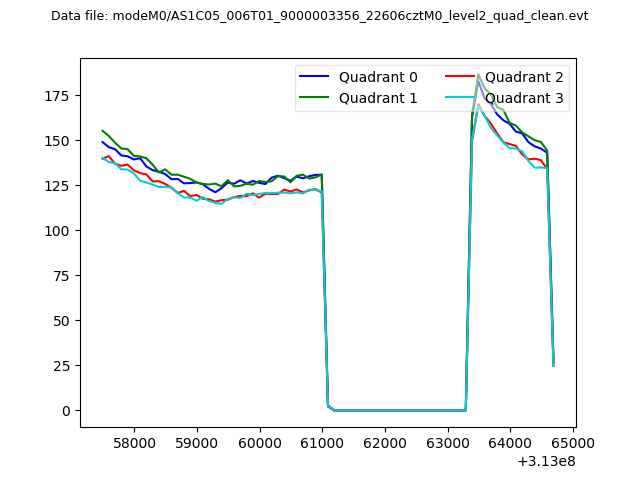 |
|
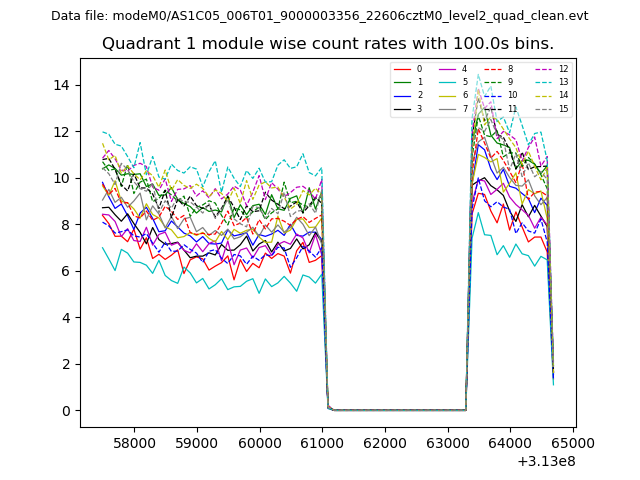
| Module-wise count rates for Quadrant A Data is divided into 100 sec bins |
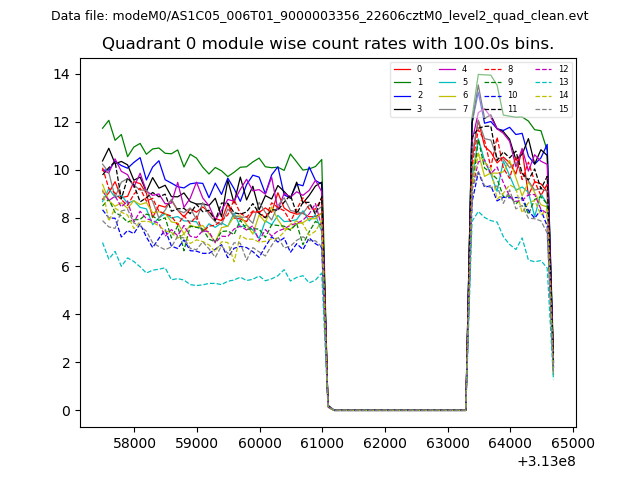 |
 |
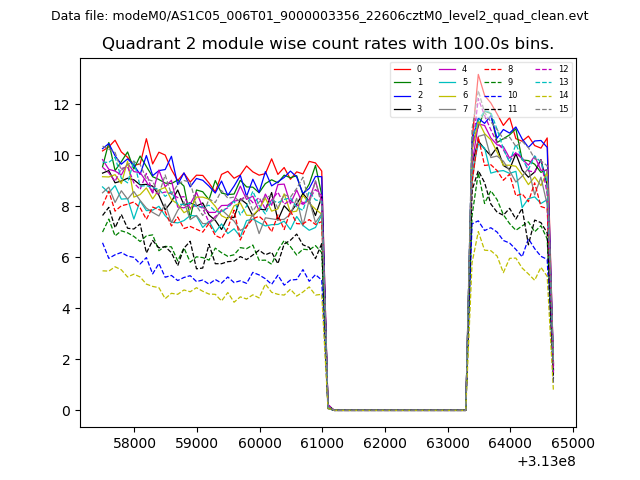
| Module-wise count rates for Quadrant B Data is divided into 100 sec bins |
 |
 |
| Module-wise count rates for Quadrant C Data is divided into 100 sec bins |
 |
 |
| Module-wise count rates for Quadrant D Data is divided into 100 sec bins |
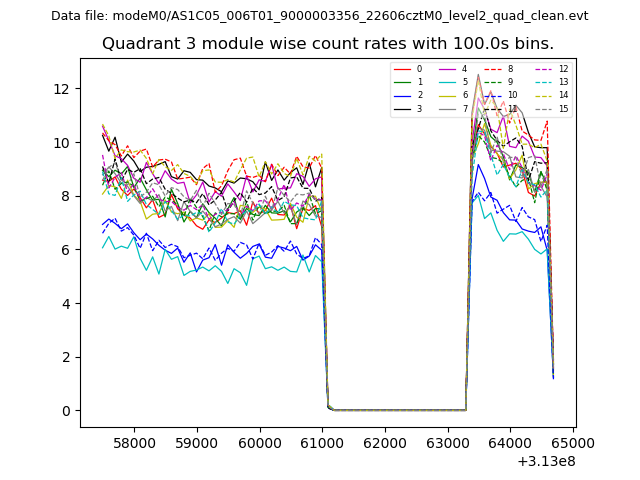 |
 |
| Parameter | Plot |
|---|---|
| CZT HV Monitor | 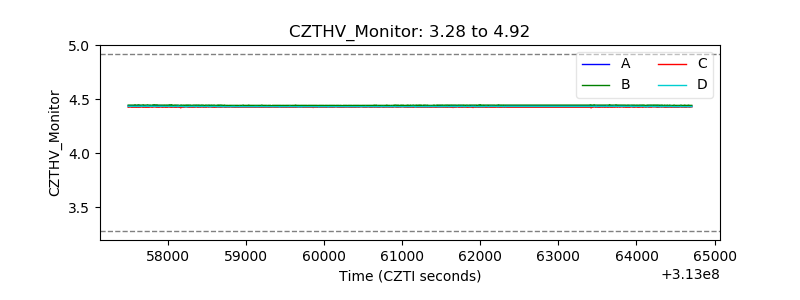 |
| D_VDD | 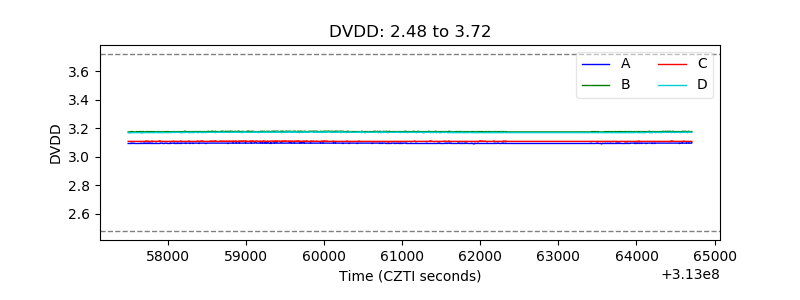 |
| Temperature 1 | 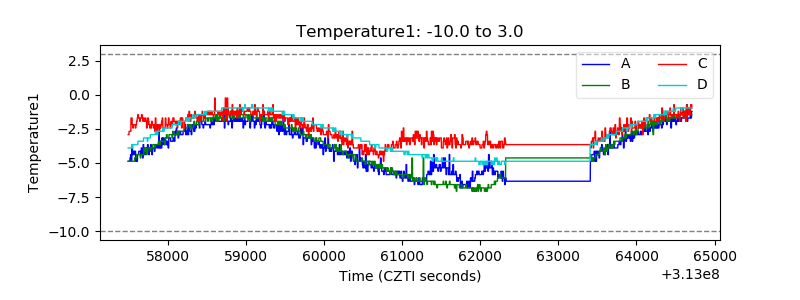 |
| Veto HV Monitor | 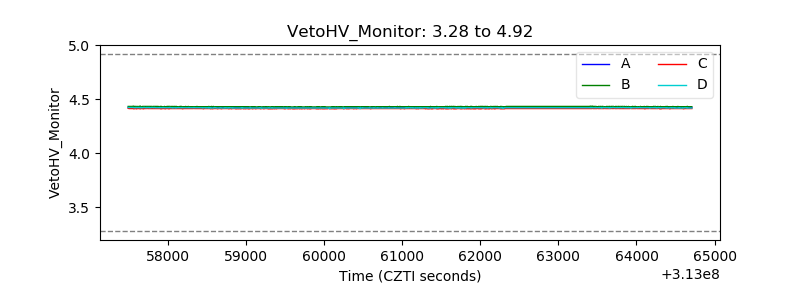 |
| Veto LLD | 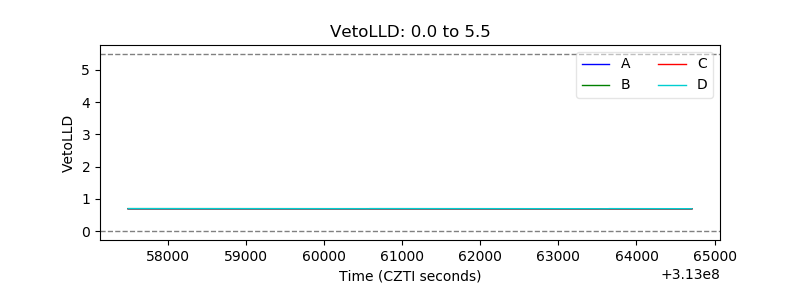 |
| Alpha Counter | 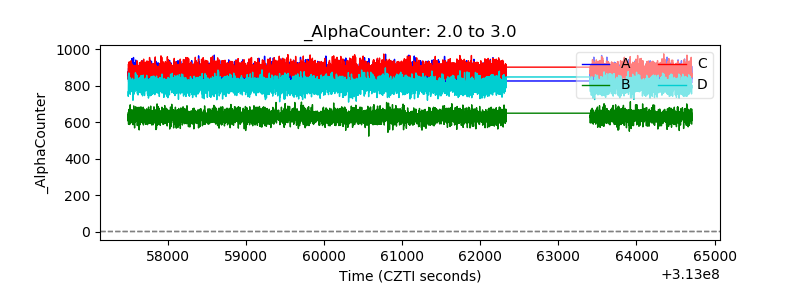 |
| _CPM_Rate | 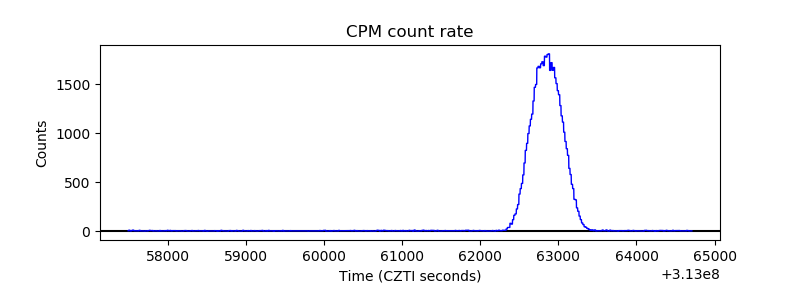 |
| CZT Counter | 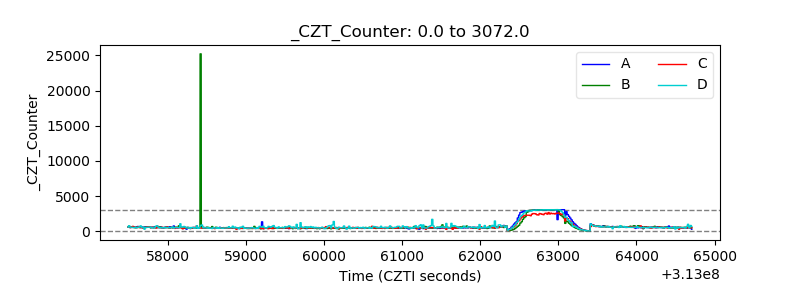 |
| +2.5 Volts monitor | 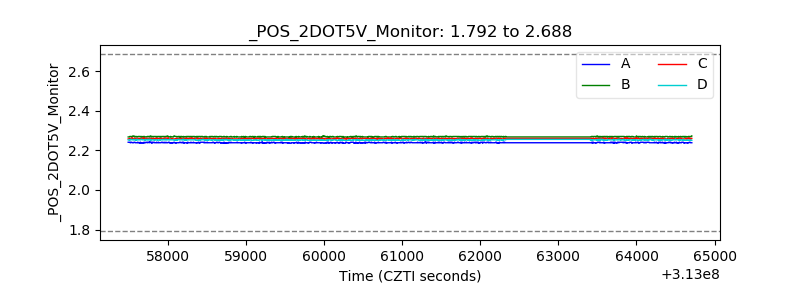 |
| +5 Volts monitor |  |
| _ROLL_ROT | 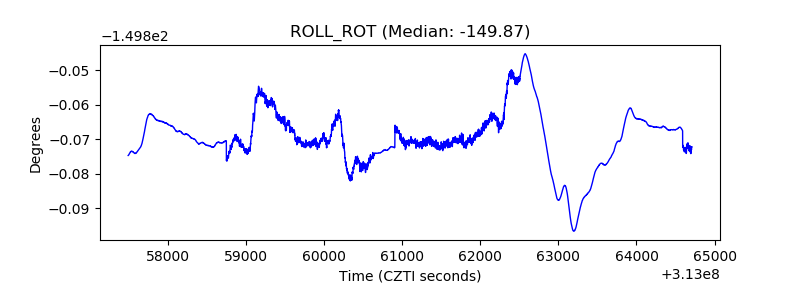 |
| _Roll_DEC | 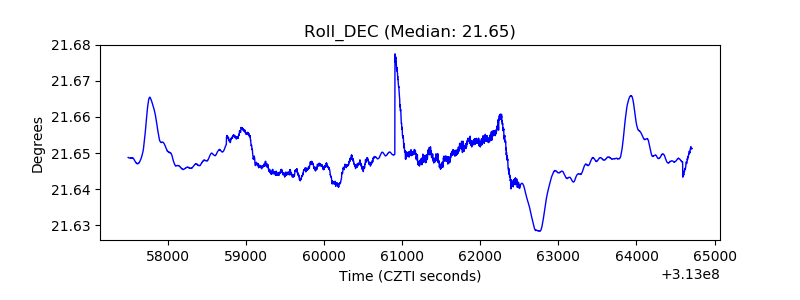 |
| _Roll_RA | 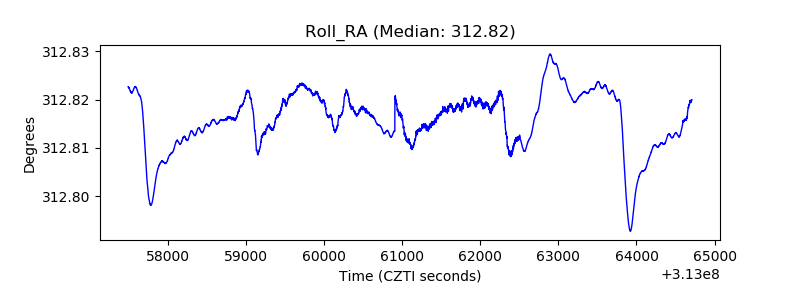 |
| Veto Counter | 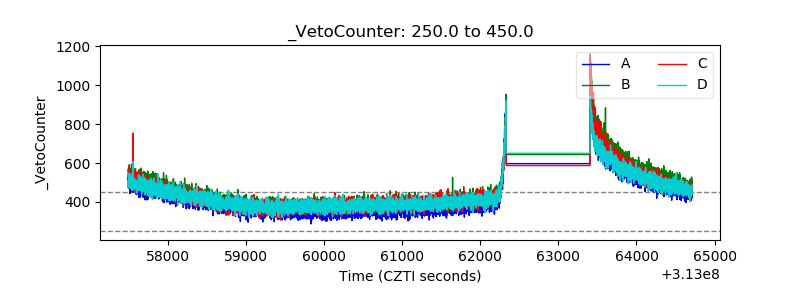 |