| Param | Original file | Final file |
|---|---|---|
| Filename | modeM0/AS1C05_006T01_9000003356_22607cztM0_level2.evt | modeM0/AS1C05_006T01_9000003356_22607cztM0_level2_quad_clean.evt |
| Size (bytes) | 128,232,000 | 38,116,800 |
| Size | 122.3 MB | 36.4 MB |
| Events in quadrant A | 943,821 | 264,658 |
| Events in quadrant B | 955,624 | 270,002 |
| Events in quadrant C | 906,399 | 248,256 |
| Events in quadrant D | 959,225 | 245,992 |
| Mode SS | |||
|---|---|---|---|
| Quadrant | BADHDUFLAG | Total packets | Discarded packets |
| A | 0 | 34 | 0 |
| B | 0 | 34 | 0 |
| C | 0 | 34 | 0 |
| D | 0 | 34 | 0 |
| Mode M0 | |||
|---|---|---|---|
| Quadrant | BADHDUFLAG | Total packets | Discarded packets |
| A | 0 | 3878 | 1 |
| B | 0 | 3954 | 1 |
| C | 0 | 3773 | 1 |
| D | 0 | 3905 | 1 |
| Mode M9 | |||
|---|---|---|---|
| Quadrant | BADHDUFLAG | Total packets | Discarded packets |
| A | 0 | 1 | 0 |
| B | 0 | 2 | 0 |
| C | 0 | 2 | 0 |
| D | 0 | 2 | 0 |
| Quadrant | Total seconds | Saturated seconds | Saturation percentage |
|---|---|---|---|
| A | 1705 | 17 | 0.997067% |
| B | 1705 | 16 | 0.938416% |
| C | 1705 | 24 | 1.407625% |
| D | 1705 | 10 | 0.586510% |
Noise dominated data is calculated using 1-second bins in cleaned event files. If a bin has >2000 counts, and if more than 50% of those come from <1% of pixels, then it is considered to be noise-dominated and hence unusable.
| Quadrant | # 1 sec bins | Bins with >0 counts | Bins with >2000 counts | High rate bins dominated by noise | Noise dominated (total time) | Noise dominated (detector-on time) | Marked lightcurve |
|---|---|---|---|---|---|---|---|
| A | 1705 | 1705 | 0 | 0 | 0.00% | 0.00% | 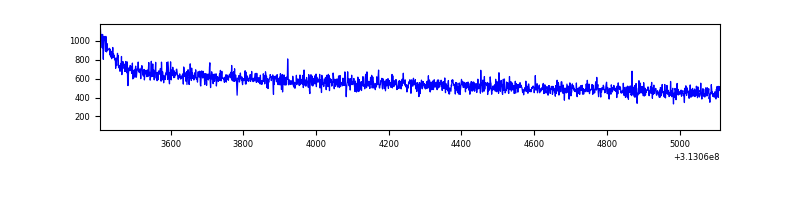 |
| B | 1705 | 1705 | 0 | 0 | 0.00% | 0.00% | 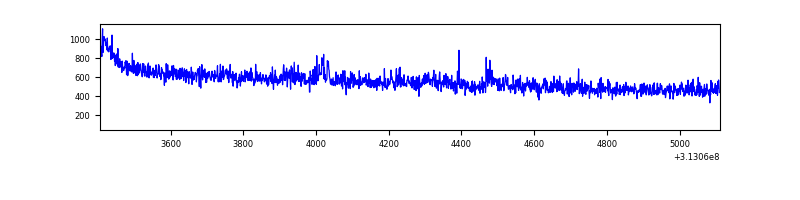 |
| C | 1705 | 1705 | 0 | 0 | 0.00% | 0.00% | 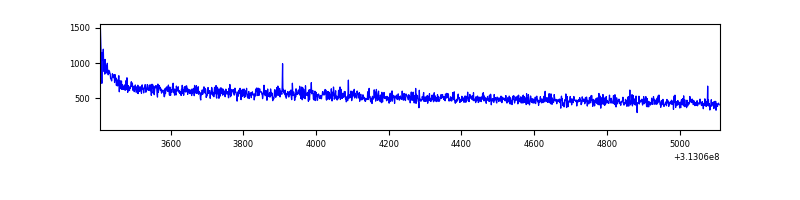 |
| D | 1705 | 1705 | 0 | 0 | 0.00% | 0.00% | 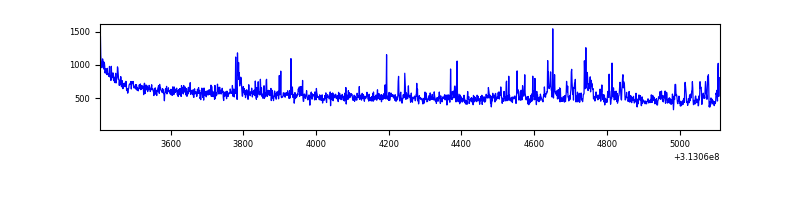 |
Top three noisy pixels from each quadrant. If the there are fewer than three noisy pixels in the level2.evt file, extra rows are filled as -1
| Pixel properties | Quadrant properties | ||||||
|---|---|---|---|---|---|---|---|
| Quadrant | DetID | PixID | Counts | Sigma | Mean | Median | Sigma |
| A | 13 | 254 | 2955 | 53.91 | 244 | 240 | 50.4 |
| A | 0 | 226 | 2197 | 38.86 | 244 | 240 | 50.4 |
| A | 3 | 137 | 1953 | 34.01 | 244 | 240 | 50.4 |
| B | 0 | 229 | 7529 | 154.39 | 238 | 233 | 47.3 |
| B | 0 | 197 | 6318 | 128.77 | 238 | 233 | 47.3 |
| B | 12 | 111 | 5287 | 106.95 | 238 | 233 | 47.3 |
| C | 14 | 238 | 34881 | 653.17 | 221 | 222 | 53.1 |
| C | 10 | 22 | 4702 | 84.43 | 221 | 222 | 53.1 |
| C | 0 | 10 | 2589 | 44.61 | 221 | 222 | 53.1 |
| D | 1 | 52 | 52123 | 896.99 | 231 | 224 | 57.9 |
| D | 12 | 0 | 17686 | 301.8 | 231 | 224 | 57.9 |
| D | 12 | 227 | 8801 | 148.24 | 231 | 224 | 57.9 |
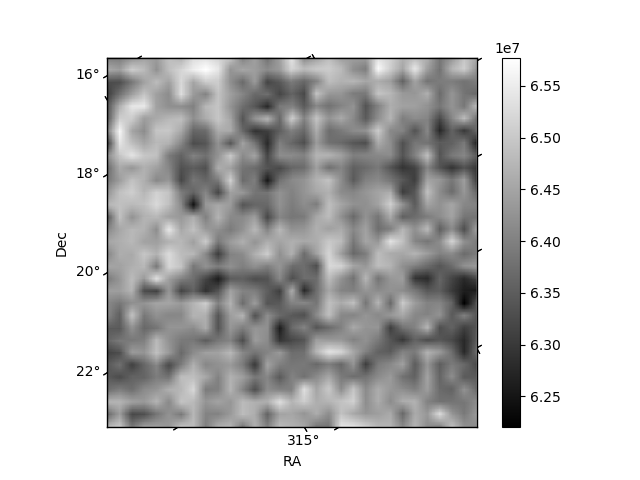
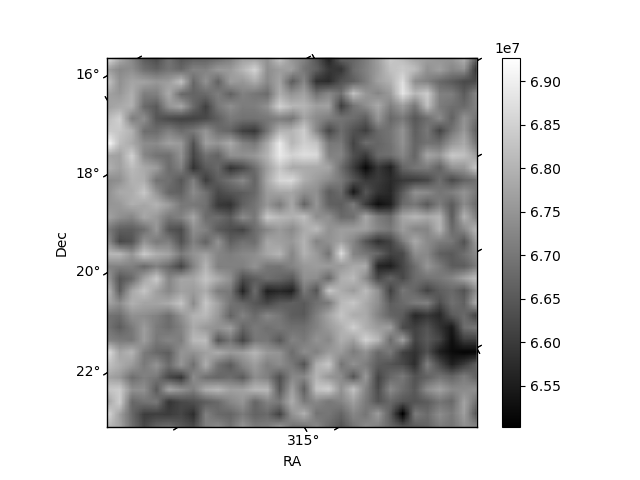
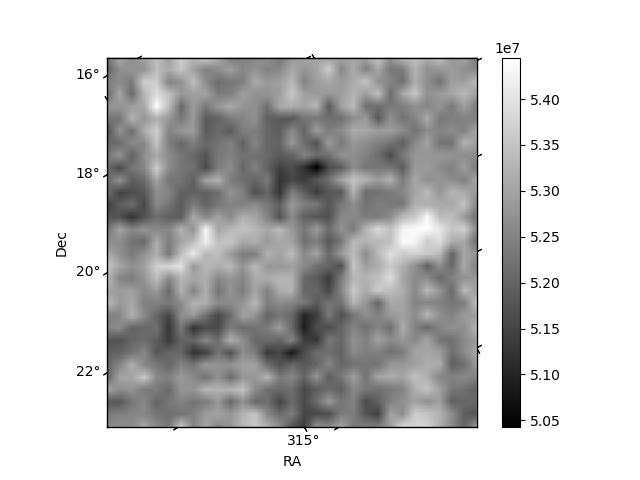
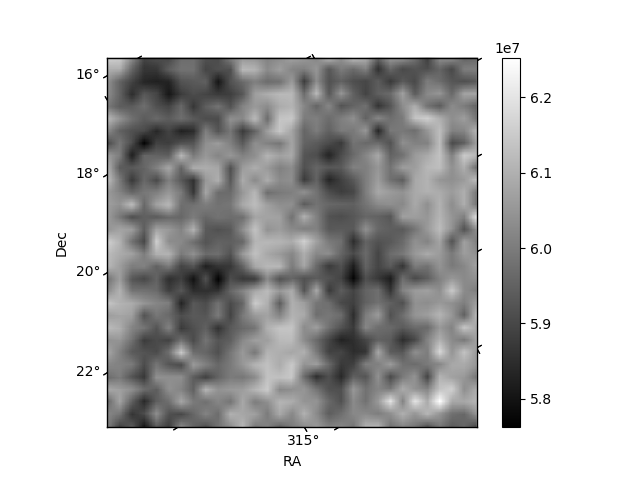
Histogram calculated using DETX and DETY for each event in the final _common_clean file
| Quadrant A | 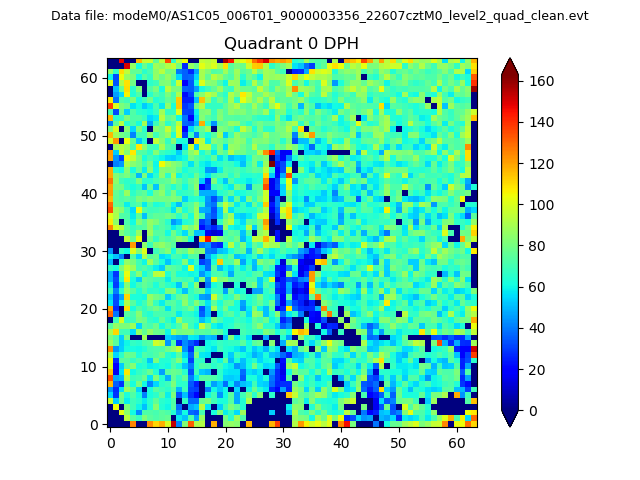 |
 |
Quadrant B |
|---|---|---|---|
| Quadrant D | 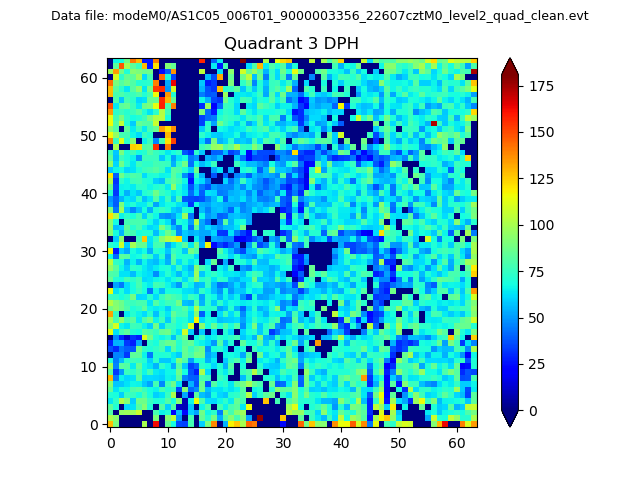 |
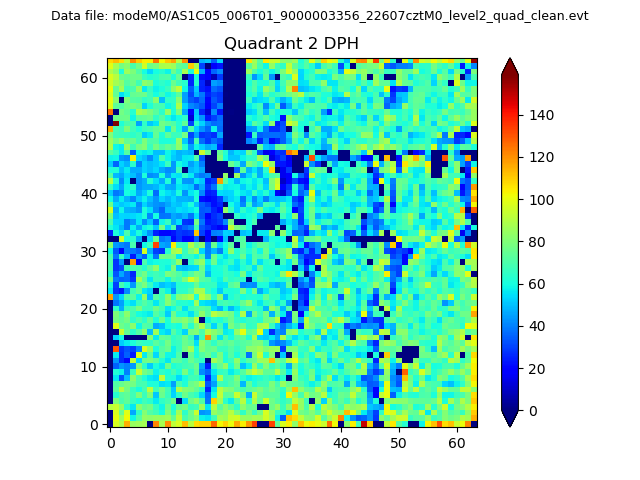 |
Quadrant C |
| Plot type | Count rate plots | Images |
|---|---|---|
| Comparison with Poisson distribution Blue bars denote a histogram of data divided into 1 sec bins. Red curve is a Poisson curve with rate = median count rate of data. |
 |
 |
| Quadrant-wise count rates Data is divided into 100 sec bins |
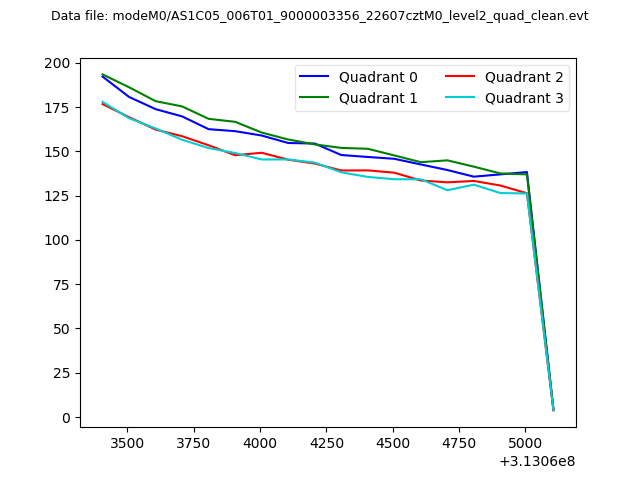 |
|
| Module-wise count rates for Quadrant A Data is divided into 100 sec bins |
 |
 |
| Module-wise count rates for Quadrant B Data is divided into 100 sec bins |
 |
 |
| Module-wise count rates for Quadrant C Data is divided into 100 sec bins |
 |
 |
| Module-wise count rates for Quadrant D Data is divided into 100 sec bins |
 |
 |
| Parameter | Plot |
|---|---|
| CZT HV Monitor |  |
| D_VDD | 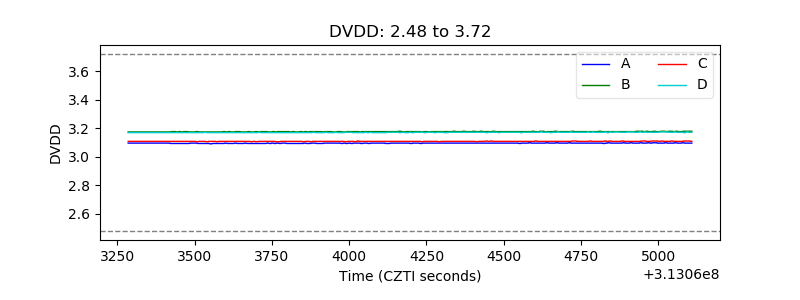 |
| Temperature 1 | 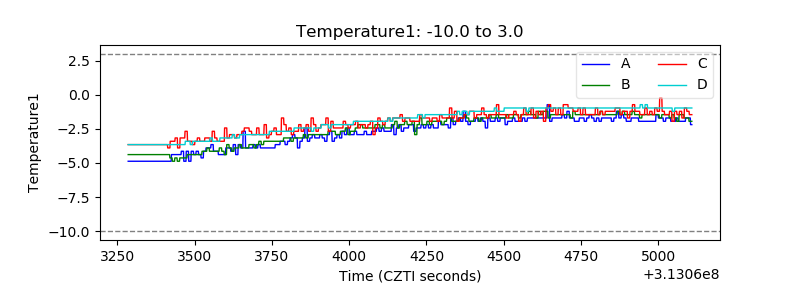 |
| Veto HV Monitor | 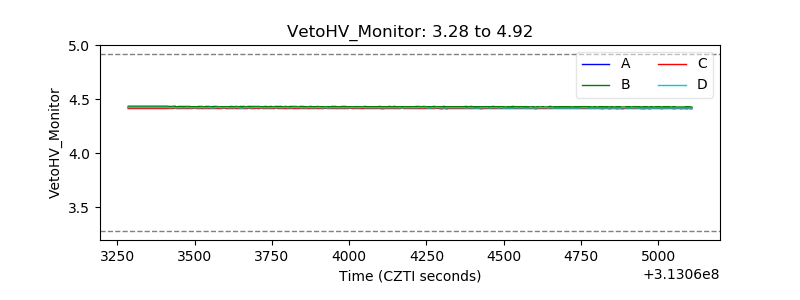 |
| Veto LLD | 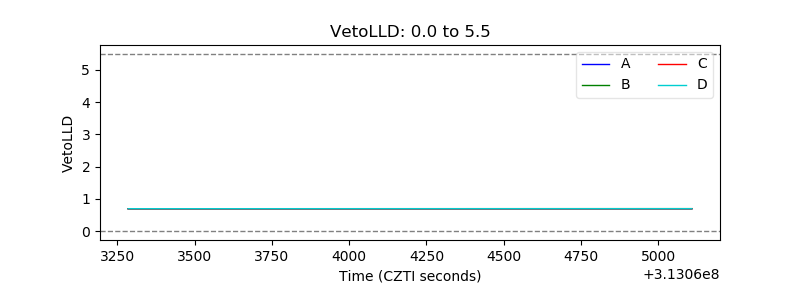 |
| Alpha Counter | 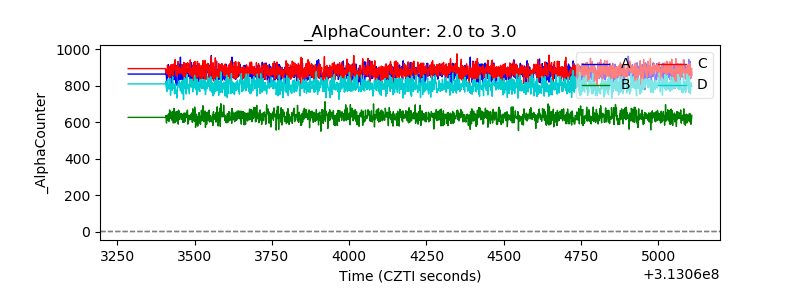 |
| _CPM_Rate | 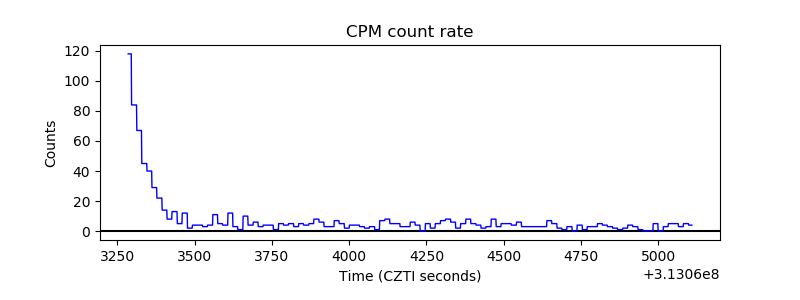 |
| CZT Counter | 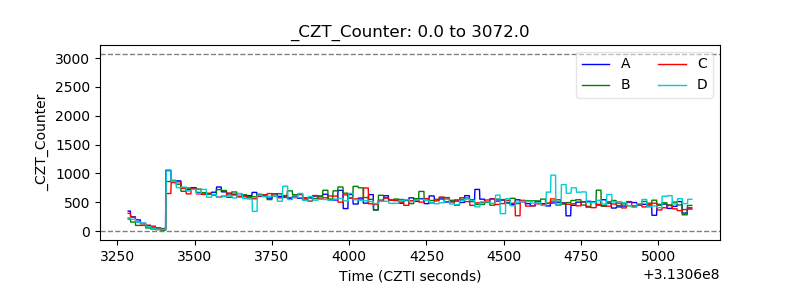 |
| +2.5 Volts monitor |  |
| +5 Volts monitor |  |
| _ROLL_ROT | 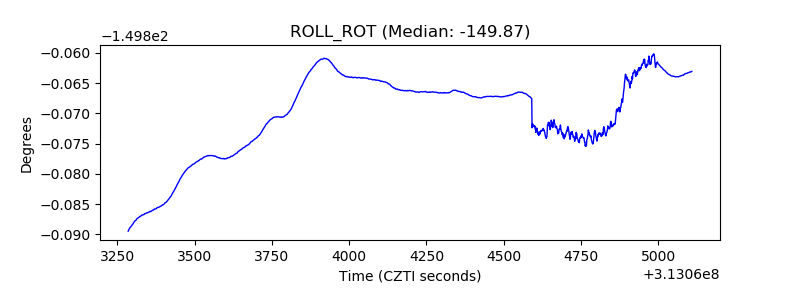 |
| _Roll_DEC | 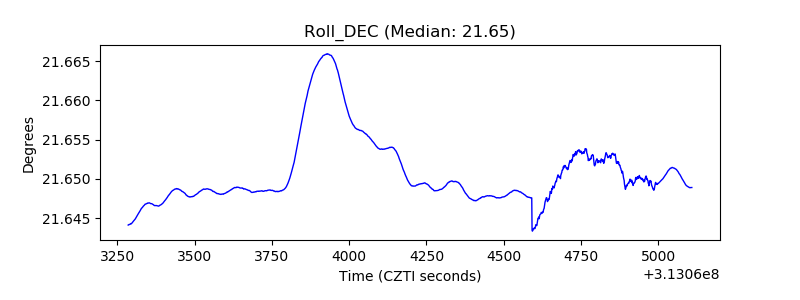 |
| _Roll_RA | 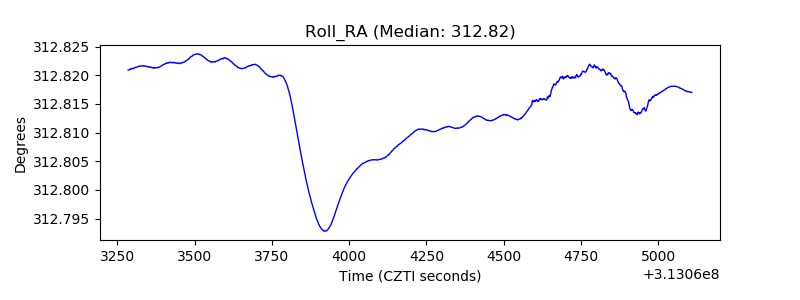 |
| Veto Counter | 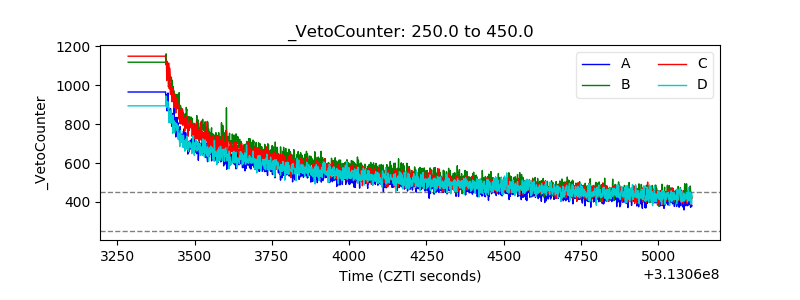 |