| Param | Original file | Final file |
|---|---|---|
| Filename | modeM0/AS1A07_049T01_9000003358cztM0_level2.fits | modeM0/AS1A07_049T01_9000003358cztM0_level2_quad_clean.evt |
| Size (bytes) | 700,243,200 | 588,415,680 |
| Size | 667.8 MB | 561.2 MB |
| Events in quadrant A | 4,337,200 | 3,392,145 |
| Events in quadrant B | 4,135,018 | 3,400,129 |
| Events in quadrant C | 4,175,350 | 3,202,585 |
| Events in quadrant D | 3,681,432 | 2,945,739 |
| Mode SS | |||
|---|---|---|---|
| Quadrant | BADHDUFLAG | Total packets | Discarded packets |
| A | 0 | 1446 | 0 |
| B | 0 | 1446 | 0 |
| C | 0 | 1446 | 0 |
| D | 0 | 1446 | 0 |
| Mode M0 | |||
|---|---|---|---|
| Quadrant | BADHDUFLAG | Total packets | Discarded packets |
| A | 0 | 147025 | 0 |
| B | 0 | 149201 | 0 |
| C | 0 | 147657 | 0 |
| D | 0 | 167771 | 0 |
| Mode M9 | |||
|---|---|---|---|
| Quadrant | BADHDUFLAG | Total packets | Discarded packets |
| A | 0 | 116 | 0 |
| B | 0 | 116 | 0 |
| C | 0 | 116 | 0 |
| D | 0 | 116 | 0 |
| Quadrant | Total seconds | Saturated seconds | Saturation percentage |
|---|---|---|---|
| A | 71152 | 595 | 0.836238% |
| B | 71152 | 756 | 1.062514% |
| C | 71152 | 912 | 1.281763% |
| D | 71152 | 1367 | 1.921239% |
Noise dominated data is calculated using 1-second bins in cleaned event files. If a bin has >2000 counts, and if more than 50% of those come from <1% of pixels, then it is considered to be noise-dominated and hence unusable.
| Quadrant | # 1 sec bins | Bins with >0 counts | Bins with >2000 counts | High rate bins dominated by noise | Noise dominated (total time) | Noise dominated (detector-on time) | Marked lightcurve |
|---|---|---|---|---|---|---|---|
| A | 82588 | 71151 | 0 | 0 | 0.00% | 0.00% |  |
| B | 82588 | 71152 | 0 | 0 | 0.00% | 0.00% | 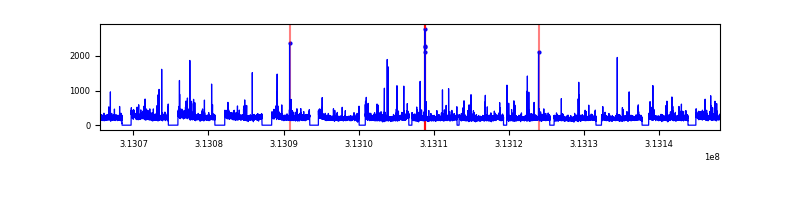 |
| C | 82588 | 71151 | 0 | 0 | 0.00% | 0.00% |  |
| D | 82588 | 71150 | 0 | 0 | 0.00% | 0.00% |  |
Top three noisy pixels from each quadrant. If the there are fewer than three noisy pixels in the level2.evt file, extra rows are filled as -1
| Pixel properties | Quadrant properties | ||||||
|---|---|---|---|---|---|---|---|
| Quadrant | DetID | PixID | Counts | Sigma | Mean | Median | Sigma |
| A | 0 | 29 | 4210 | 11.25 | 1128 | 1057 | 280.2 |
| A | 7 | 110 | 3325 | 8.09 | 1128 | 1057 | 280.2 |
| A | 0 | 30 | 3248 | 7.82 | 1128 | 1057 | 280.2 |
| B | 2 | 9 | 3396 | 10.63 | 1095 | 1043 | 221.4 |
| B | 2 | 8 | 2810 | 7.98 | 1095 | 1043 | 221.4 |
| B | 3 | 17 | 2744 | 7.68 | 1095 | 1043 | 221.4 |
| C | 1 | 80 | 3177 | 7.59 | 1102 | 1030 | 283.0 |
| C | 1 | 81 | 3141 | 7.46 | 1102 | 1030 | 283.0 |
| C | 12 | 241 | 2959 | 6.82 | 1102 | 1030 | 283.0 |
| D | 6 | 231 | 2627 | 6.02 | 1049 | 955 | 277.6 |
| D | 3 | 14 | 2608 | 5.95 | 1049 | 955 | 277.6 |
| D | 7 | 5 | 2579 | 5.85 | 1049 | 955 | 277.6 |
Histogram calculated using DETX and DETY for each event in the final _common_clean file
| Quadrant A | 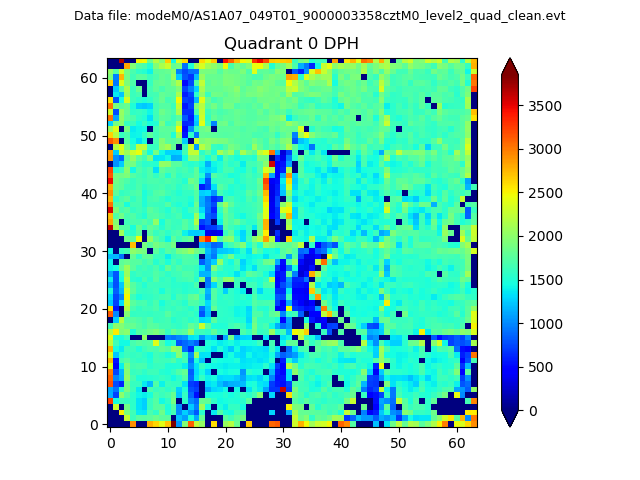 |
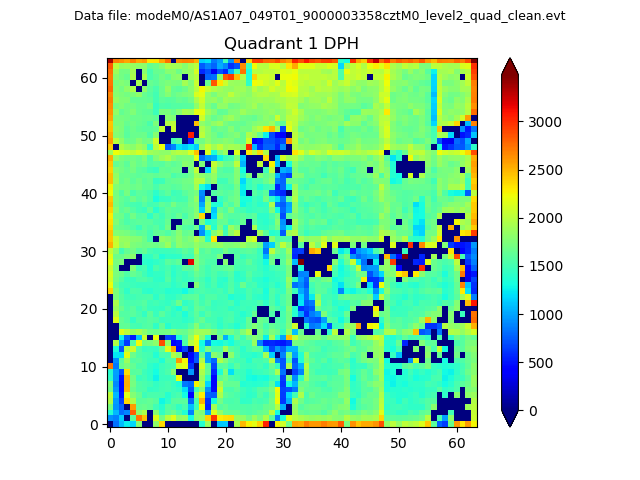 |
Quadrant B |
|---|---|---|---|
| Quadrant D |  |
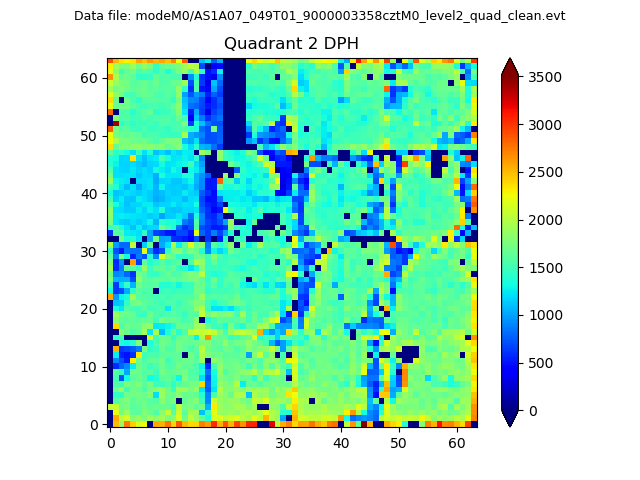 |
Quadrant C |
| Plot type | Count rate plots | Images |
|---|---|---|
| Comparison with Poisson distribution Blue bars denote a histogram of data divided into 1 sec bins. Red curve is a Poisson curve with rate = median count rate of data. |
 |
 |
| Quadrant-wise count rates Data is divided into 100 sec bins |
 |
|
| Module-wise count rates for Quadrant A Data is divided into 100 sec bins |
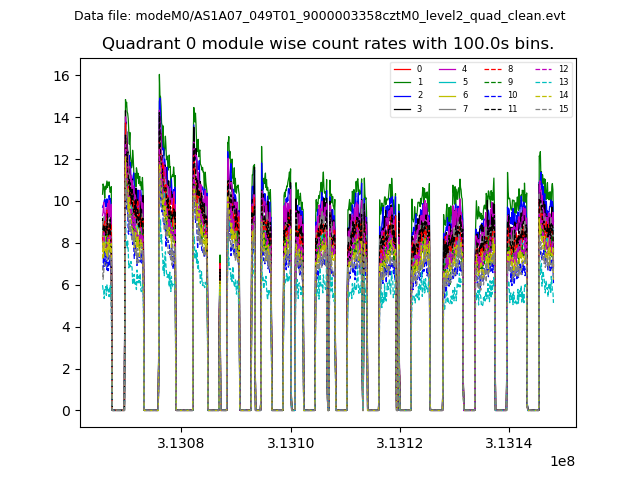 |
 |
| Module-wise count rates for Quadrant B Data is divided into 100 sec bins |
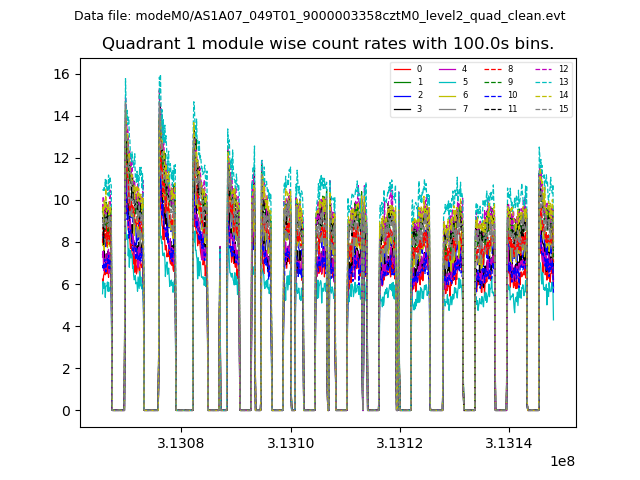 |
 |
| Module-wise count rates for Quadrant C Data is divided into 100 sec bins |
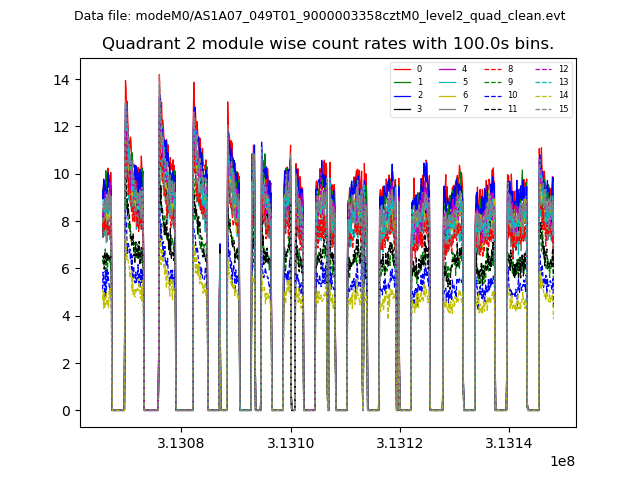 |
 |
| Module-wise count rates for Quadrant D Data is divided into 100 sec bins |
 |
 |
| Parameter | Plot |
|---|---|
| CZT HV Monitor |  |
| D_VDD | 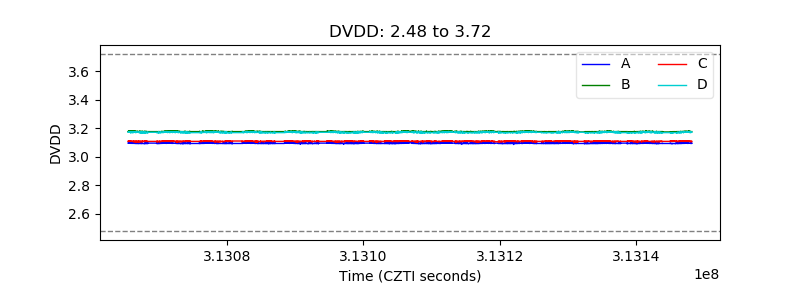 |
| Temperature 1 |  |
| Veto HV Monitor | 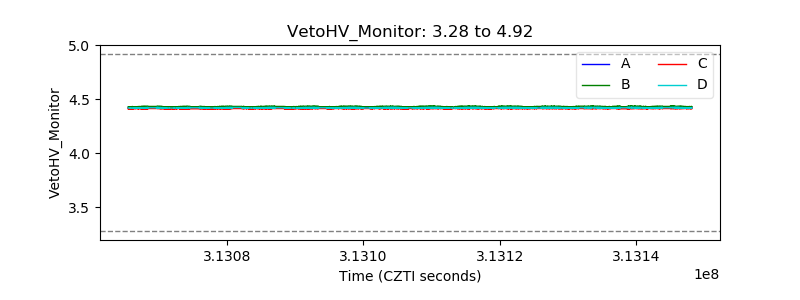 |
| Veto LLD | 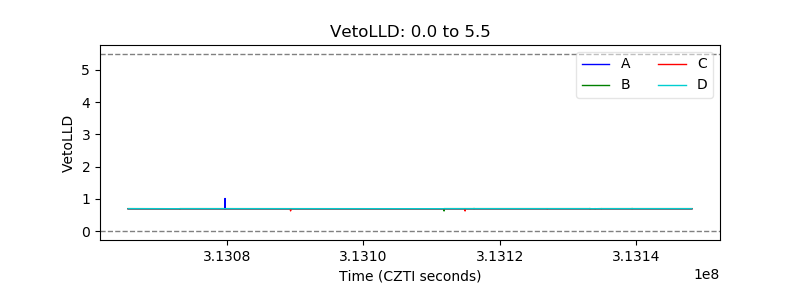 |
| Alpha Counter |  |
| _CPM_Rate |  |
| CZT Counter |  |
| +2.5 Volts monitor |  |
| +5 Volts monitor |  |
| _ROLL_ROT | 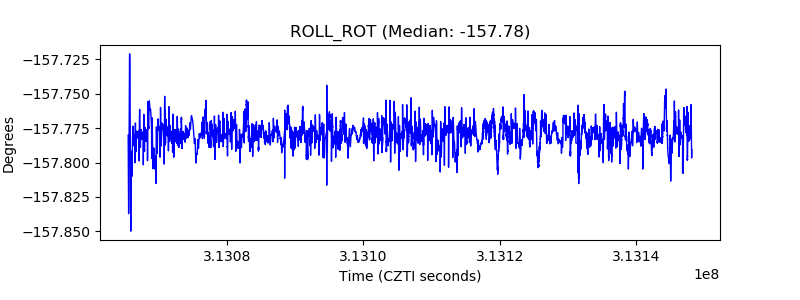 |
| _Roll_DEC |  |
| _Roll_RA |  |
| Veto Counter |  |