| Param | Original file | Final file |
|---|---|---|
| Filename | modeM0/AS1A07_049T01_9000003358_22607cztM0_level2.evt | modeM0/AS1A07_049T01_9000003358_22607cztM0_level2_quad_clean.evt |
| Size (bytes) | 295,611,840 | 68,659,200 |
| Size | 281.9 MB | 65.5 MB |
| Events in quadrant A | 2,134,971 | 459,043 |
| Events in quadrant B | 2,166,282 | 463,349 |
| Events in quadrant C | 2,200,884 | 427,458 |
| Events in quadrant D | 2,159,981 | 429,541 |
| Mode SS | |||
|---|---|---|---|
| Quadrant | BADHDUFLAG | Total packets | Discarded packets |
| A | 0 | 88 | 0 |
| B | 0 | 88 | 0 |
| C | 0 | 88 | 0 |
| D | 0 | 88 | 0 |
| Mode M0 | |||
|---|---|---|---|
| Quadrant | BADHDUFLAG | Total packets | Discarded packets |
| A | 0 | 9157 | 1 |
| B | 0 | 9167 | 1 |
| C | 0 | 9253 | 1 |
| D | 0 | 9297 | 1 |
| Mode M9 | |||
|---|---|---|---|
| Quadrant | BADHDUFLAG | Total packets | Discarded packets |
| A | 0 | 12 | 0 |
| B | 0 | 12 | 0 |
| C | 0 | 12 | 0 |
| D | 0 | 12 | 0 |
| Quadrant | Total seconds | Saturated seconds | Saturation percentage |
|---|---|---|---|
| A | 4254 | 58 | 1.363423% |
| B | 4254 | 67 | 1.574988% |
| C | 4254 | 80 | 1.880583% |
| D | 4254 | 51 | 1.198872% |
Noise dominated data is calculated using 1-second bins in cleaned event files. If a bin has >2000 counts, and if more than 50% of those come from <1% of pixels, then it is considered to be noise-dominated and hence unusable.
| Quadrant | # 1 sec bins | Bins with >0 counts | Bins with >2000 counts | High rate bins dominated by noise | Noise dominated (total time) | Noise dominated (detector-on time) | Marked lightcurve |
|---|---|---|---|---|---|---|---|
| A | 5464 | 4255 | 0 | 0 | 0.00% | 0.00% | 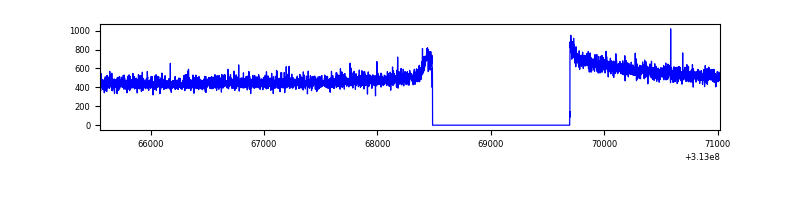 |
| B | 5464 | 4255 | 0 | 0 | 0.00% | 0.00% | 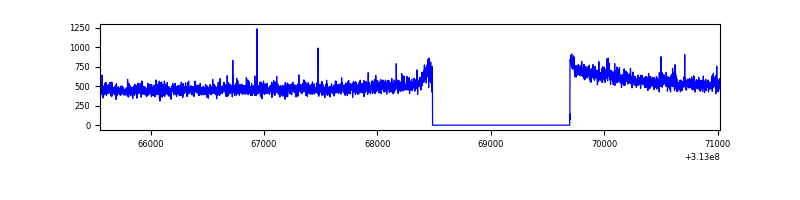 |
| C | 5464 | 4255 | 0 | 0 | 0.00% | 0.00% | 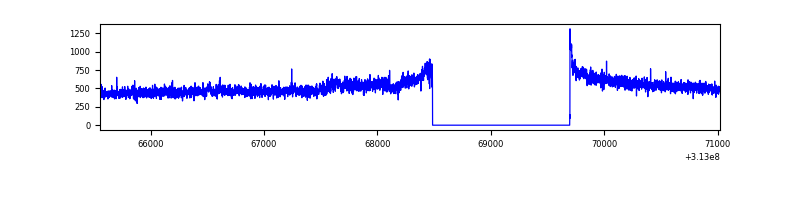 |
| D | 5464 | 4255 | 5 | 5 | 0.09% | 0.12% | 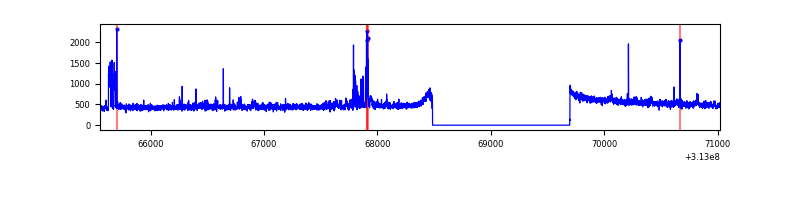 |
Top three noisy pixels from each quadrant. If the there are fewer than three noisy pixels in the level2.evt file, extra rows are filled as -1
| Pixel properties | Quadrant properties | ||||||
|---|---|---|---|---|---|---|---|
| Quadrant | DetID | PixID | Counts | Sigma | Mean | Median | Sigma |
| A | 13 | 254 | 7030 | 58.57 | 552 | 541 | 110.8 |
| A | 11 | 47 | 5430 | 44.13 | 552 | 541 | 110.8 |
| A | 0 | 226 | 4834 | 38.75 | 552 | 541 | 110.8 |
| B | 12 | 111 | 11990 | 110.25 | 547 | 534 | 103.9 |
| B | 11 | 111 | 10548 | 96.38 | 547 | 534 | 103.9 |
| B | 0 | 197 | 9219 | 83.59 | 547 | 534 | 103.9 |
| C | 14 | 238 | 84164 | 688.77 | 522 | 526 | 121.4 |
| C | 10 | 222 | 77020 | 629.93 | 522 | 526 | 121.4 |
| C | 0 | 10 | 4616 | 33.68 | 522 | 526 | 121.4 |
| D | 1 | 52 | 91193 | 690.62 | 536 | 519 | 131.3 |
| D | 1 | 239 | 18026 | 133.34 | 536 | 519 | 131.3 |
| D | 2 | 234 | 17105 | 126.33 | 536 | 519 | 131.3 |
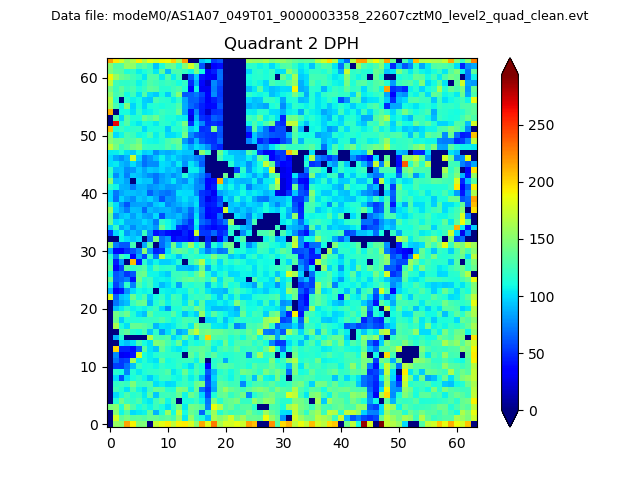
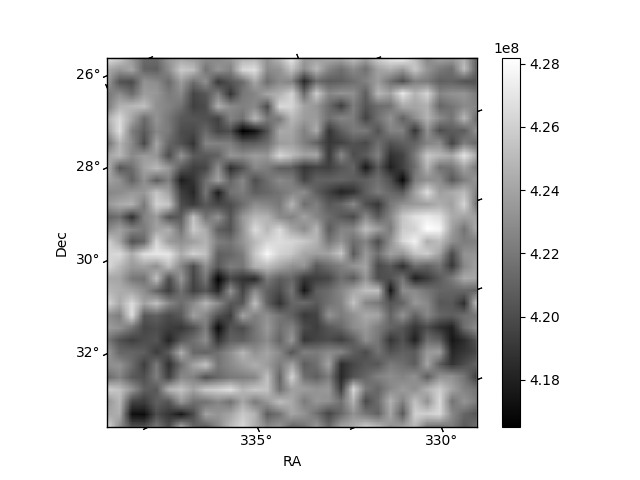
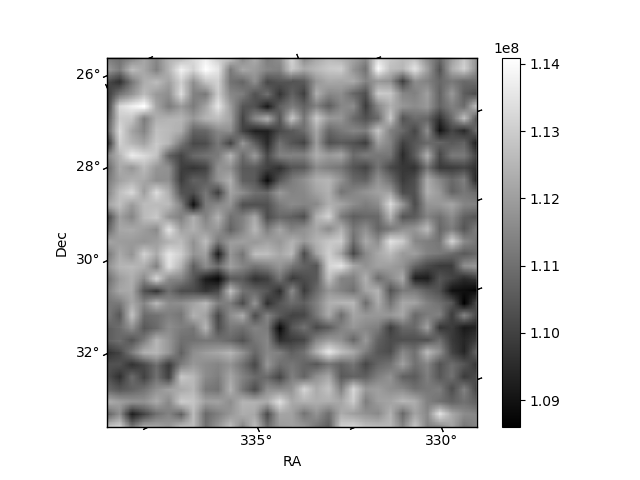
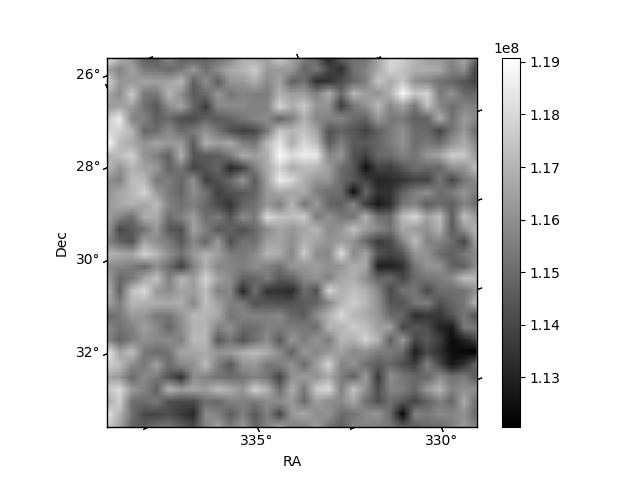
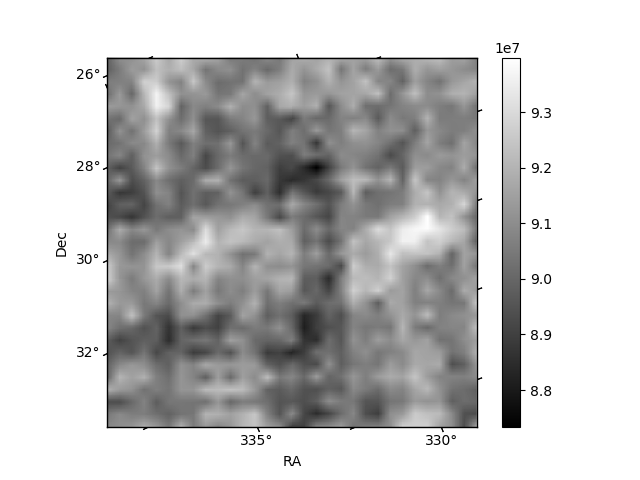
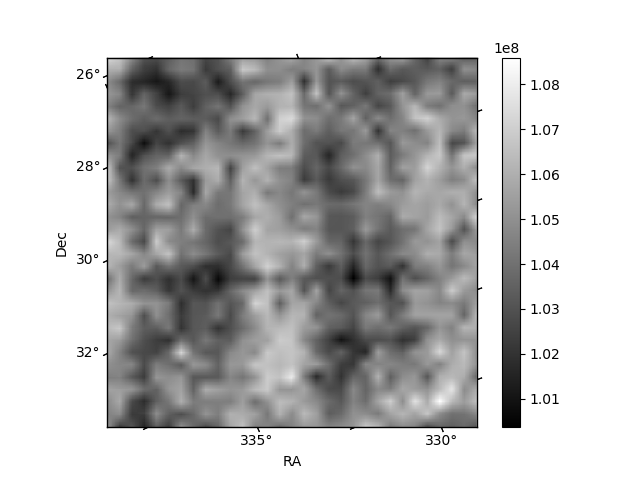
Histogram calculated using DETX and DETY for each event in the final _common_clean file
| Quadrant A | 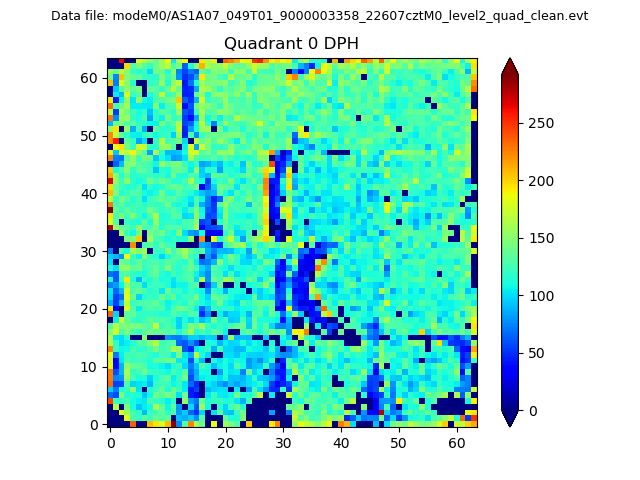 |
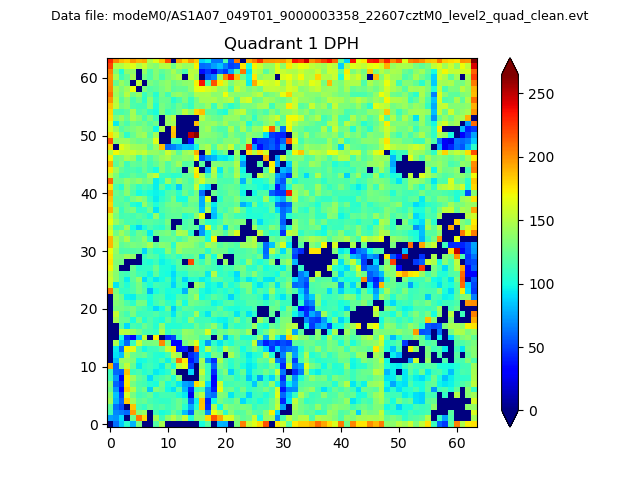 |
Quadrant B |
|---|---|---|---|
| Quadrant D | 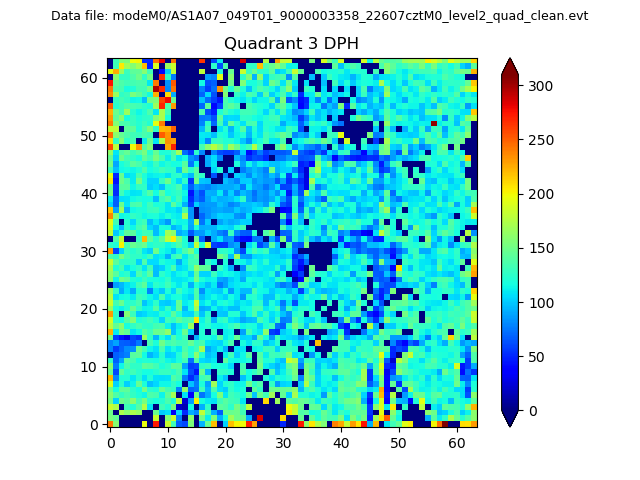 |
 |
Quadrant C |
| Plot type | Count rate plots | Images |
|---|---|---|
| Comparison with Poisson distribution Blue bars denote a histogram of data divided into 1 sec bins. Red curve is a Poisson curve with rate = median count rate of data. |
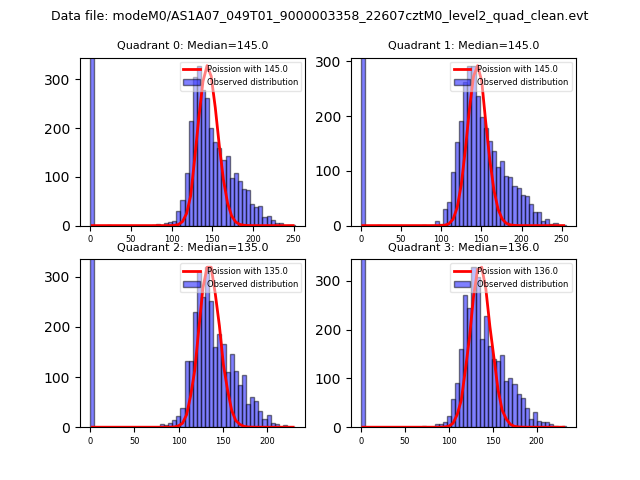 |
 |
| Quadrant-wise count rates Data is divided into 100 sec bins |
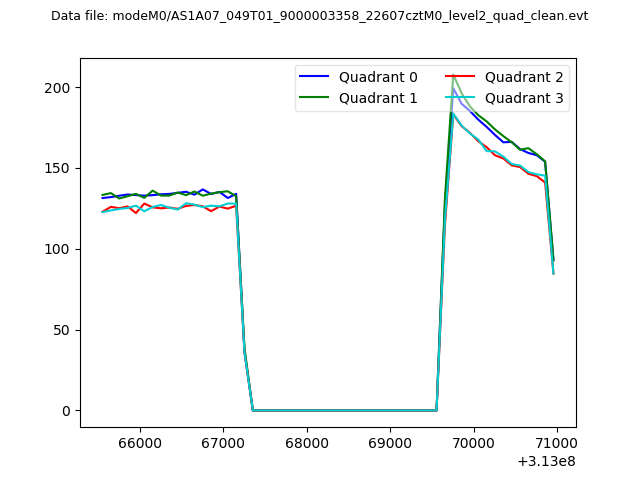 |
|
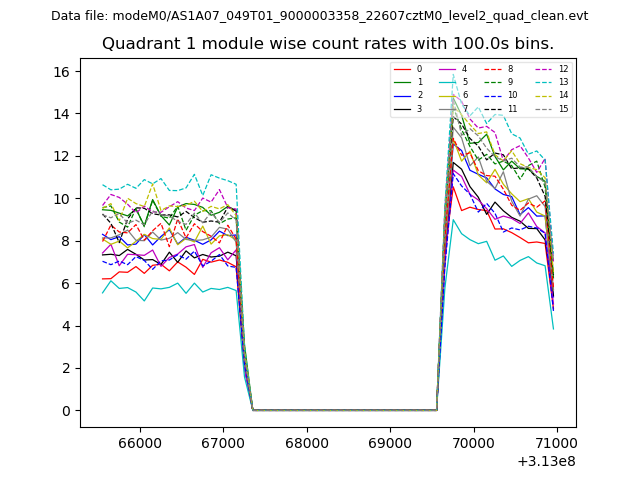
| Module-wise count rates for Quadrant A Data is divided into 100 sec bins |
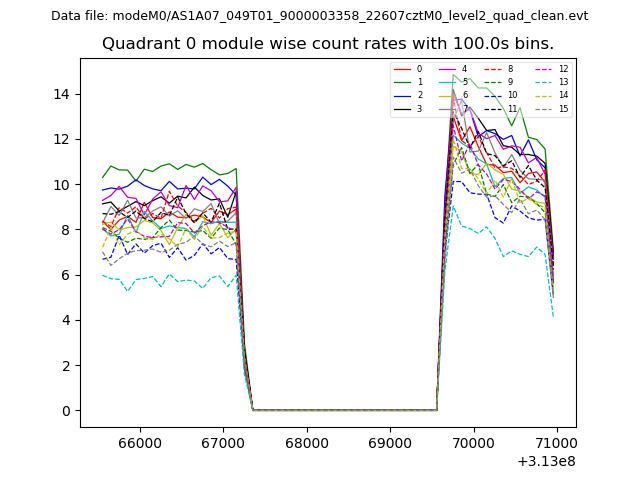 |
 |
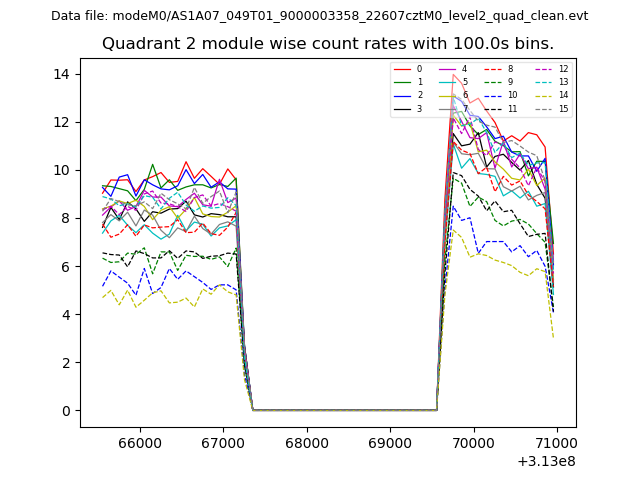
| Module-wise count rates for Quadrant B Data is divided into 100 sec bins |
 |
 |
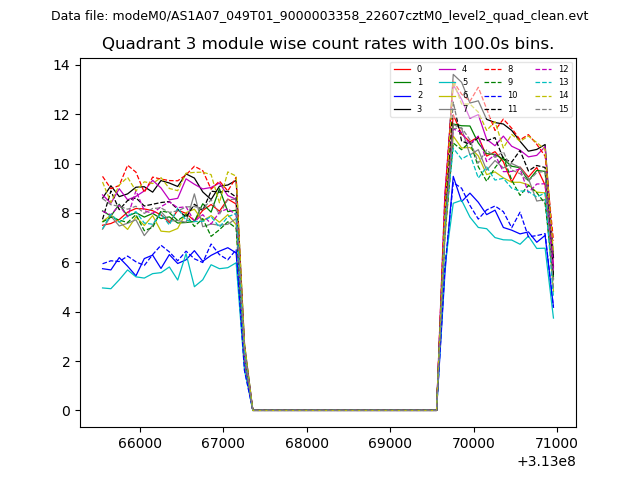
| Module-wise count rates for Quadrant C Data is divided into 100 sec bins |
 |
 |
| Module-wise count rates for Quadrant D Data is divided into 100 sec bins |
 |
 |
| Parameter | Plot |
|---|---|
| CZT HV Monitor | 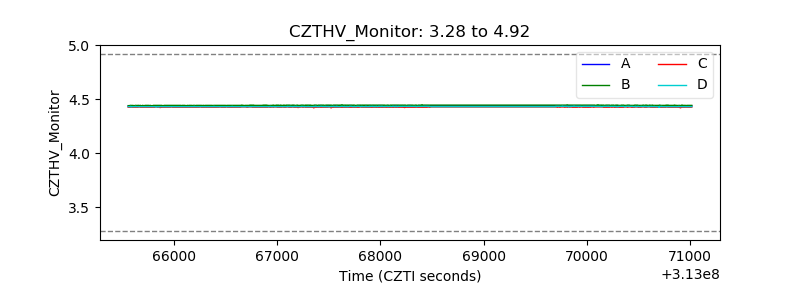 |
| D_VDD | 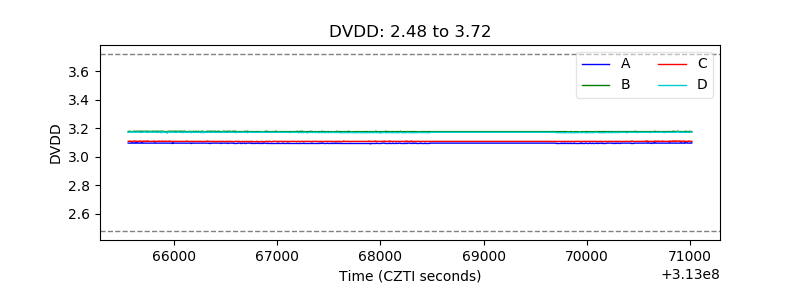 |
| Temperature 1 | 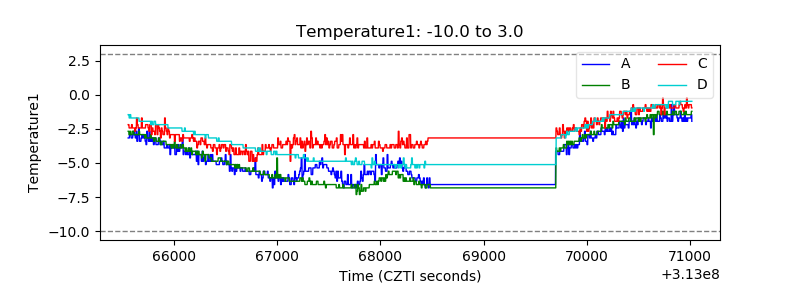 |
| Veto HV Monitor | 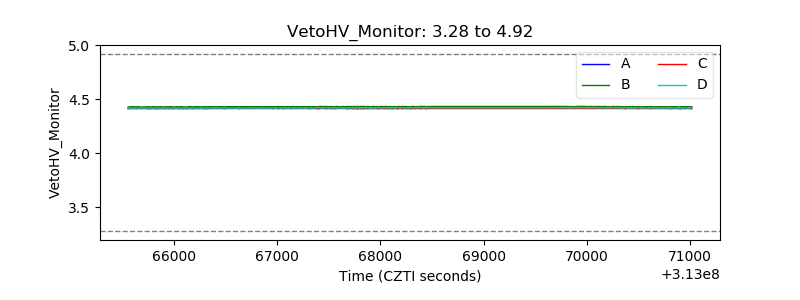 |
| Veto LLD | 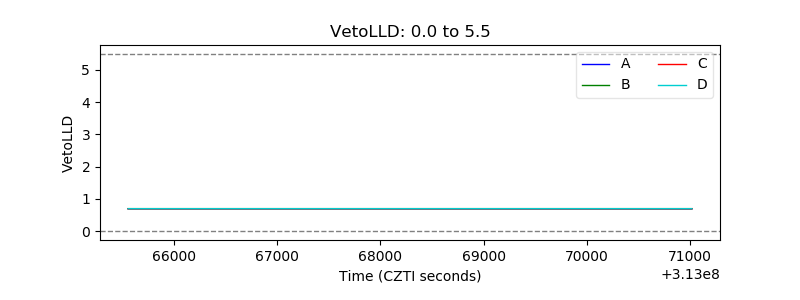 |
| Alpha Counter | 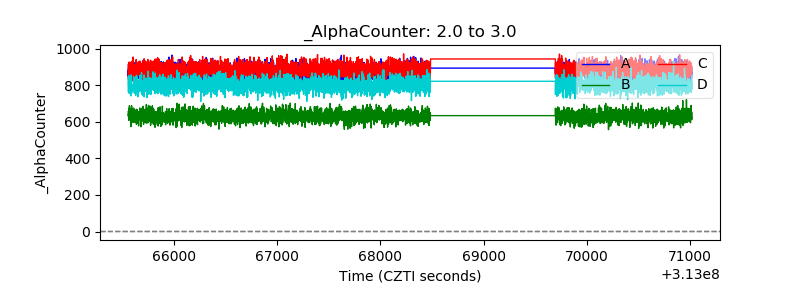 |
| _CPM_Rate | 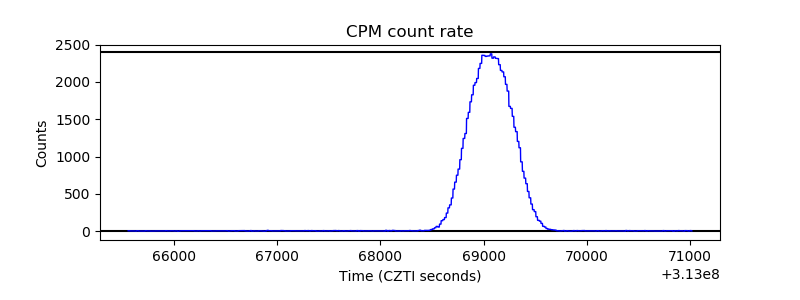 |
| CZT Counter | 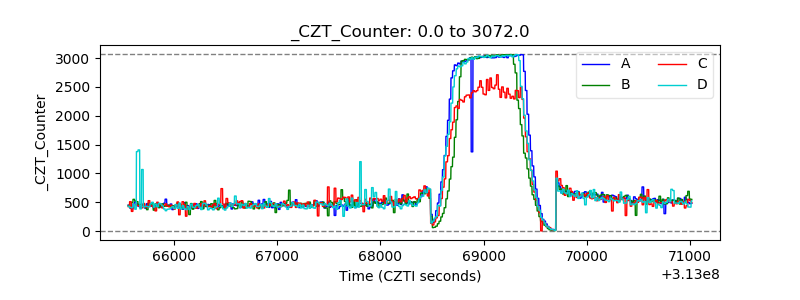 |
| +2.5 Volts monitor |  |
| +5 Volts monitor |  |
| _ROLL_ROT | 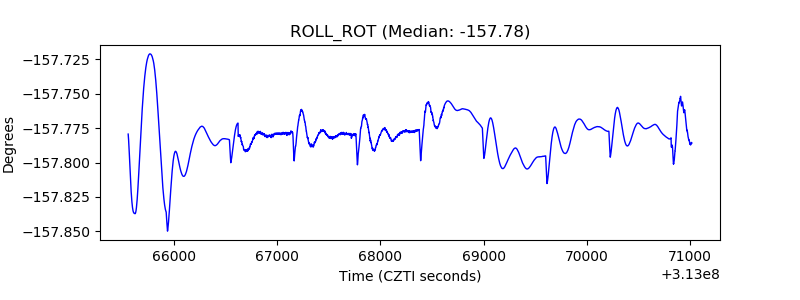 |
| _Roll_DEC | 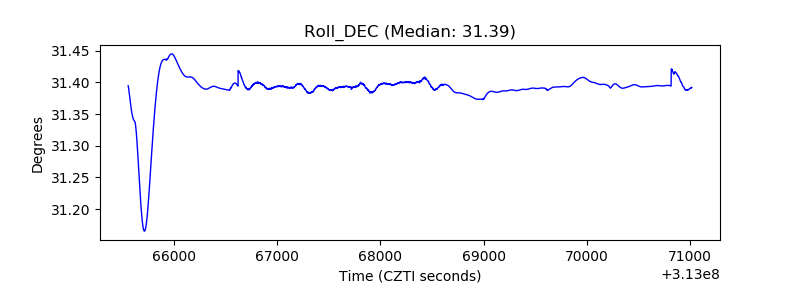 |
| _Roll_RA | 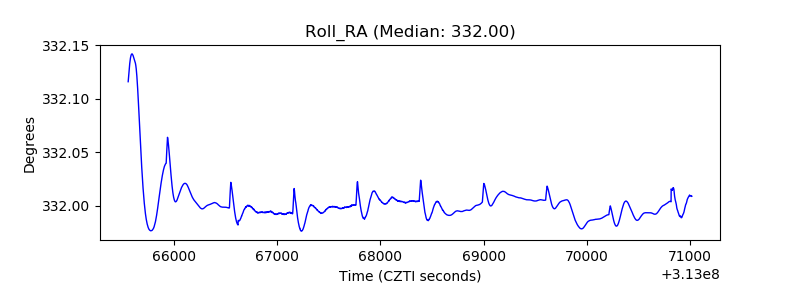 |
| Veto Counter | 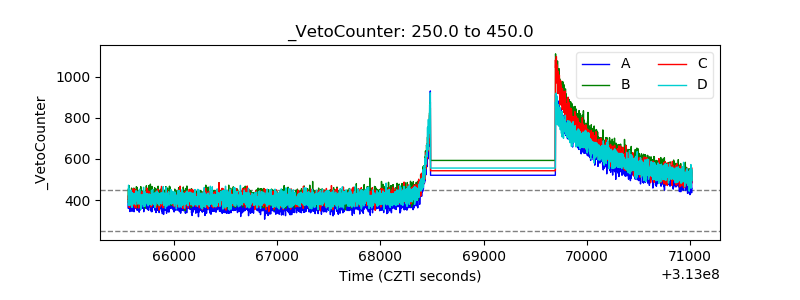 |