| Param | Original file | Final file |
|---|---|---|
| Filename | modeM0/AS1A07_049T01_9000003358_22611cztM0_level2.evt | modeM0/AS1A07_049T01_9000003358_22611cztM0_level2_quad_clean.evt |
| Size (bytes) | 450,702,720 | 91,339,200 |
| Size | 429.8 MB | 87.1 MB |
| Events in quadrant A | 3,076,380 | 593,784 |
| Events in quadrant B | 3,234,212 | 605,728 |
| Events in quadrant C | 3,154,520 | 571,007 |
| Events in quadrant D | 3,754,041 | 553,651 |
| Mode SS | |||
|---|---|---|---|
| Quadrant | BADHDUFLAG | Total packets | Discarded packets |
| A | 0 | 130 | 0 |
| B | 0 | 130 | 0 |
| C | 0 | 130 | 0 |
| D | 0 | 130 | 0 |
| Mode M0 | |||
|---|---|---|---|
| Quadrant | BADHDUFLAG | Total packets | Discarded packets |
| A | 0 | 13152 | 2 |
| B | 0 | 13595 | 2 |
| C | 0 | 13232 | 2 |
| D | 0 | 15345 | 2 |
| Mode M9 | |||
|---|---|---|---|
| Quadrant | BADHDUFLAG | Total packets | Discarded packets |
| A | 0 | 12 | 0 |
| B | 0 | 13 | 0 |
| C | 0 | 13 | 0 |
| D | 0 | 13 | 0 |
| Quadrant | Total seconds | Saturated seconds | Saturation percentage |
|---|---|---|---|
| A | 6330 | 35 | 0.552923% |
| B | 6330 | 39 | 0.616114% |
| C | 6330 | 63 | 0.995261% |
| D | 6330 | 103 | 1.627172% |
Noise dominated data is calculated using 1-second bins in cleaned event files. If a bin has >2000 counts, and if more than 50% of those come from <1% of pixels, then it is considered to be noise-dominated and hence unusable.
| Quadrant | # 1 sec bins | Bins with >0 counts | Bins with >2000 counts | High rate bins dominated by noise | Noise dominated (total time) | Noise dominated (detector-on time) | Marked lightcurve |
|---|---|---|---|---|---|---|---|
| A | 7480 | 6331 | 0 | 0 | 0.00% | 0.00% | 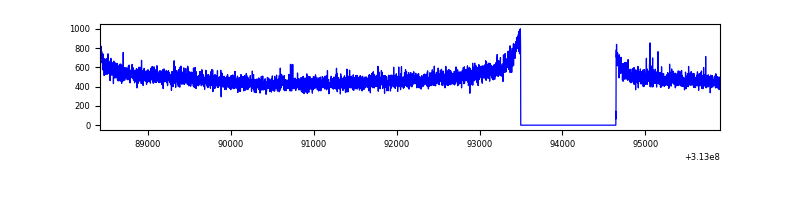 |
| B | 7480 | 6331 | 6 | 6 | 0.08% | 0.09% | 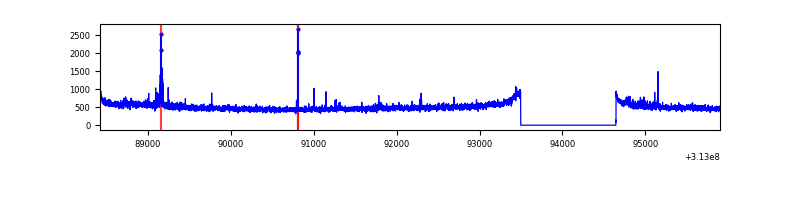 |
| C | 7480 | 6331 | 0 | 0 | 0.00% | 0.00% | 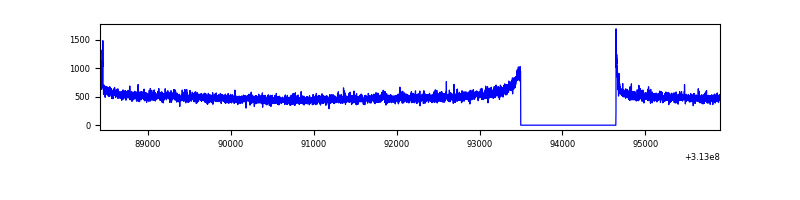 |
| D | 7480 | 6331 | 90 | 90 | 1.20% | 1.42% | 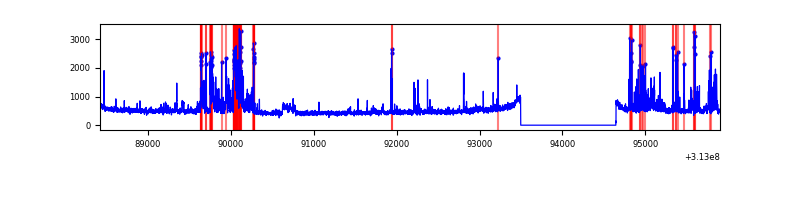 |
Top three noisy pixels from each quadrant. If the there are fewer than three noisy pixels in the level2.evt file, extra rows are filled as -1
| Pixel properties | Quadrant properties | ||||||
|---|---|---|---|---|---|---|---|
| Quadrant | DetID | PixID | Counts | Sigma | Mean | Median | Sigma |
| A | 13 | 254 | 10429 | 60.13 | 796 | 781 | 160.4 |
| A | 0 | 226 | 6956 | 38.49 | 796 | 781 | 160.4 |
| A | 3 | 137 | 6643 | 36.54 | 796 | 781 | 160.4 |
| B | 0 | 228 | 32982 | 213.83 | 799 | 779 | 150.6 |
| B | 0 | 230 | 28765 | 185.83 | 799 | 779 | 150.6 |
| B | 0 | 229 | 27273 | 175.92 | 799 | 779 | 150.6 |
| C | 14 | 238 | 120849 | 666.85 | 769 | 777 | 180.1 |
| C | 0 | 10 | 19666 | 104.9 | 769 | 777 | 180.1 |
| C | 10 | 222 | 10501 | 54.0 | 769 | 777 | 180.1 |
| D | 1 | 52 | 393292 | 2067.18 | 779 | 757 | 189.9 |
| D | 7 | 38 | 355639 | 1868.89 | 779 | 757 | 189.9 |
| D | 10 | 199 | 32609 | 167.74 | 779 | 757 | 189.9 |
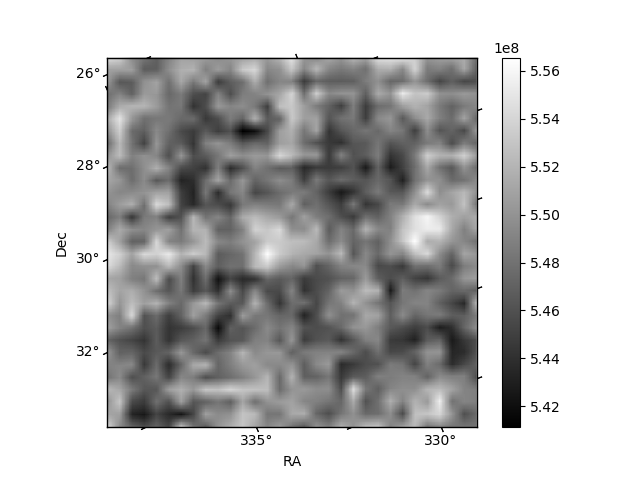
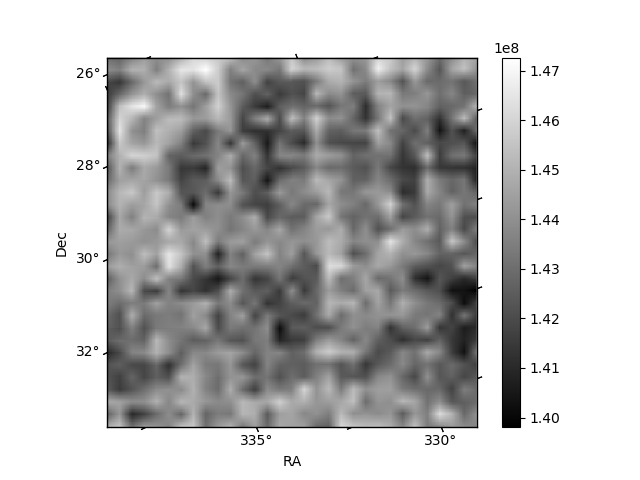
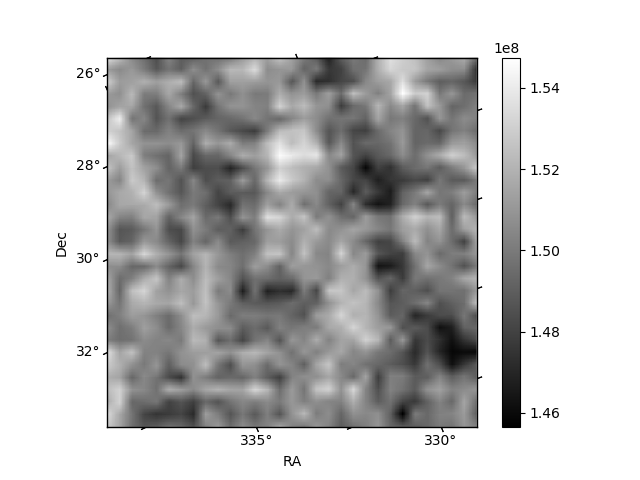
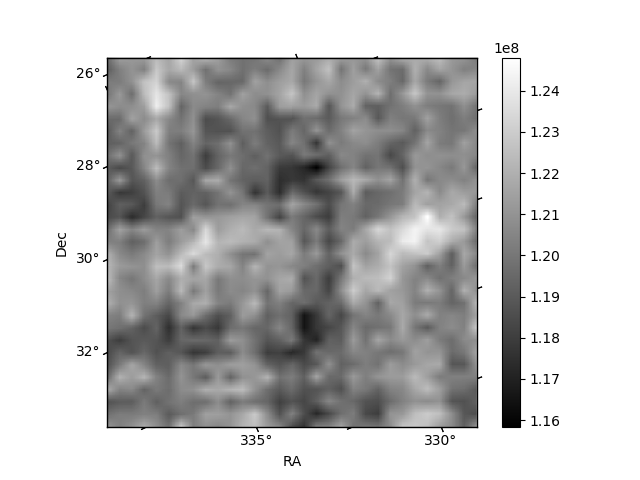
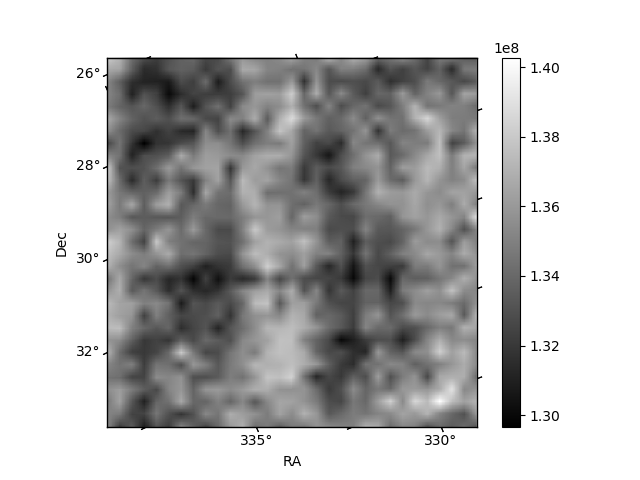
Histogram calculated using DETX and DETY for each event in the final _common_clean file
| Quadrant A | 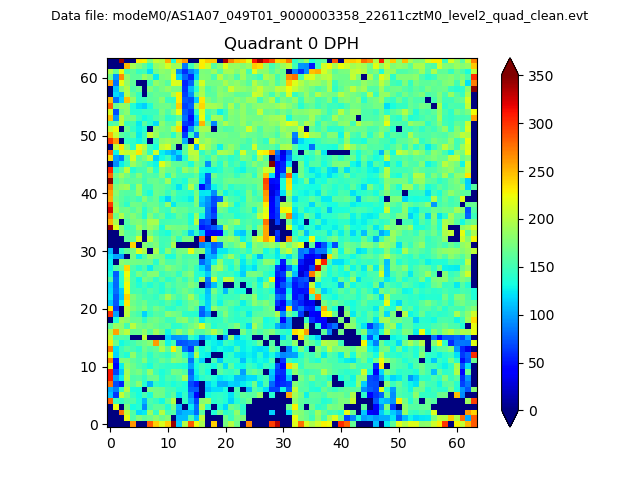 |
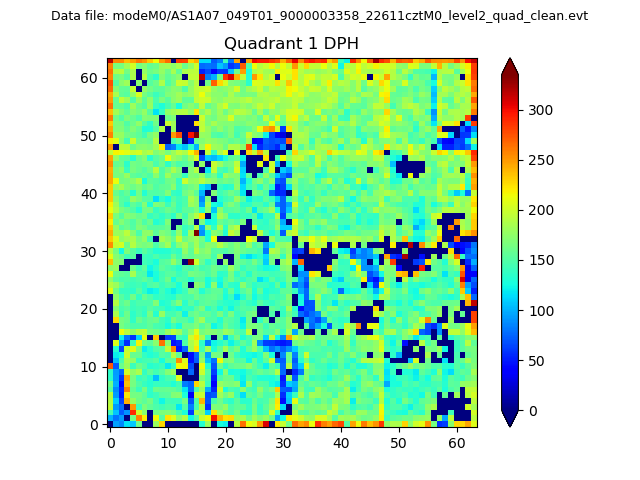 |
Quadrant B |
|---|---|---|---|
| Quadrant D | 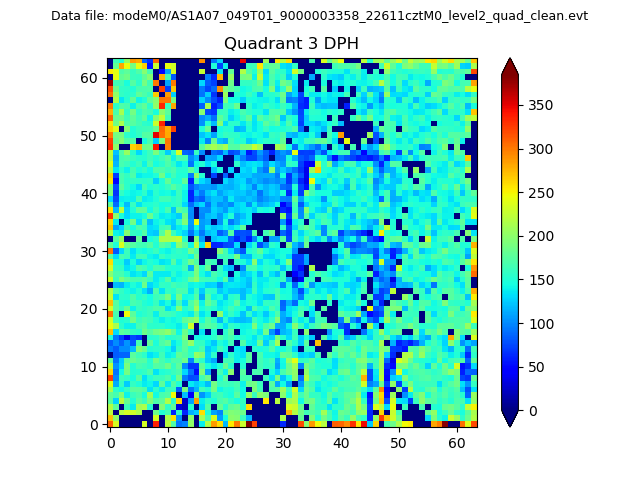 |
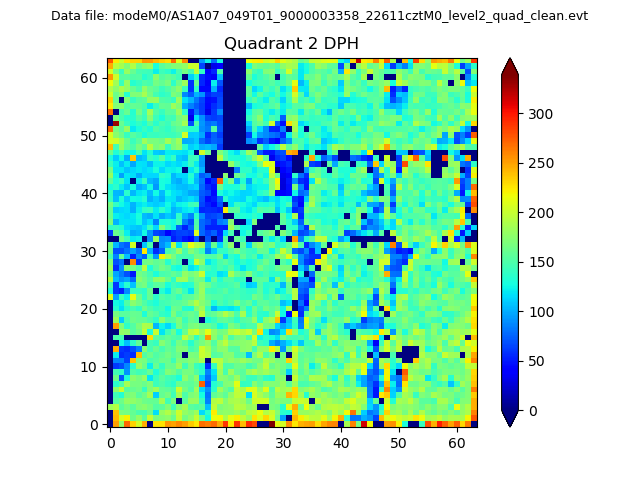 |
Quadrant C |
| Plot type | Count rate plots | Images |
|---|---|---|
| Comparison with Poisson distribution Blue bars denote a histogram of data divided into 1 sec bins. Red curve is a Poisson curve with rate = median count rate of data. |
 |
 |
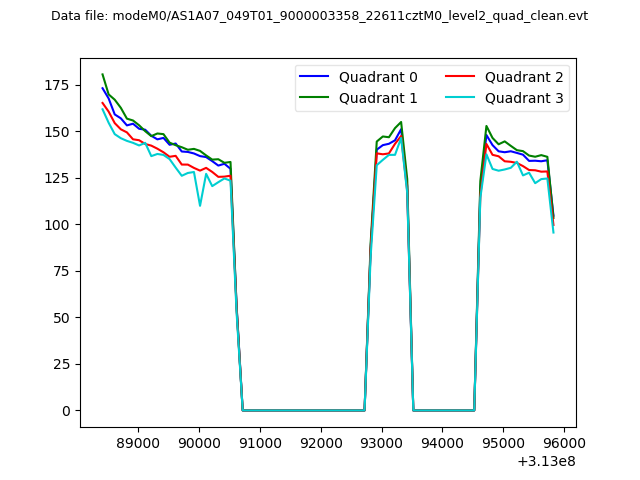
| Quadrant-wise count rates Data is divided into 100 sec bins |
 |
|
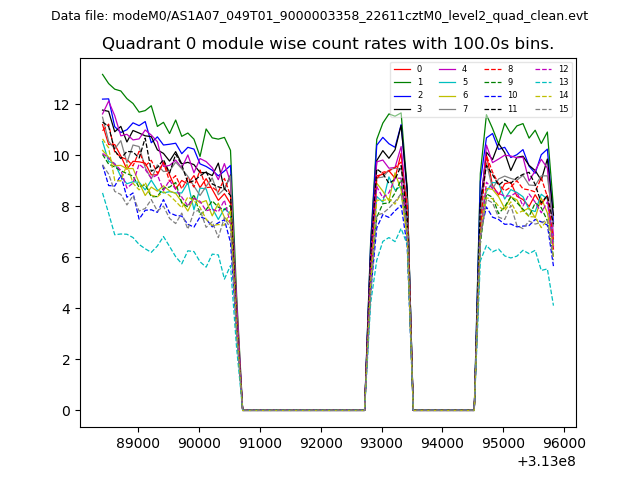
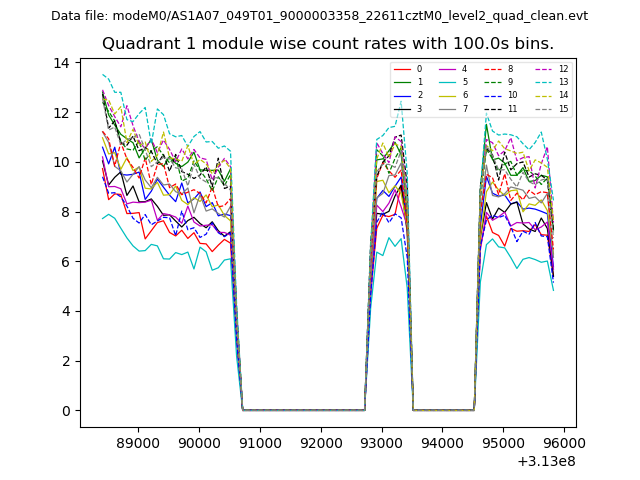
| Module-wise count rates for Quadrant A Data is divided into 100 sec bins |
 |
 |
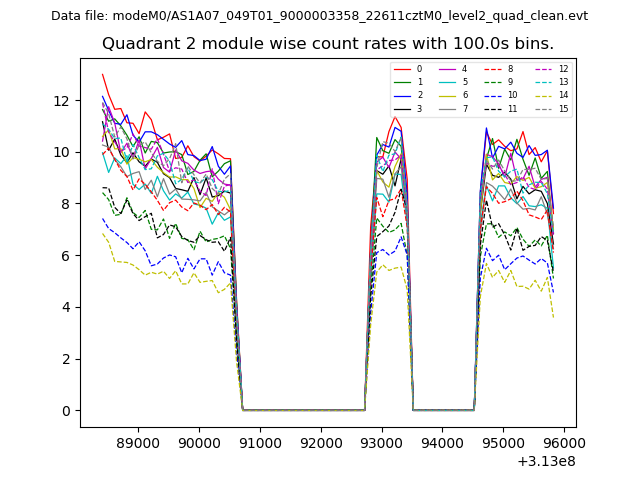
| Module-wise count rates for Quadrant B Data is divided into 100 sec bins |
 |
 |
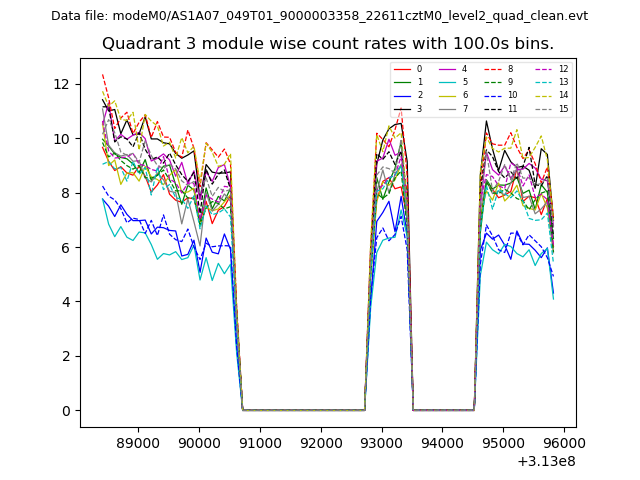
| Module-wise count rates for Quadrant C Data is divided into 100 sec bins |
 |
 |
| Module-wise count rates for Quadrant D Data is divided into 100 sec bins |
 |
 |
| Parameter | Plot |
|---|---|
| CZT HV Monitor |  |
| D_VDD | 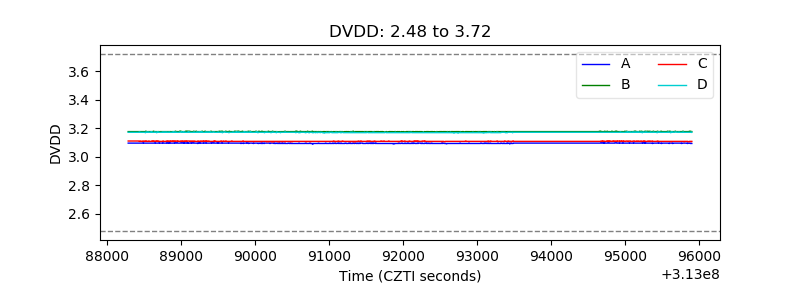 |
| Temperature 1 | 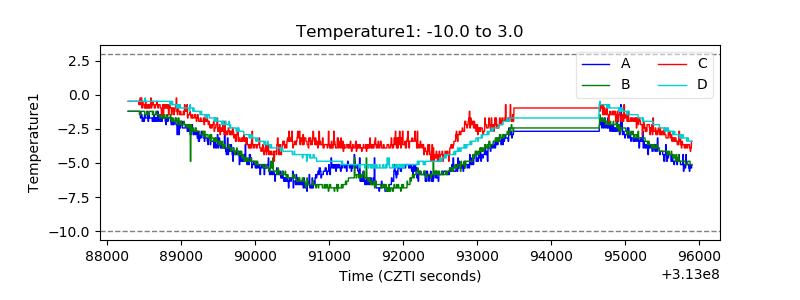 |
| Veto HV Monitor | 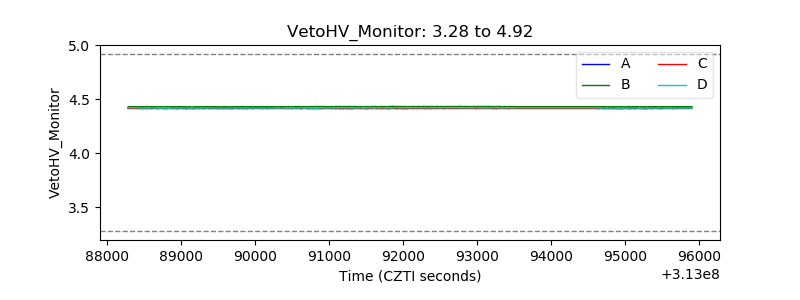 |
| Veto LLD | 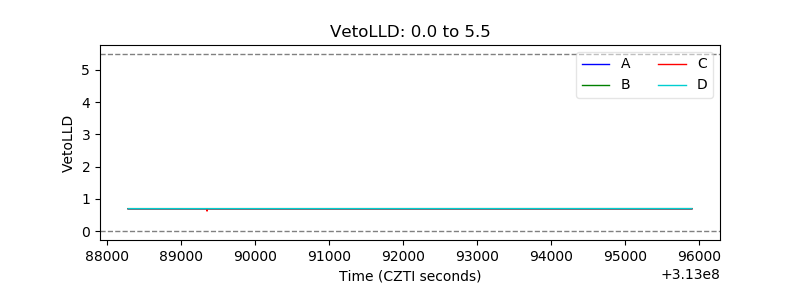 |
| Alpha Counter | 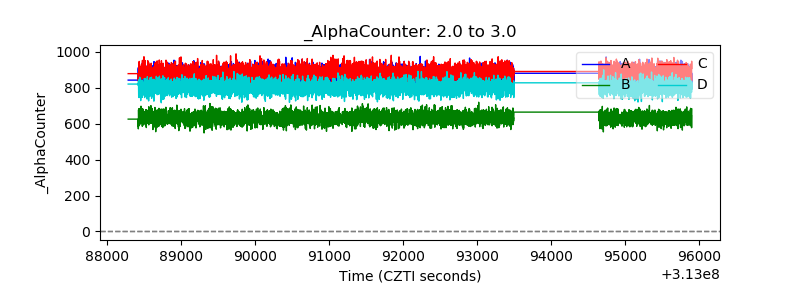 |
| _CPM_Rate | 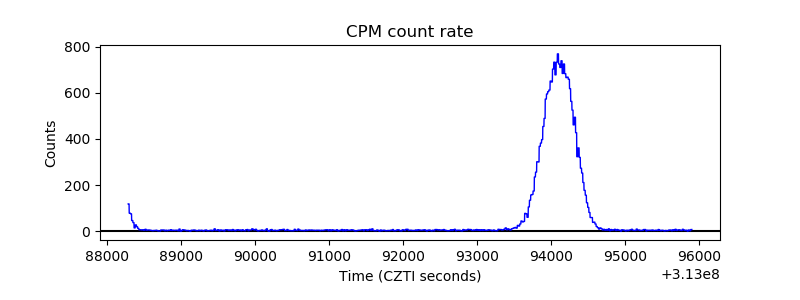 |
| CZT Counter | 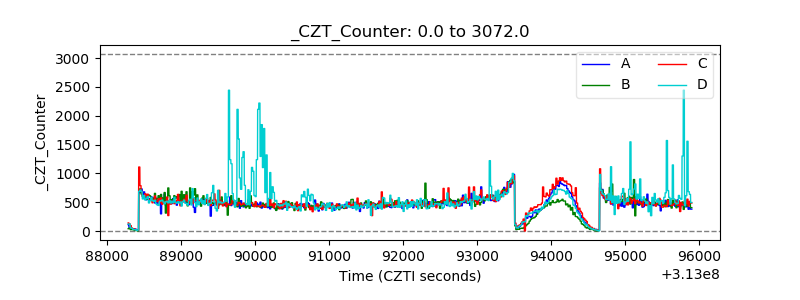 |
| +2.5 Volts monitor |  |
| +5 Volts monitor |  |
| _ROLL_ROT | 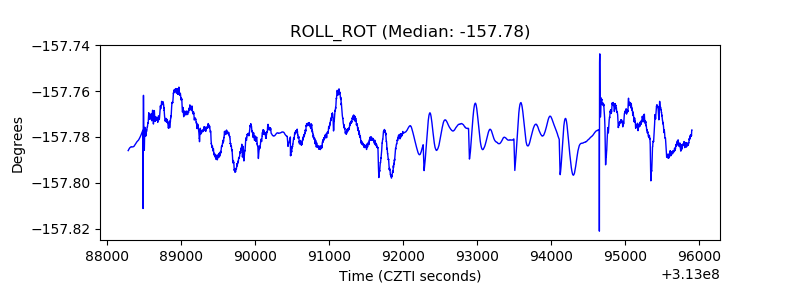 |
| _Roll_DEC | 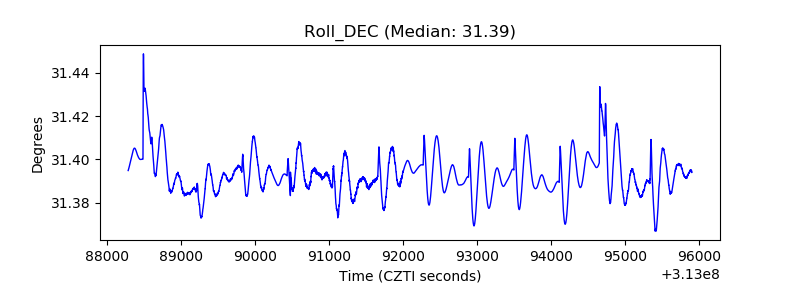 |
| _Roll_RA | 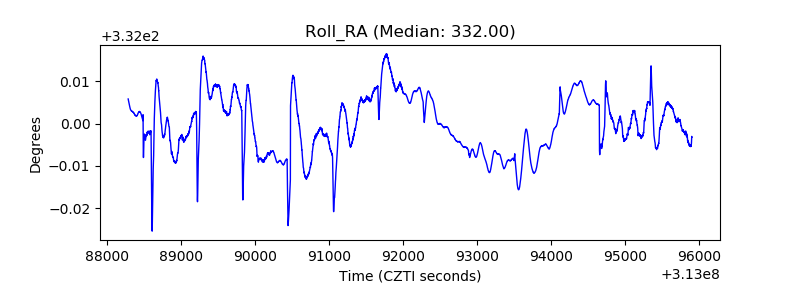 |
| Veto Counter | 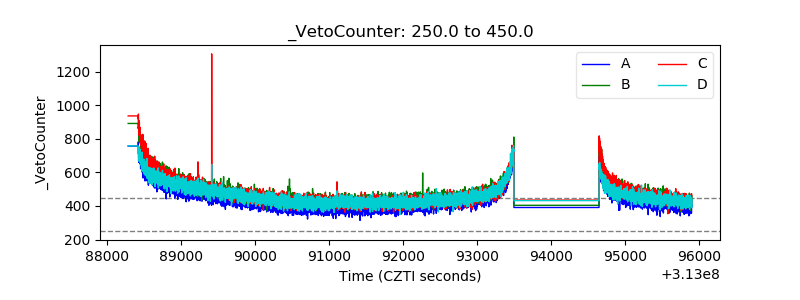 |