| Param | Original file | Final file |
|---|---|---|
| Filename | modeM0/AS1A07_049T01_9000003358_22612cztM0_level2.evt | modeM0/AS1A07_049T01_9000003358_22612cztM0_level2_quad_clean.evt |
| Size (bytes) | 516,424,320 | 96,145,920 |
| Size | 492.5 MB | 91.7 MB |
| Events in quadrant A | 3,219,503 | 622,955 |
| Events in quadrant B | 3,327,936 | 631,390 |
| Events in quadrant C | 3,305,840 | 600,067 |
| Events in quadrant D | 5,325,151 | 583,317 |
| Mode SS | |||
|---|---|---|---|
| Quadrant | BADHDUFLAG | Total packets | Discarded packets |
| A | 0 | 138 | 0 |
| B | 0 | 138 | 0 |
| C | 0 | 138 | 0 |
| D | 0 | 138 | 0 |
| Mode M0 | |||
|---|---|---|---|
| Quadrant | BADHDUFLAG | Total packets | Discarded packets |
| A | 0 | 14042 | 2 |
| B | 0 | 14230 | 2 |
| C | 0 | 14115 | 3 |
| D | 0 | 20393 | 2 |
| Mode M9 | |||
|---|---|---|---|
| Quadrant | BADHDUFLAG | Total packets | Discarded packets |
| A | 0 | 20 | 0 |
| B | 0 | 20 | 0 |
| C | 0 | 20 | 0 |
| D | 0 | 20 | 0 |
| Quadrant | Total seconds | Saturated seconds | Saturation percentage |
|---|---|---|---|
| A | 6807 | 46 | 0.675775% |
| B | 6808 | 51 | 0.749119% |
| C | 6807 | 95 | 1.395622% |
| D | 6807 | 367 | 5.391509% |
Noise dominated data is calculated using 1-second bins in cleaned event files. If a bin has >2000 counts, and if more than 50% of those come from <1% of pixels, then it is considered to be noise-dominated and hence unusable.
| Quadrant | # 1 sec bins | Bins with >0 counts | Bins with >2000 counts | High rate bins dominated by noise | Noise dominated (total time) | Noise dominated (detector-on time) | Marked lightcurve |
|---|---|---|---|---|---|---|---|
| A | 8777 | 6809 | 0 | 0 | 0.00% | 0.00% | 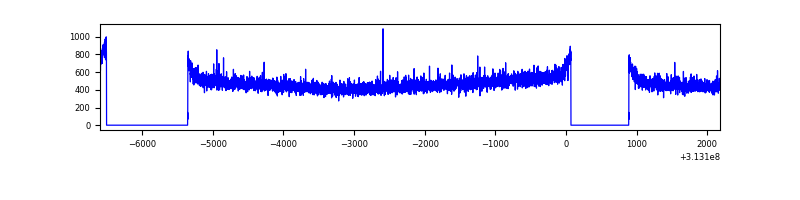 |
| B | 8778 | 6810 | 1 | 1 | 0.01% | 0.01% | 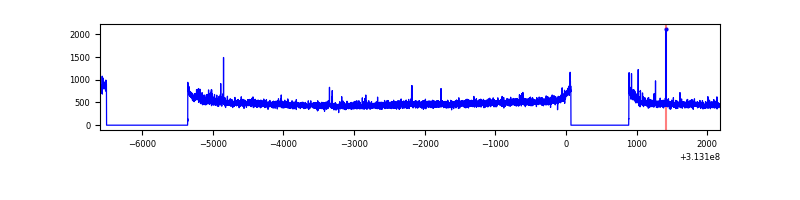 |
| C | 8777 | 6809 | 0 | 0 | 0.00% | 0.00% | 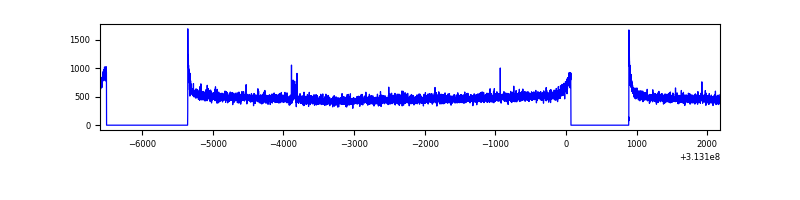 |
| D | 8777 | 6809 | 302 | 302 | 3.44% | 4.44% |  |
Top three noisy pixels from each quadrant. If the there are fewer than three noisy pixels in the level2.evt file, extra rows are filled as -1
| Pixel properties | Quadrant properties | ||||||
|---|---|---|---|---|---|---|---|
| Quadrant | DetID | PixID | Counts | Sigma | Mean | Median | Sigma |
| A | 13 | 254 | 10981 | 60.6 | 834 | 815 | 167.7 |
| A | 0 | 226 | 7279 | 38.53 | 834 | 815 | 167.7 |
| A | 3 | 137 | 7206 | 38.1 | 834 | 815 | 167.7 |
| B | 0 | 229 | 23149 | 140.58 | 835 | 814 | 158.9 |
| B | 12 | 111 | 18933 | 114.05 | 835 | 814 | 158.9 |
| B | 11 | 111 | 16792 | 100.57 | 835 | 814 | 158.9 |
| C | 14 | 238 | 125785 | 660.43 | 805 | 811 | 189.2 |
| C | 0 | 10 | 20288 | 102.93 | 805 | 811 | 189.2 |
| C | 10 | 22 | 9796 | 47.48 | 805 | 811 | 189.2 |
| D | 1 | 52 | 1478482 | 7507.35 | 805 | 784 | 196.8 |
| D | 7 | 238 | 681887 | 3460.3 | 805 | 784 | 196.8 |
| D | 12 | 227 | 30800 | 152.49 | 805 | 784 | 196.8 |
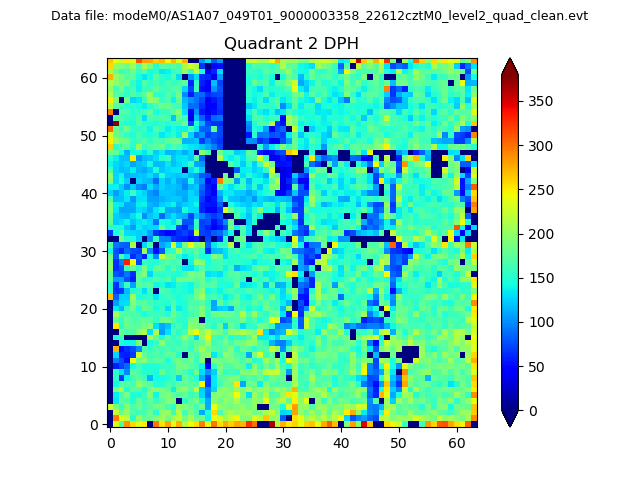
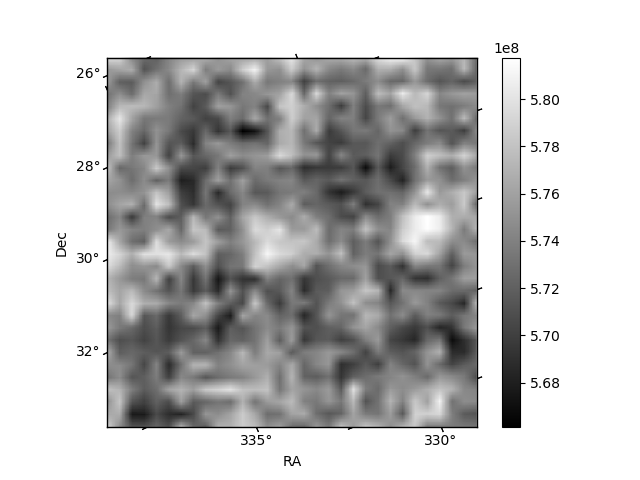
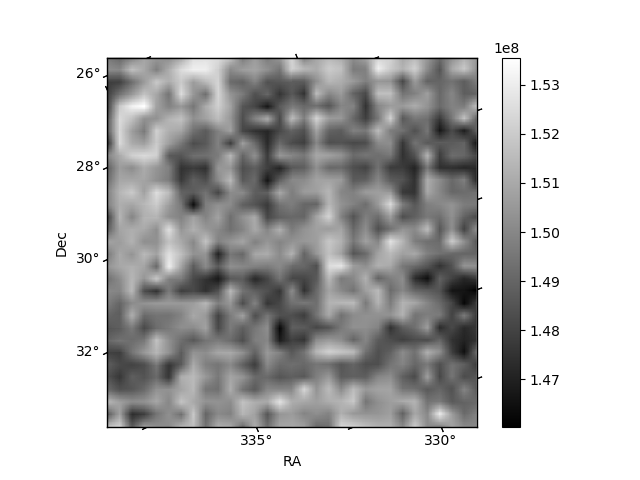
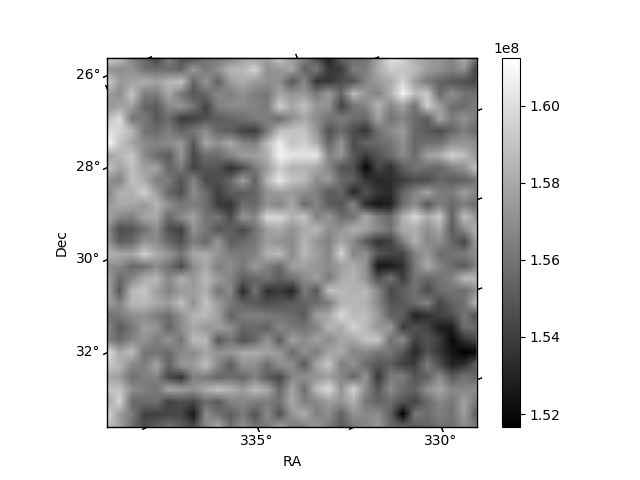
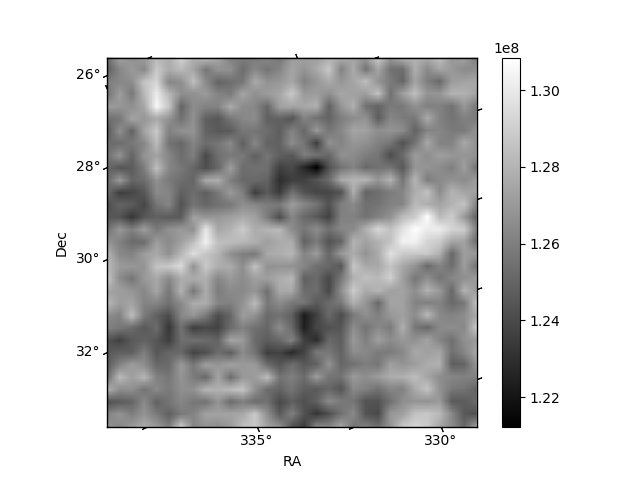
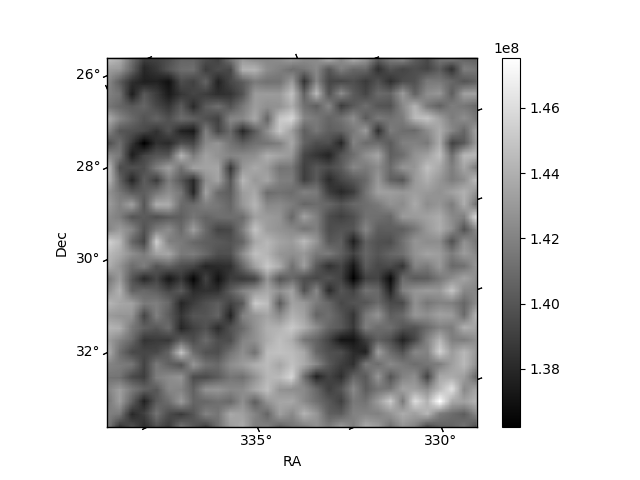
Histogram calculated using DETX and DETY for each event in the final _common_clean file
| Quadrant A |  |
 |
Quadrant B |
|---|---|---|---|
| Quadrant D |  |
 |
Quadrant C |
| Plot type | Count rate plots | Images |
|---|---|---|
| Comparison with Poisson distribution Blue bars denote a histogram of data divided into 1 sec bins. Red curve is a Poisson curve with rate = median count rate of data. |
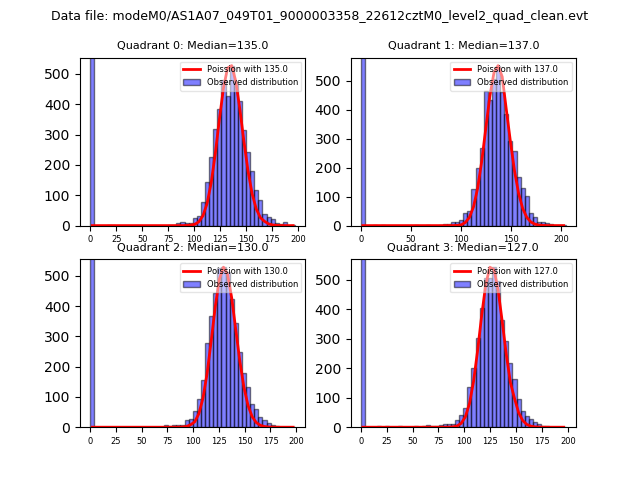 |
 |
| Quadrant-wise count rates Data is divided into 100 sec bins |
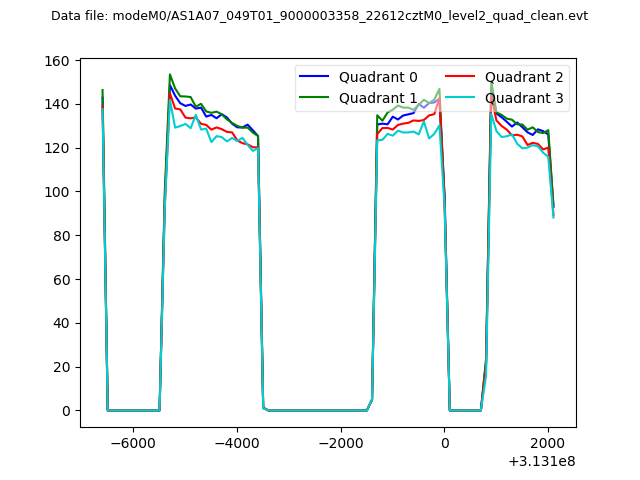 |
|
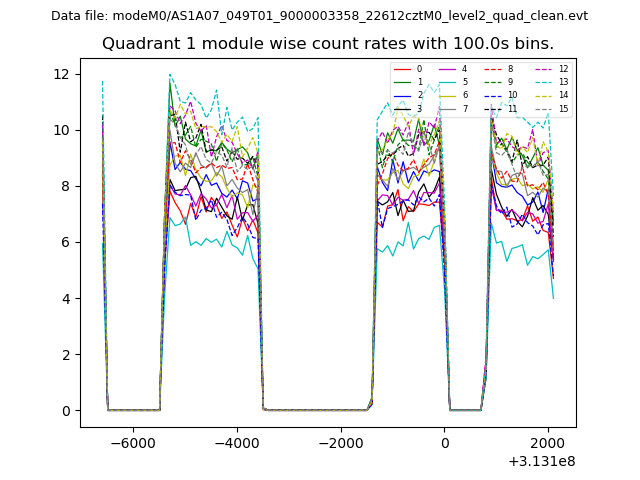
| Module-wise count rates for Quadrant A Data is divided into 100 sec bins |
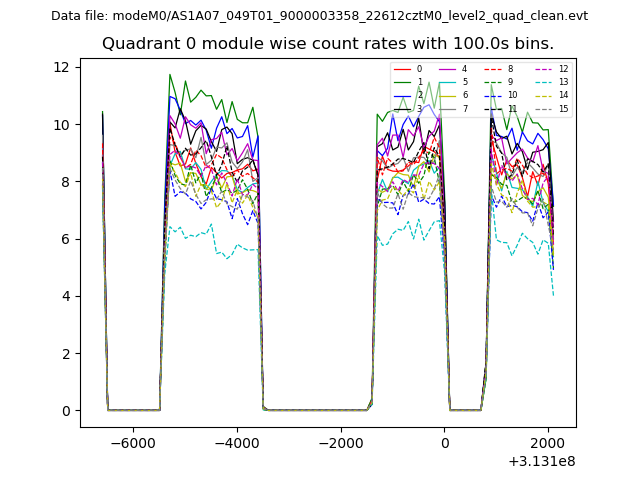 |
 |
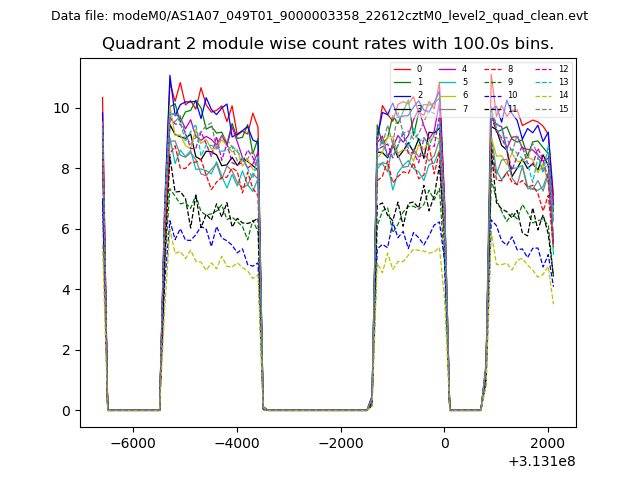
| Module-wise count rates for Quadrant B Data is divided into 100 sec bins |
 |
 |
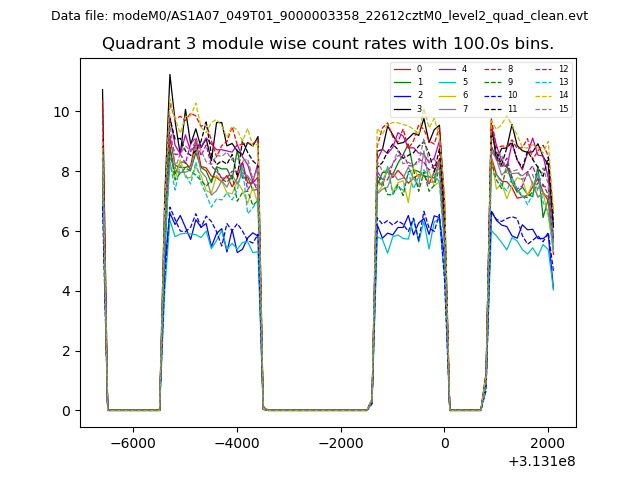
| Module-wise count rates for Quadrant C Data is divided into 100 sec bins |
 |
 |
| Module-wise count rates for Quadrant D Data is divided into 100 sec bins |
 |
 |
| Parameter | Plot |
|---|---|
| CZT HV Monitor | 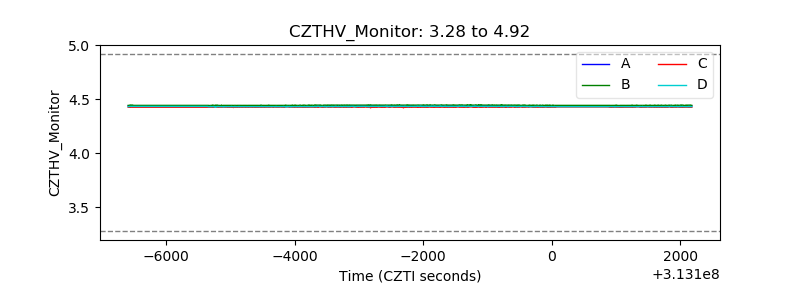 |
| D_VDD |  |
| Temperature 1 | 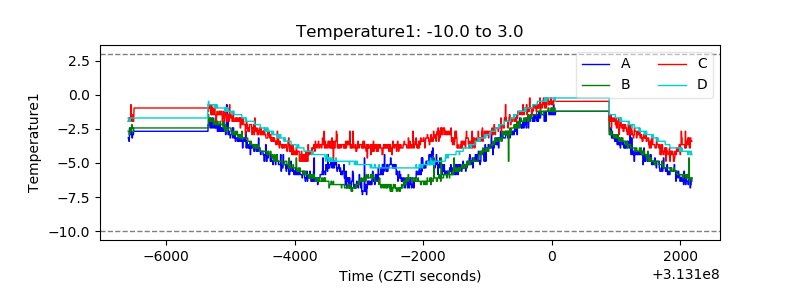 |
| Veto HV Monitor | 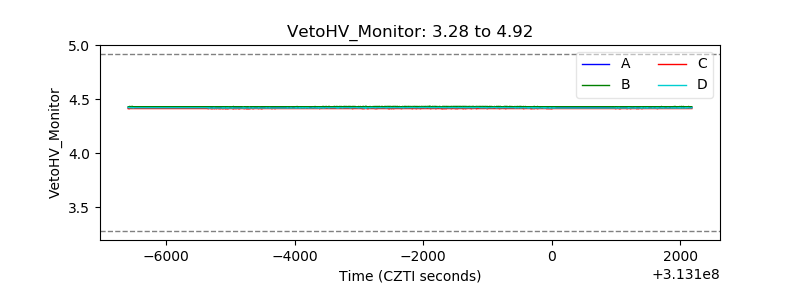 |
| Veto LLD | 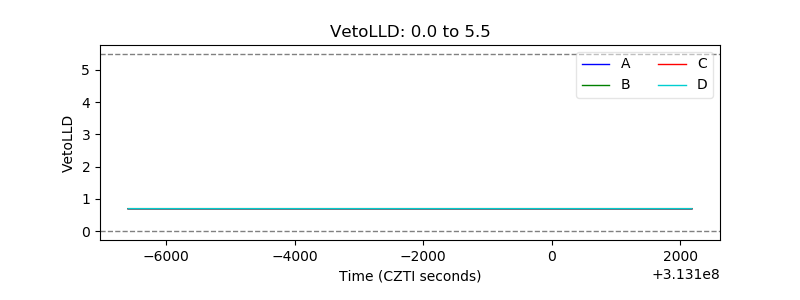 |
| Alpha Counter | 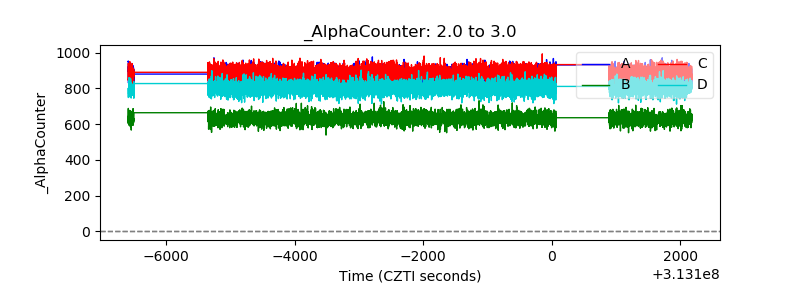 |
| _CPM_Rate | 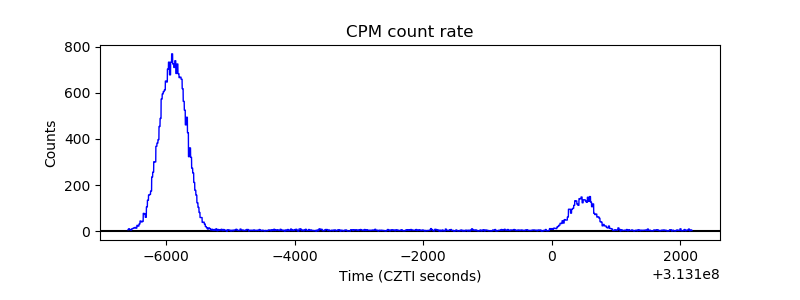 |
| CZT Counter | 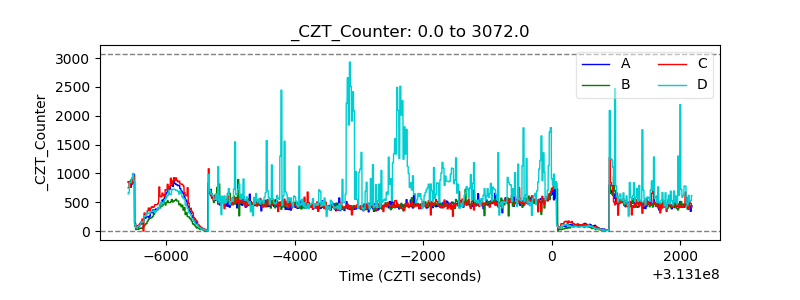 |
| +2.5 Volts monitor |  |
| +5 Volts monitor | 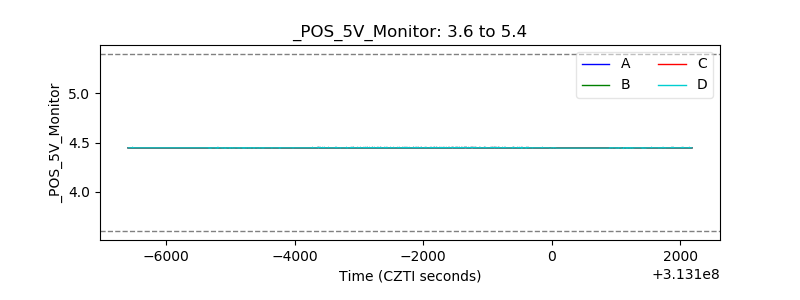 |
| _ROLL_ROT | 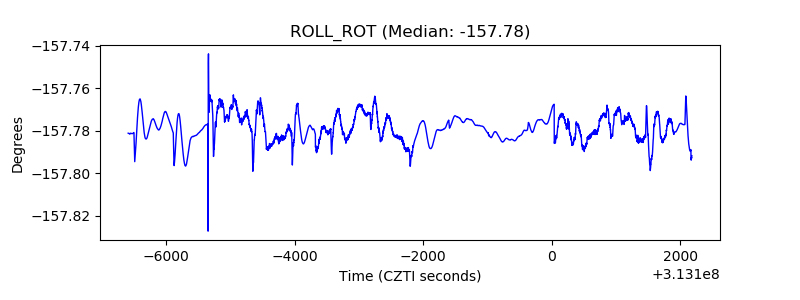 |
| _Roll_DEC | 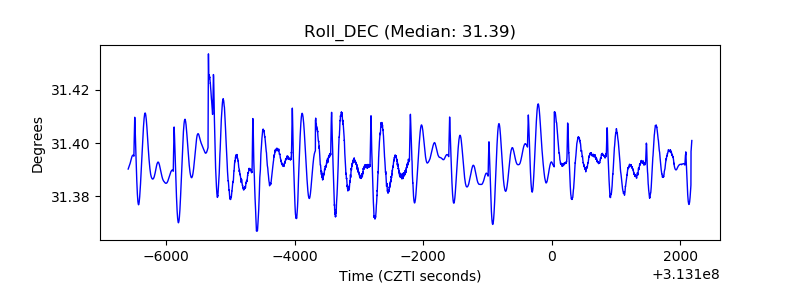 |
| _Roll_RA | 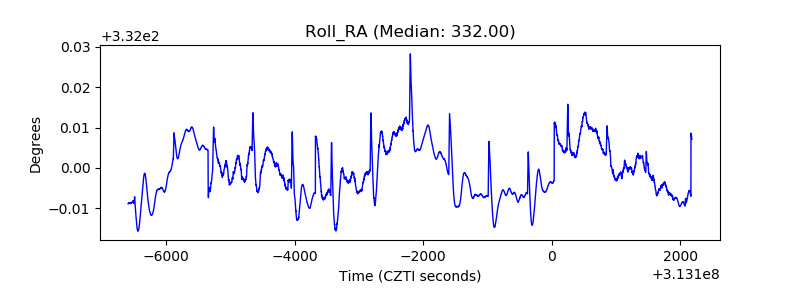 |
| Veto Counter | 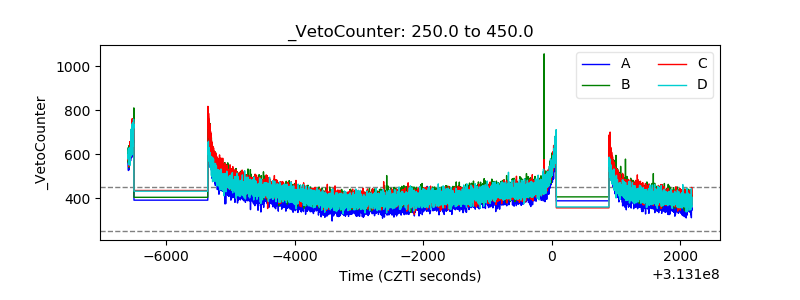 |