| Param | Original file | Final file |
|---|---|---|
| Filename | modeM0/AS1A07_049T01_9000003358_22613cztM0_level2.evt | modeM0/AS1A07_049T01_9000003358_22613cztM0_level2_quad_clean.evt |
| Size (bytes) | 504,103,680 | 96,344,640 |
| Size | 480.8 MB | 91.9 MB |
| Events in quadrant A | 3,381,003 | 615,114 |
| Events in quadrant B | 3,506,481 | 620,960 |
| Events in quadrant C | 3,442,870 | 592,685 |
| Events in quadrant D | 4,441,500 | 581,414 |
| Mode SS | |||
|---|---|---|---|
| Quadrant | BADHDUFLAG | Total packets | Discarded packets |
| A | 0 | 146 | 0 |
| B | 0 | 146 | 0 |
| C | 0 | 146 | 0 |
| D | 0 | 146 | 0 |
| Mode M0 | |||
|---|---|---|---|
| Quadrant | BADHDUFLAG | Total packets | Discarded packets |
| A | 0 | 14919 | 2 |
| B | 0 | 15190 | 2 |
| C | 0 | 14969 | 2 |
| D | 0 | 17982 | 2 |
| Mode M9 | |||
|---|---|---|---|
| Quadrant | BADHDUFLAG | Total packets | Discarded packets |
| A | 0 | 11 | 0 |
| B | 0 | 12 | 0 |
| C | 0 | 12 | 0 |
| D | 0 | 12 | 0 |
| Quadrant | Total seconds | Saturated seconds | Saturation percentage |
|---|---|---|---|
| A | 7295 | 27 | 0.370117% |
| B | 7295 | 47 | 0.644277% |
| C | 7295 | 65 | 0.891021% |
| D | 7295 | 117 | 1.603838% |
Noise dominated data is calculated using 1-second bins in cleaned event files. If a bin has >2000 counts, and if more than 50% of those come from <1% of pixels, then it is considered to be noise-dominated and hence unusable.
| Quadrant | # 1 sec bins | Bins with >0 counts | Bins with >2000 counts | High rate bins dominated by noise | Noise dominated (total time) | Noise dominated (detector-on time) | Marked lightcurve |
|---|---|---|---|---|---|---|---|
| A | 7710 | 7296 | 0 | 0 | 0.00% | 0.00% | 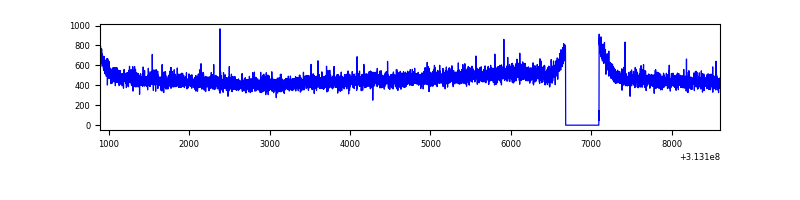 |
| B | 7710 | 7296 | 6 | 6 | 0.08% | 0.08% | 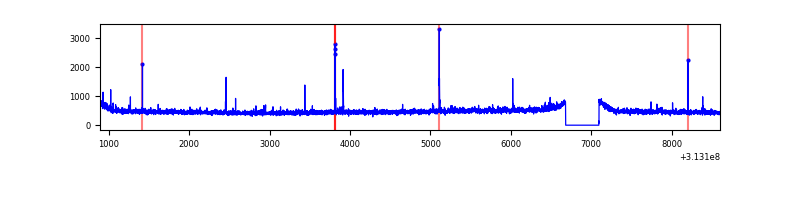 |
| C | 7710 | 7296 | 0 | 0 | 0.00% | 0.00% | 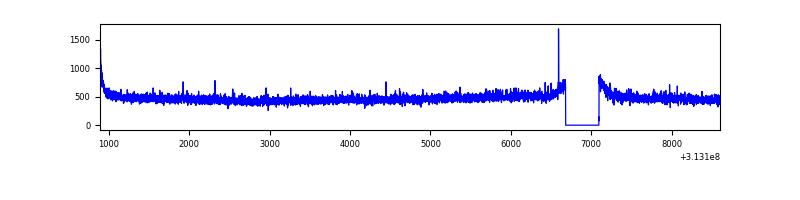 |
| D | 7710 | 7296 | 123 | 123 | 1.60% | 1.69% | 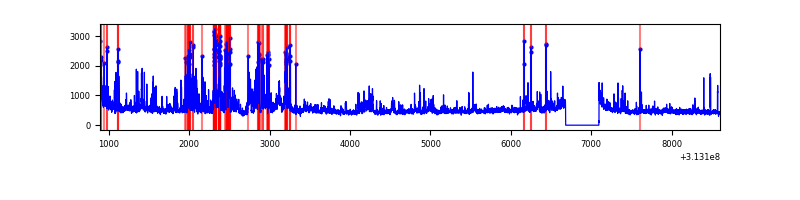 |
Top three noisy pixels from each quadrant. If the there are fewer than three noisy pixels in the level2.evt file, extra rows are filled as -1
| Pixel properties | Quadrant properties | ||||||
|---|---|---|---|---|---|---|---|
| Quadrant | DetID | PixID | Counts | Sigma | Mean | Median | Sigma |
| A | 13 | 254 | 11711 | 60.78 | 876 | 855 | 178.6 |
| A | 0 | 226 | 7589 | 37.7 | 876 | 855 | 178.6 |
| A | 3 | 137 | 7575 | 37.62 | 876 | 855 | 178.6 |
| B | 5 | 172 | 25479 | 145.27 | 875 | 853 | 169.5 |
| B | 12 | 111 | 19934 | 112.56 | 875 | 853 | 169.5 |
| B | 0 | 229 | 18836 | 106.08 | 875 | 853 | 169.5 |
| C | 14 | 238 | 131797 | 661.39 | 843 | 847 | 198.0 |
| C | 0 | 10 | 12259 | 57.64 | 843 | 847 | 198.0 |
| C | 0 | 207 | 8482 | 38.56 | 843 | 847 | 198.0 |
| D | 1 | 52 | 630531 | 3019.65 | 851 | 826 | 208.5 |
| D | 1 | 239 | 428234 | 2049.56 | 851 | 826 | 208.5 |
| D | 13 | 249 | 62196 | 294.29 | 851 | 826 | 208.5 |
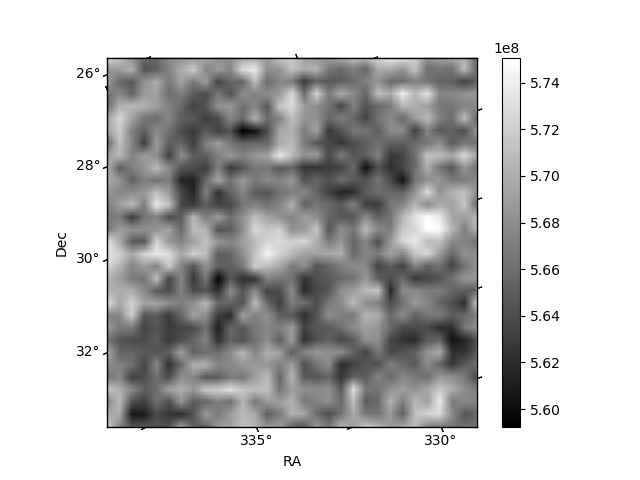
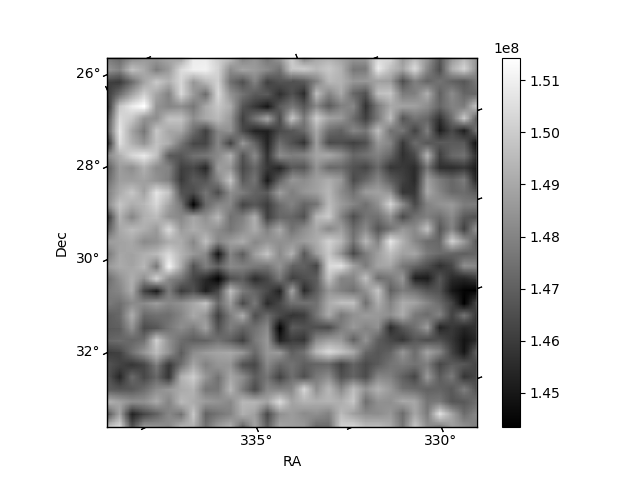
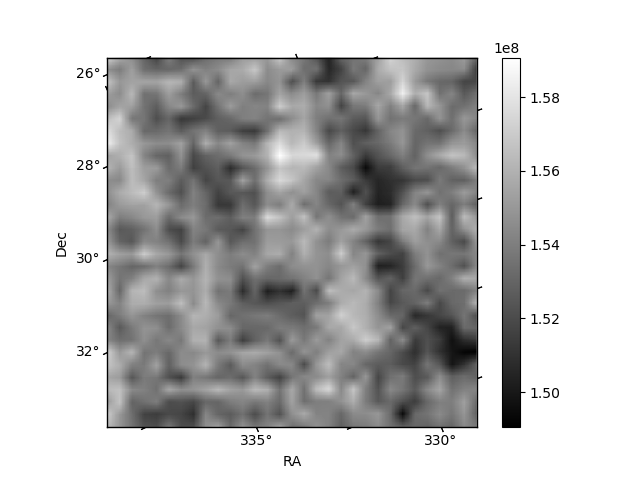
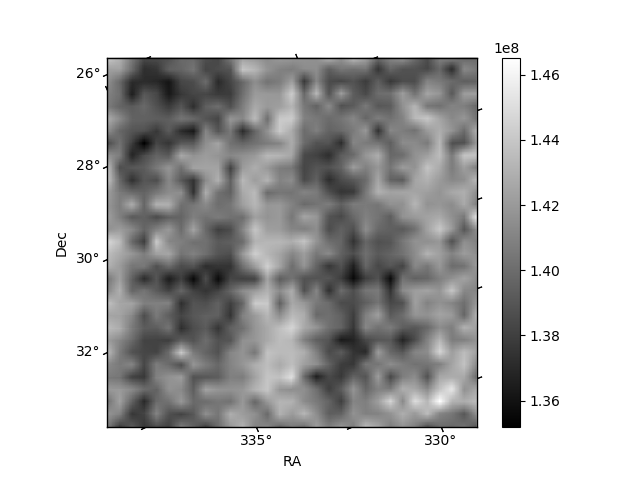
Histogram calculated using DETX and DETY for each event in the final _common_clean file
| Quadrant A | 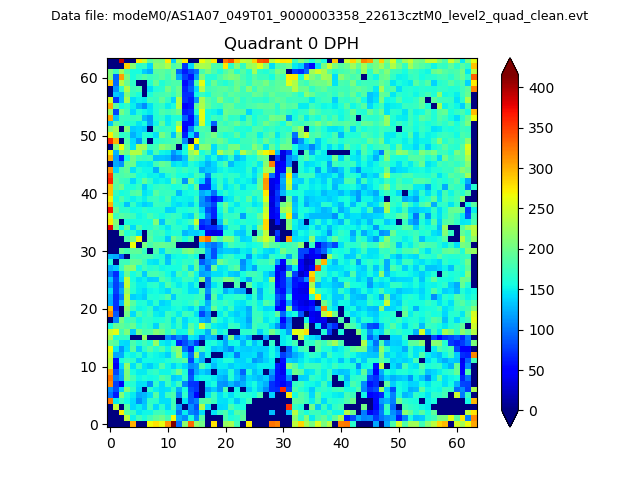 |
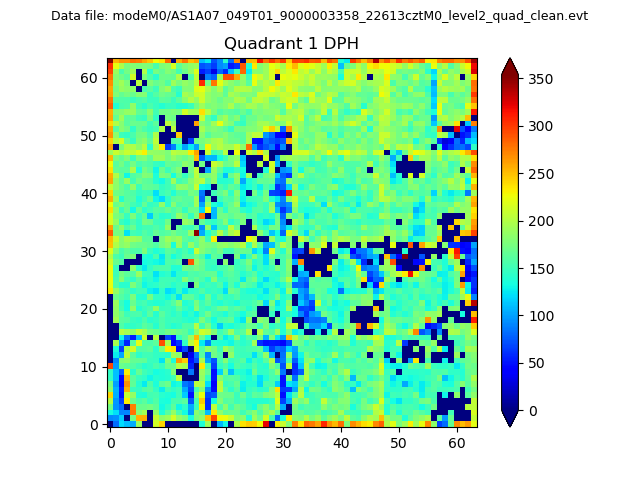 |
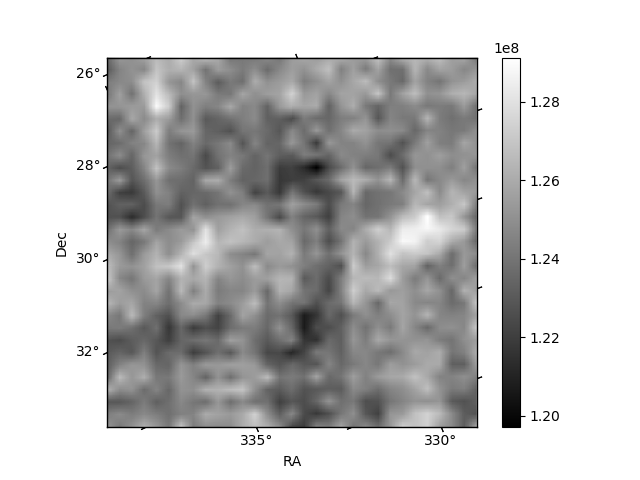
Quadrant B |
|---|---|---|---|
| Quadrant D | 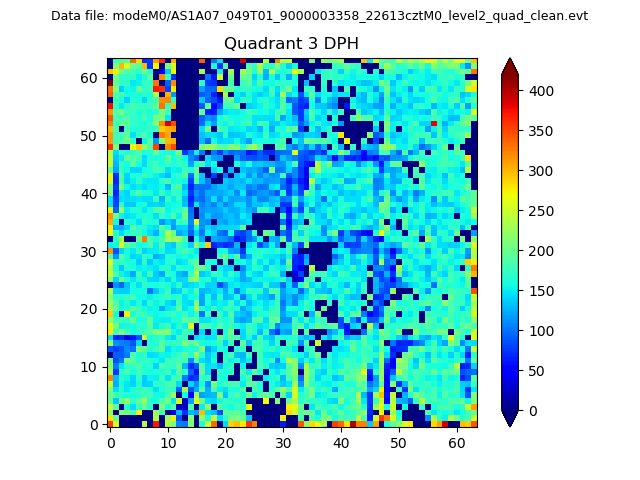 |
 |
Quadrant C |
| Plot type | Count rate plots | Images |
|---|---|---|
| Comparison with Poisson distribution Blue bars denote a histogram of data divided into 1 sec bins. Red curve is a Poisson curve with rate = median count rate of data. |
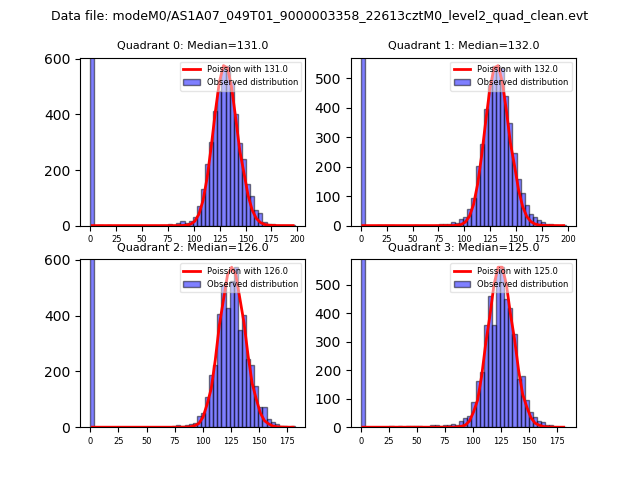 |
 |
| Quadrant-wise count rates Data is divided into 100 sec bins |
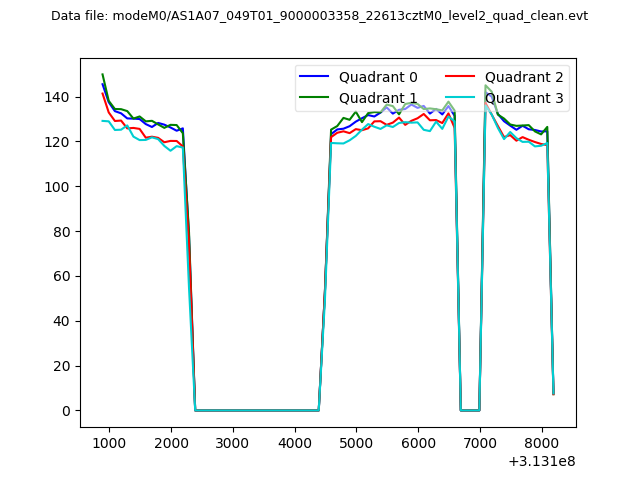 |
|
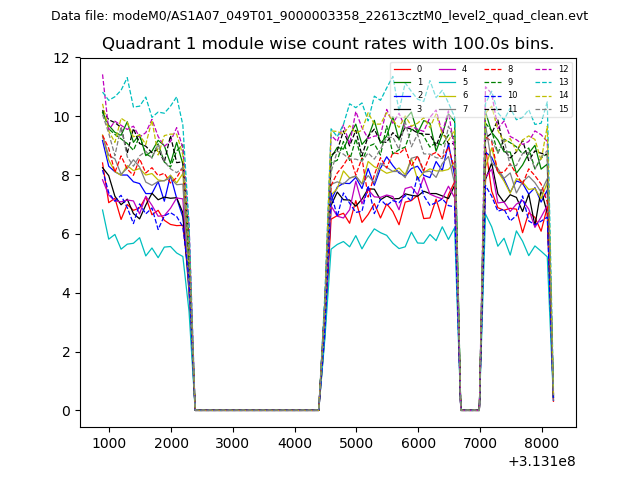
| Module-wise count rates for Quadrant A Data is divided into 100 sec bins |
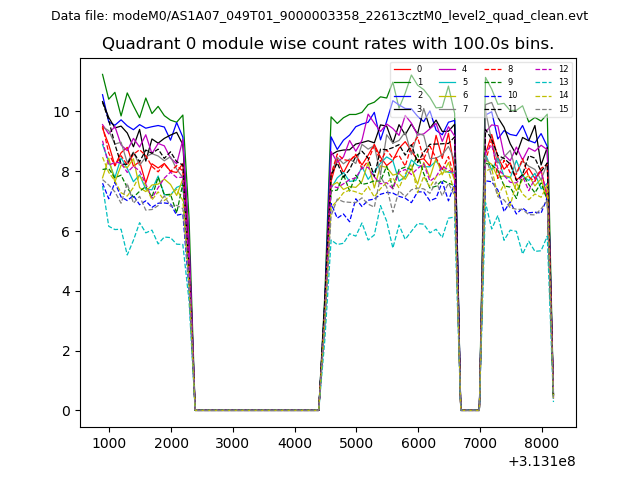 |
 |
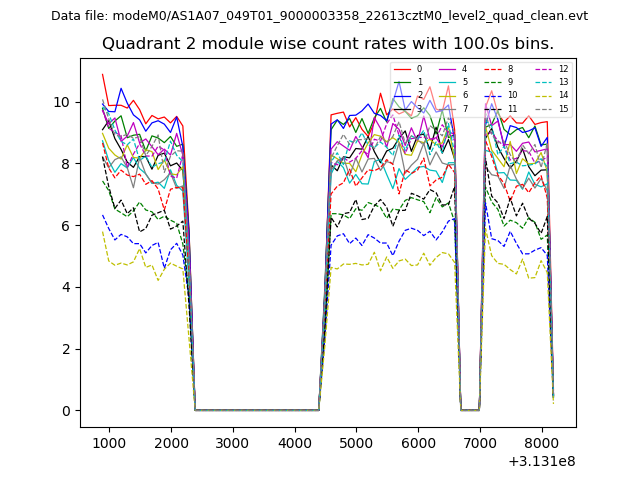
| Module-wise count rates for Quadrant B Data is divided into 100 sec bins |
 |
 |
| Module-wise count rates for Quadrant C Data is divided into 100 sec bins |
 |
 |
| Module-wise count rates for Quadrant D Data is divided into 100 sec bins |
 |
 |
| Parameter | Plot |
|---|---|
| CZT HV Monitor | 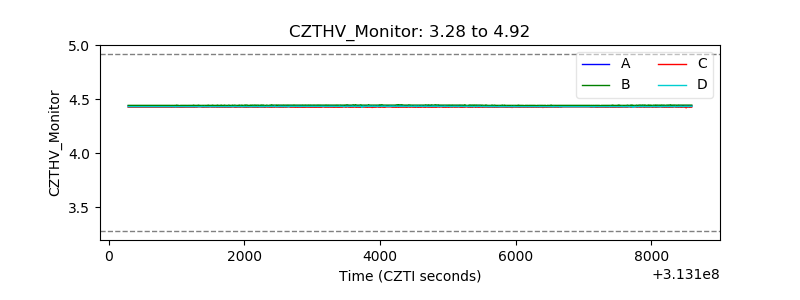 |
| D_VDD | 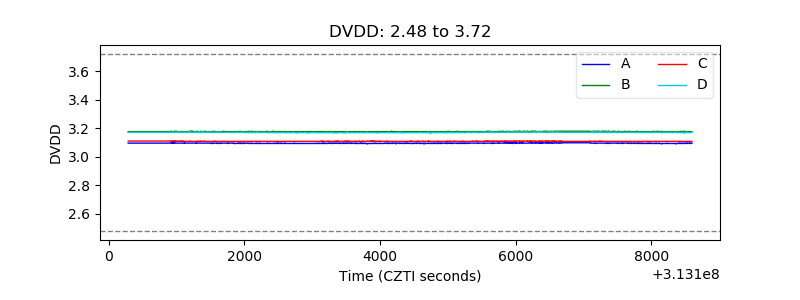 |
| Temperature 1 | 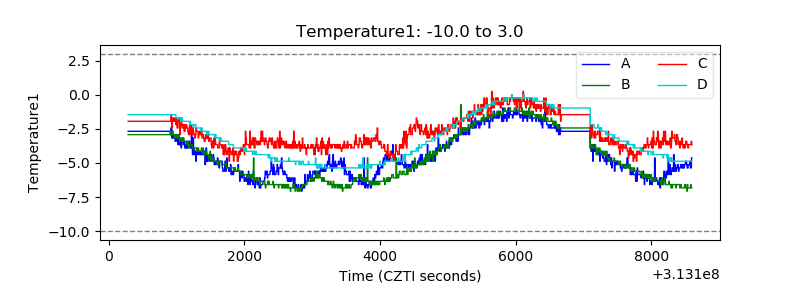 |
| Veto HV Monitor | 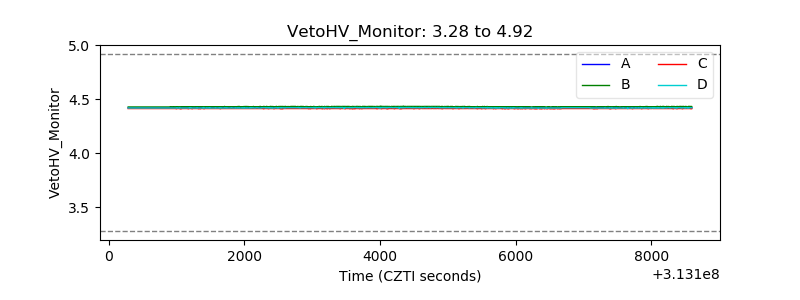 |
| Veto LLD | 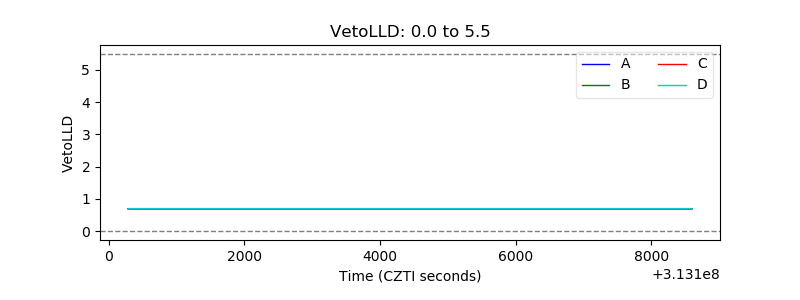 |
| Alpha Counter | 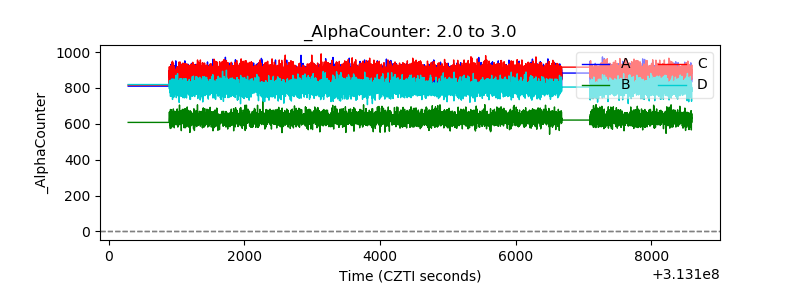 |
| _CPM_Rate | 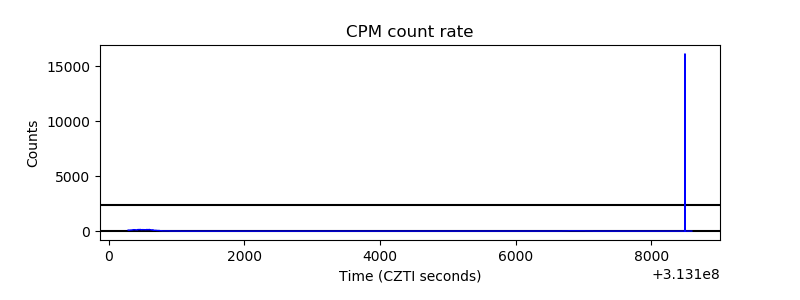 |
| CZT Counter |  |
| +2.5 Volts monitor |  |
| +5 Volts monitor | 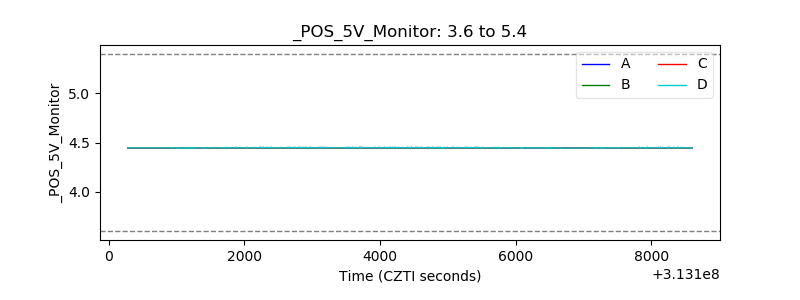 |
| _ROLL_ROT | 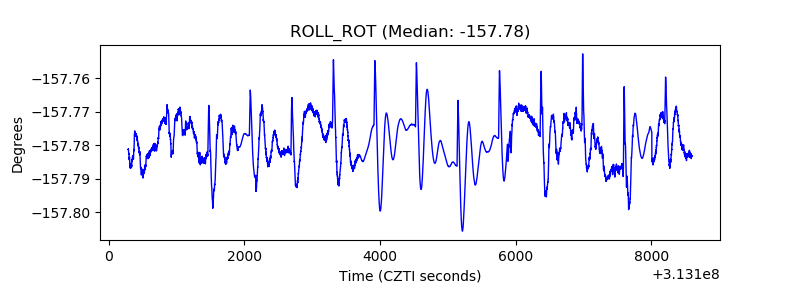 |
| _Roll_DEC | 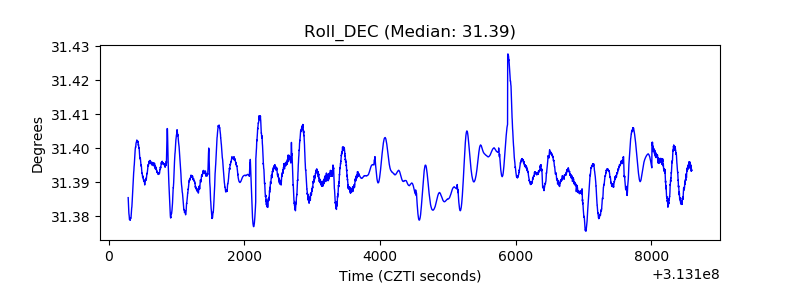 |
| _Roll_RA | 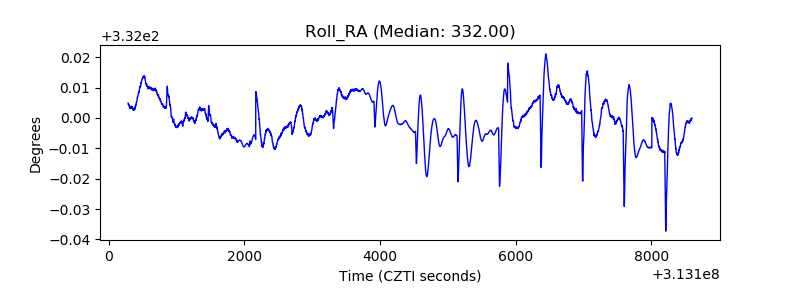 |
| Veto Counter | 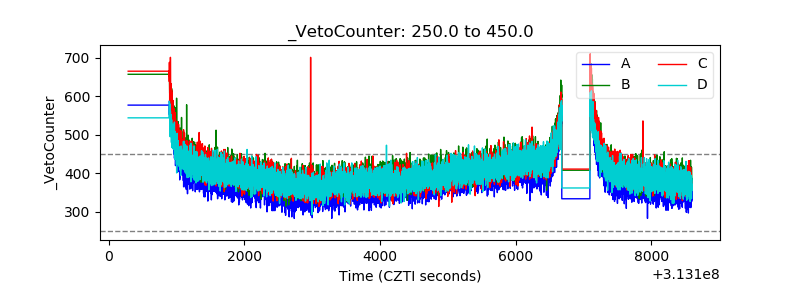 |