| Param | Original file | Final file |
|---|---|---|
| Filename | modeM0/AS1A07_049T01_9000003358_22614cztM0_level2.evt | modeM0/AS1A07_049T01_9000003358_22614cztM0_level2_quad_clean.evt |
| Size (bytes) | 567,959,040 | 95,428,800 |
| Size | 541.6 MB | 91.0 MB |
| Events in quadrant A | 3,649,554 | 600,917 |
| Events in quadrant B | 3,745,995 | 607,628 |
| Events in quadrant C | 3,706,955 | 580,303 |
| Events in quadrant D | 5,569,134 | 558,406 |
| Mode SS | |||
|---|---|---|---|
| Quadrant | BADHDUFLAG | Total packets | Discarded packets |
| A | 0 | 158 | 0 |
| B | 0 | 158 | 0 |
| C | 0 | 158 | 0 |
| D | 0 | 158 | 0 |
| Mode M0 | |||
|---|---|---|---|
| Quadrant | BADHDUFLAG | Total packets | Discarded packets |
| A | 0 | 16112 | 2 |
| B | 0 | 16275 | 2 |
| C | 0 | 16117 | 2 |
| D | 0 | 21985 | 2 |
| Mode M9 | |||
|---|---|---|---|
| Quadrant | BADHDUFLAG | Total packets | Discarded packets |
| A | 0 | 8 | 0 |
| B | 0 | 8 | 0 |
| C | 0 | 8 | 0 |
| D | 0 | 8 | 0 |
| Quadrant | Total seconds | Saturated seconds | Saturation percentage |
|---|---|---|---|
| A | 7809 | 45 | 0.576258% |
| B | 7810 | 94 | 1.203585% |
| C | 7810 | 99 | 1.267606% |
| D | 7810 | 296 | 3.790013% |
Noise dominated data is calculated using 1-second bins in cleaned event files. If a bin has >2000 counts, and if more than 50% of those come from <1% of pixels, then it is considered to be noise-dominated and hence unusable.
| Quadrant | # 1 sec bins | Bins with >0 counts | Bins with >2000 counts | High rate bins dominated by noise | Noise dominated (total time) | Noise dominated (detector-on time) | Marked lightcurve |
|---|---|---|---|---|---|---|---|
| A | 8514 | 7811 | 0 | 0 | 0.00% | 0.00% | 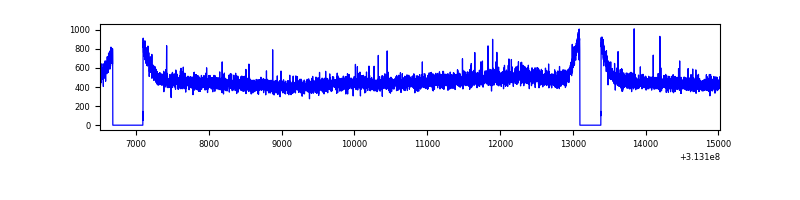 |
| B | 8515 | 7812 | 6 | 6 | 0.07% | 0.08% | 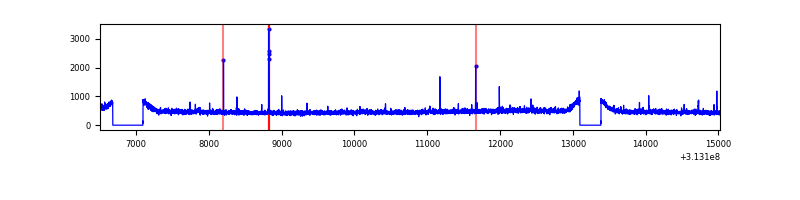 |
| C | 8515 | 7812 | 0 | 0 | 0.00% | 0.00% | 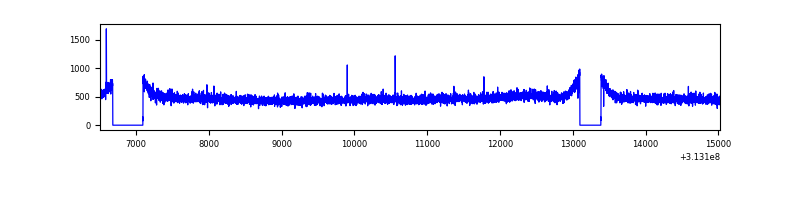 |
| D | 8515 | 7812 | 247 | 247 | 2.90% | 3.16% | 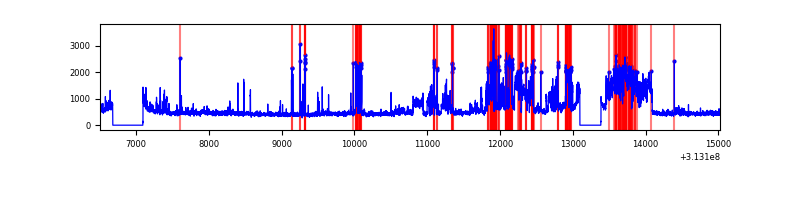 |
Top three noisy pixels from each quadrant. If the there are fewer than three noisy pixels in the level2.evt file, extra rows are filled as -1
| Pixel properties | Quadrant properties | ||||||
|---|---|---|---|---|---|---|---|
| Quadrant | DetID | PixID | Counts | Sigma | Mean | Median | Sigma |
| A | 13 | 254 | 13329 | 64.95 | 945 | 922 | 191.0 |
| A | 3 | 137 | 8190 | 38.05 | 945 | 922 | 191.0 |
| A | 0 | 226 | 7975 | 36.92 | 945 | 922 | 191.0 |
| B | 12 | 111 | 22112 | 115.78 | 942 | 915 | 183.1 |
| B | 11 | 111 | 19535 | 101.71 | 942 | 915 | 183.1 |
| B | 5 | 172 | 18394 | 95.48 | 942 | 915 | 183.1 |
| C | 14 | 238 | 141297 | 652.04 | 910 | 916 | 215.3 |
| C | 0 | 207 | 9899 | 41.72 | 910 | 916 | 215.3 |
| C | 13 | 61 | 6352 | 25.25 | 910 | 916 | 215.3 |
| D | 1 | 52 | 1836209 | 8197.32 | 916 | 888 | 223.9 |
| D | 12 | 227 | 134279 | 595.78 | 916 | 888 | 223.9 |
| D | 7 | 223 | 44900 | 196.58 | 916 | 888 | 223.9 |
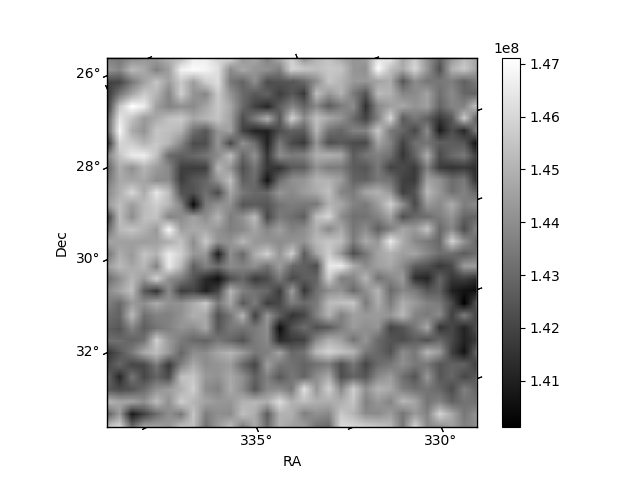
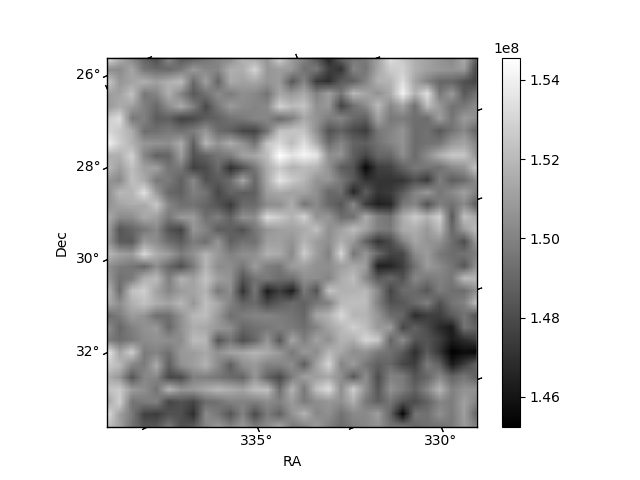
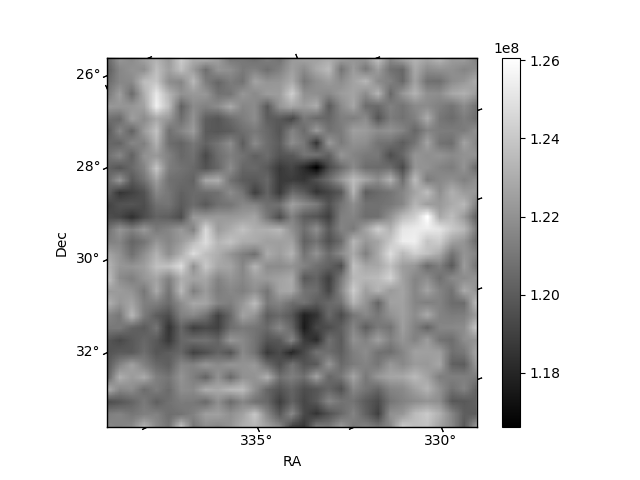
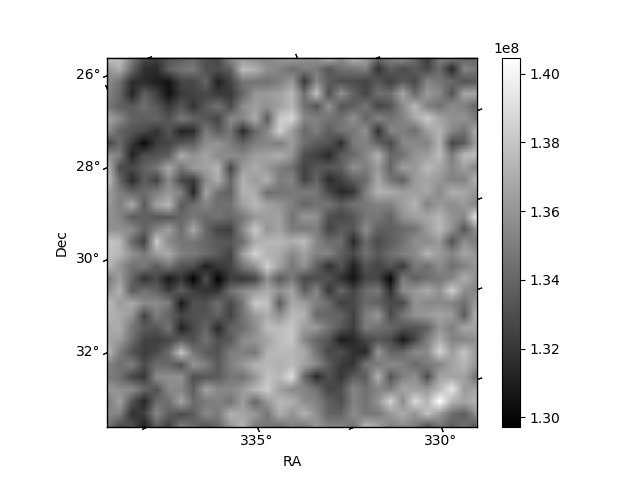
Histogram calculated using DETX and DETY for each event in the final _common_clean file
| Quadrant A | 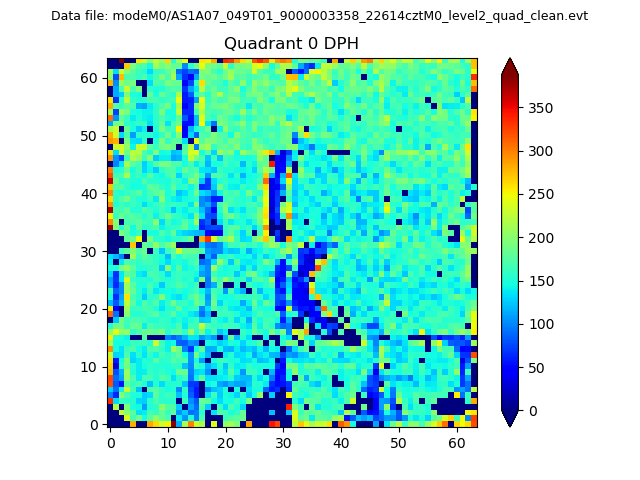 |
 |
Quadrant B |
|---|---|---|---|
| Quadrant D |  |
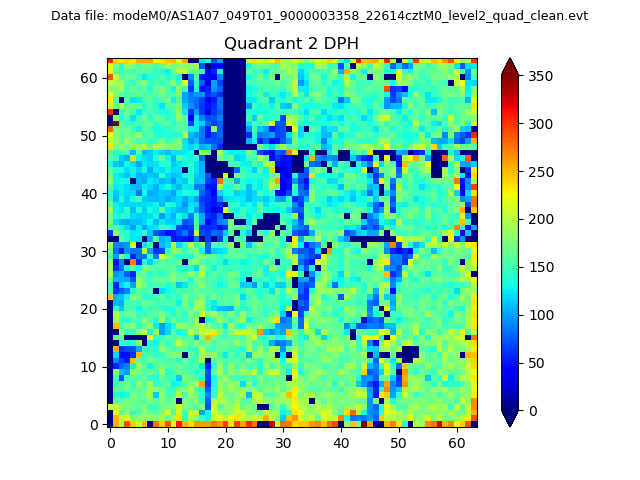 |
Quadrant C |
| Plot type | Count rate plots | Images |
|---|---|---|
| Comparison with Poisson distribution Blue bars denote a histogram of data divided into 1 sec bins. Red curve is a Poisson curve with rate = median count rate of data. |
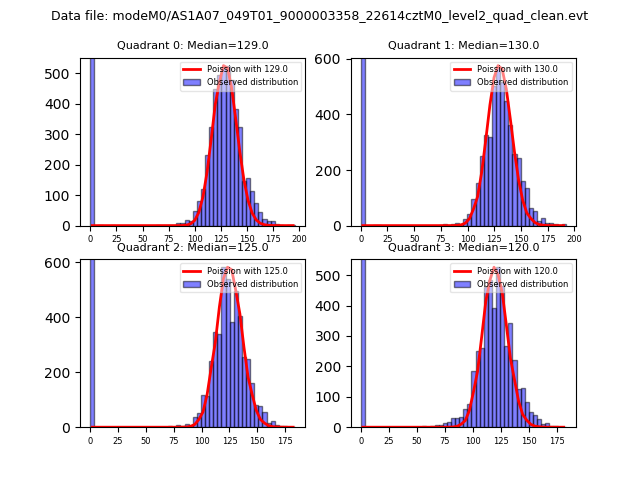 |
 |
| Quadrant-wise count rates Data is divided into 100 sec bins |
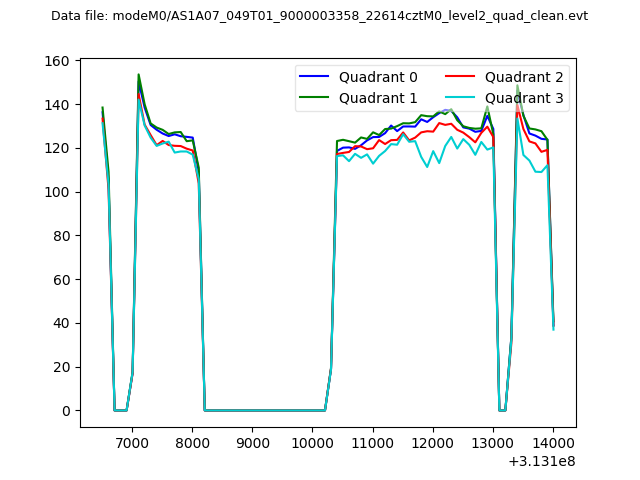 |
|
| Module-wise count rates for Quadrant A Data is divided into 100 sec bins |
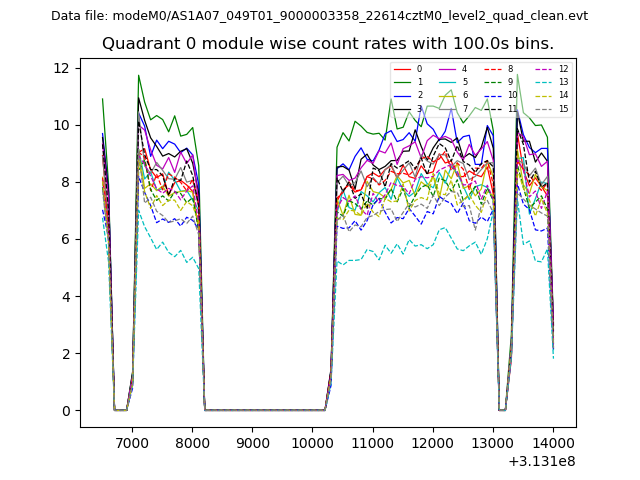 |
 |
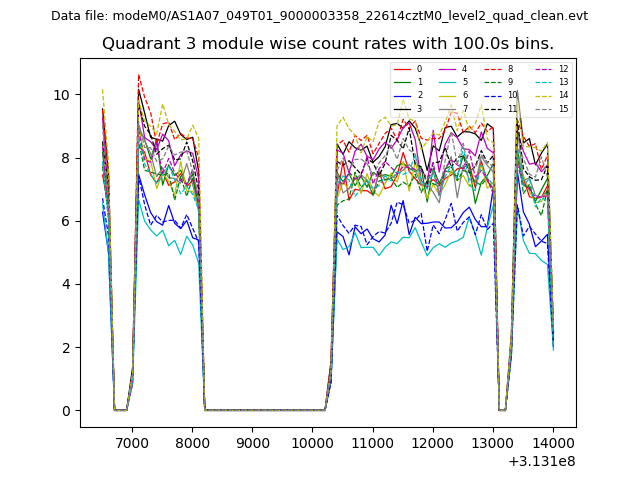
| Module-wise count rates for Quadrant B Data is divided into 100 sec bins |
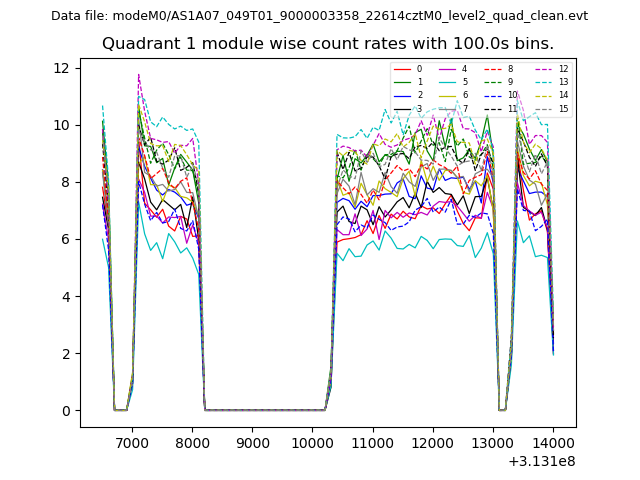 |
 |
| Module-wise count rates for Quadrant C Data is divided into 100 sec bins |
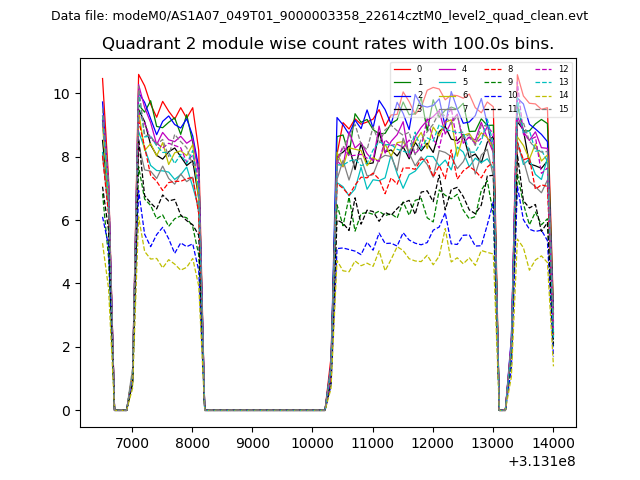 |
 |
| Module-wise count rates for Quadrant D Data is divided into 100 sec bins |
 |
 |
| Parameter | Plot |
|---|---|
| CZT HV Monitor | 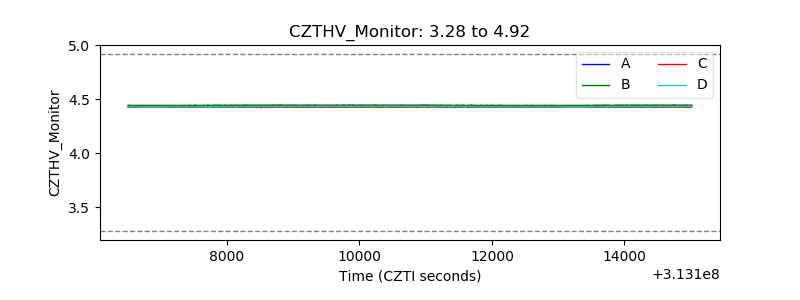 |
| D_VDD | 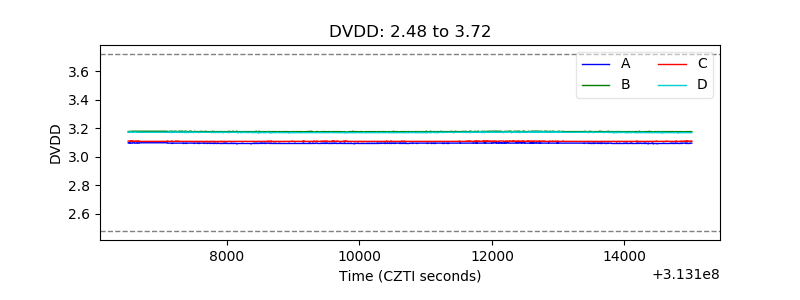 |
| Temperature 1 | 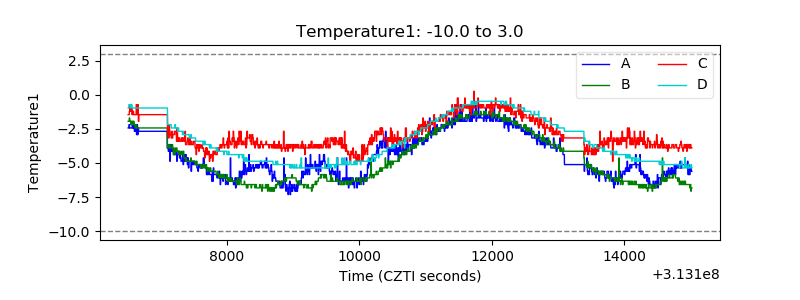 |
| Veto HV Monitor | 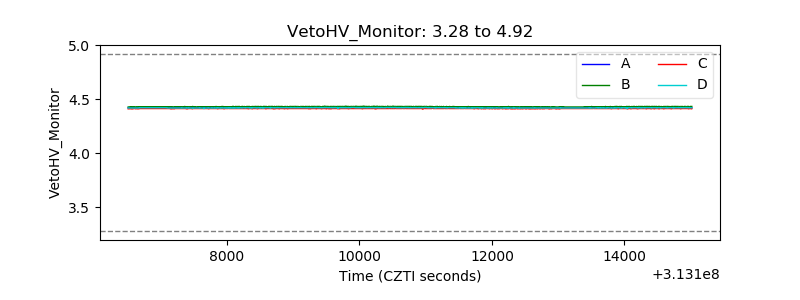 |
| Veto LLD | 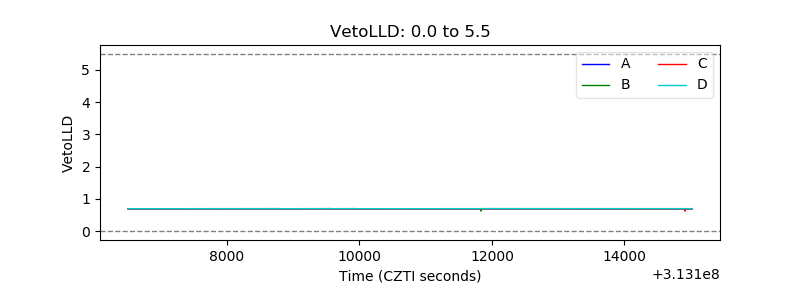 |
| Alpha Counter | 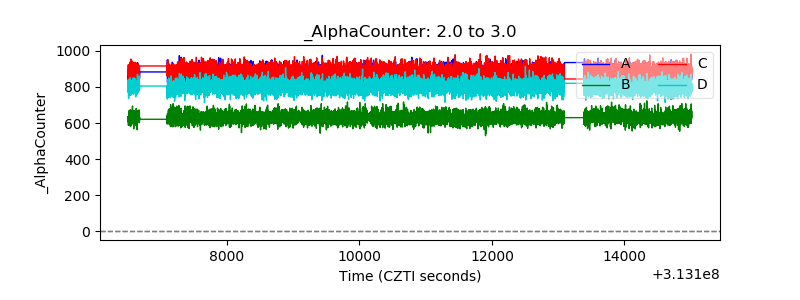 |
| _CPM_Rate | 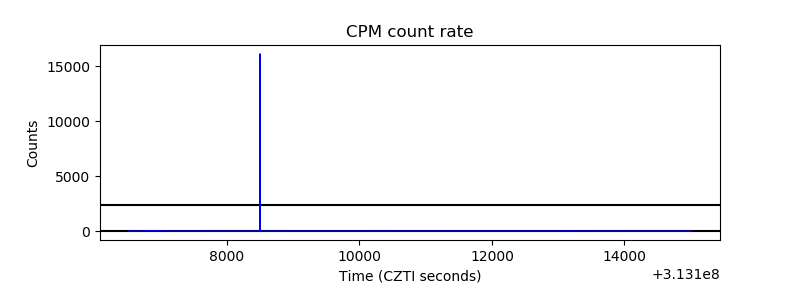 |
| CZT Counter | 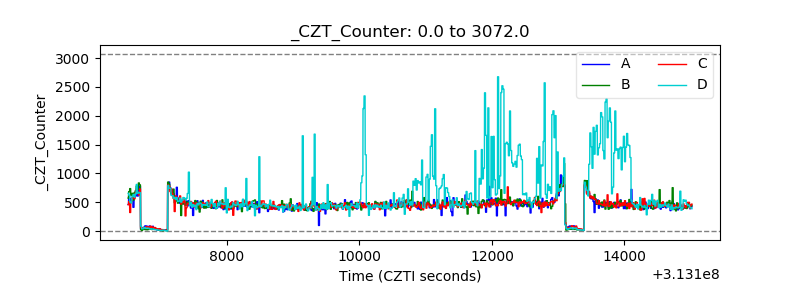 |
| +2.5 Volts monitor |  |
| +5 Volts monitor | 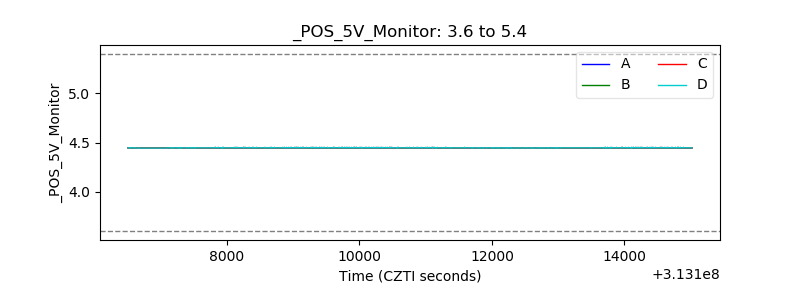 |
| _ROLL_ROT | 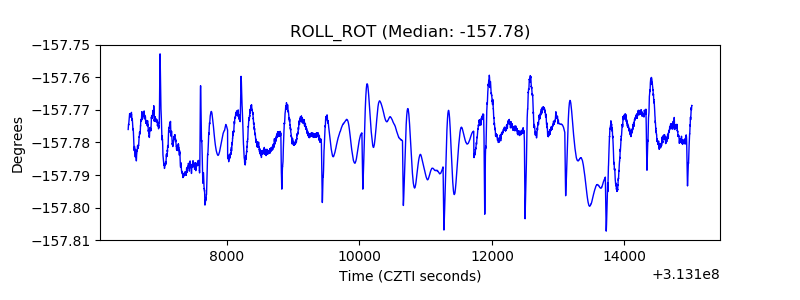 |
| _Roll_DEC | 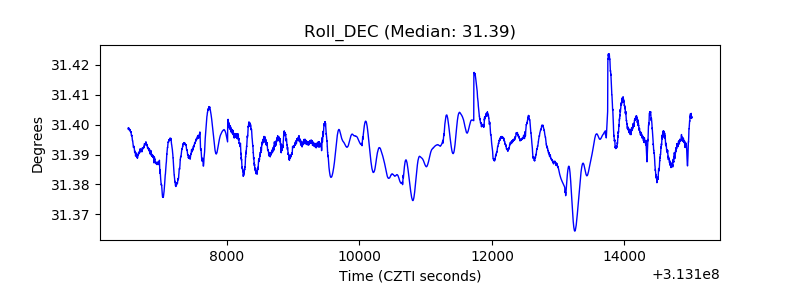 |
| _Roll_RA | 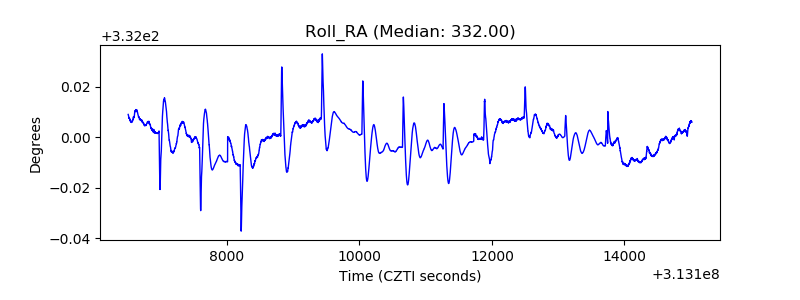 |
| Veto Counter | 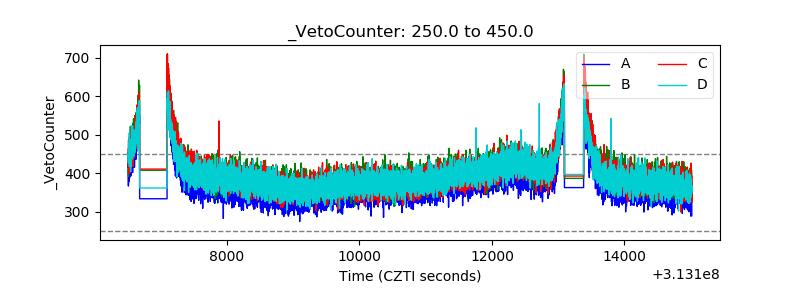 |