| Param | Original file | Final file |
|---|---|---|
| Filename | modeM0/AS1A07_049T01_9000003358_22617cztM0_level2.evt | modeM0/AS1A07_049T01_9000003358_22617cztM0_level2_quad_clean.evt |
| Size (bytes) | 875,450,880 | 156,798,720 |
| Size | 834.9 MB | 149.5 MB |
| Events in quadrant A | 6,189,347 | 970,762 |
| Events in quadrant B | 6,395,738 | 982,238 |
| Events in quadrant C | 6,337,020 | 945,222 |
| Events in quadrant D | 6,688,104 | 929,669 |
| Mode SS | |||
|---|---|---|---|
| Quadrant | BADHDUFLAG | Total packets | Discarded packets |
| A | 0 | 274 | 0 |
| B | 0 | 274 | 0 |
| C | 0 | 274 | 0 |
| D | 0 | 274 | 0 |
| Mode M0 | |||
|---|---|---|---|
| Quadrant | BADHDUFLAG | Total packets | Discarded packets |
| A | 0 | 27123 | 3 |
| B | 0 | 27476 | 3 |
| C | 0 | 27337 | 3 |
| D | 0 | 28752 | 3 |
| Mode M9 | |||
|---|---|---|---|
| Quadrant | BADHDUFLAG | Total packets | Discarded packets |
| A | 0 | 17 | 0 |
| B | 0 | 17 | 0 |
| C | 0 | 17 | 0 |
| D | 0 | 17 | 0 |
| Quadrant | Total seconds | Saturated seconds | Saturation percentage |
|---|---|---|---|
| A | 13324 | 104 | 0.780546% |
| B | 13325 | 151 | 1.133208% |
| C | 13325 | 180 | 1.350844% |
| D | 13325 | 129 | 0.968105% |
Noise dominated data is calculated using 1-second bins in cleaned event files. If a bin has >2000 counts, and if more than 50% of those come from <1% of pixels, then it is considered to be noise-dominated and hence unusable.
| Quadrant | # 1 sec bins | Bins with >0 counts | Bins with >2000 counts | High rate bins dominated by noise | Noise dominated (total time) | Noise dominated (detector-on time) | Marked lightcurve |
|---|---|---|---|---|---|---|---|
| A | 15055 | 13327 | 0 | 0 | 0.00% | 0.00% | 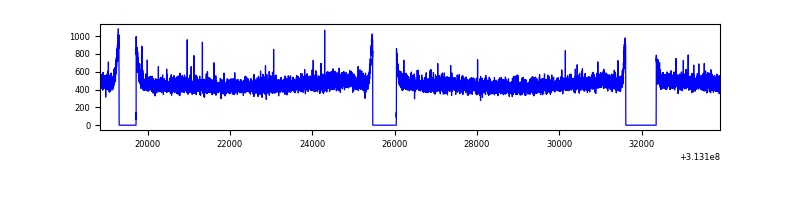 |
| B | 15056 | 13328 | 5 | 5 | 0.03% | 0.04% | 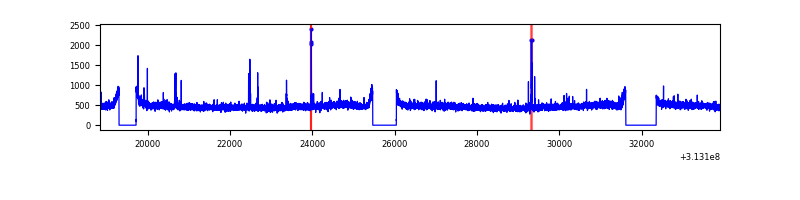 |
| C | 15056 | 13328 | 0 | 0 | 0.00% | 0.00% | 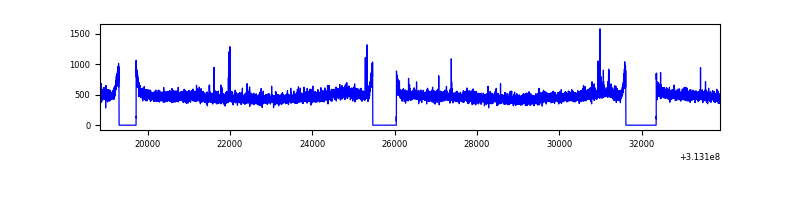 |
| D | 15056 | 13328 | 41 | 41 | 0.27% | 0.31% | 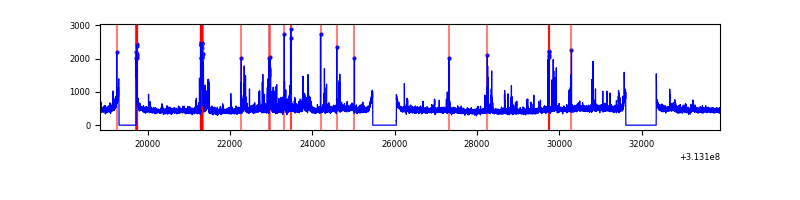 |
Top three noisy pixels from each quadrant. If the there are fewer than three noisy pixels in the level2.evt file, extra rows are filled as -1
| Pixel properties | Quadrant properties | ||||||
|---|---|---|---|---|---|---|---|
| Quadrant | DetID | PixID | Counts | Sigma | Mean | Median | Sigma |
| A | 13 | 254 | 21613 | 61.93 | 1605 | 1569 | 323.7 |
| A | 3 | 137 | 14052 | 38.57 | 1605 | 1569 | 323.7 |
| A | 0 | 226 | 13795 | 37.77 | 1605 | 1569 | 323.7 |
| B | 12 | 111 | 38938 | 121.52 | 1601 | 1563 | 307.6 |
| B | 0 | 190 | 34224 | 106.19 | 1601 | 1563 | 307.6 |
| B | 11 | 111 | 33764 | 104.7 | 1601 | 1563 | 307.6 |
| C | 14 | 238 | 243056 | 665.67 | 1546 | 1556 | 362.8 |
| C | 10 | 22 | 30964 | 81.06 | 1546 | 1556 | 362.8 |
| C | 10 | 222 | 18504 | 46.71 | 1546 | 1556 | 362.8 |
| D | 1 | 52 | 294231 | 772.15 | 1561 | 1517 | 379.1 |
| D | 2 | 136 | 209927 | 549.77 | 1561 | 1517 | 379.1 |
| D | 12 | 233 | 148818 | 388.57 | 1561 | 1517 | 379.1 |
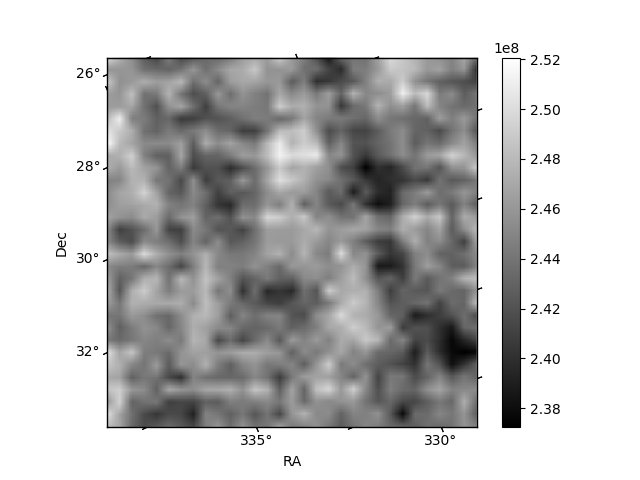
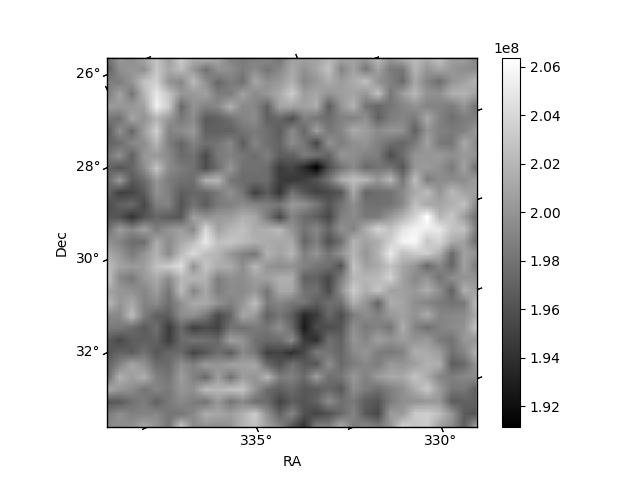
Histogram calculated using DETX and DETY for each event in the final _common_clean file
| Quadrant A | 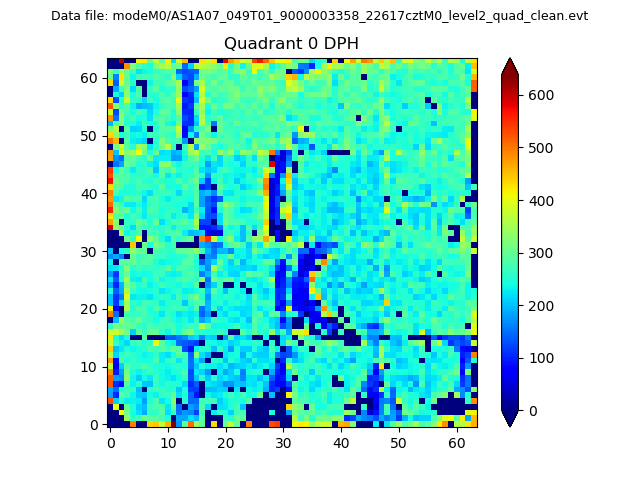 |
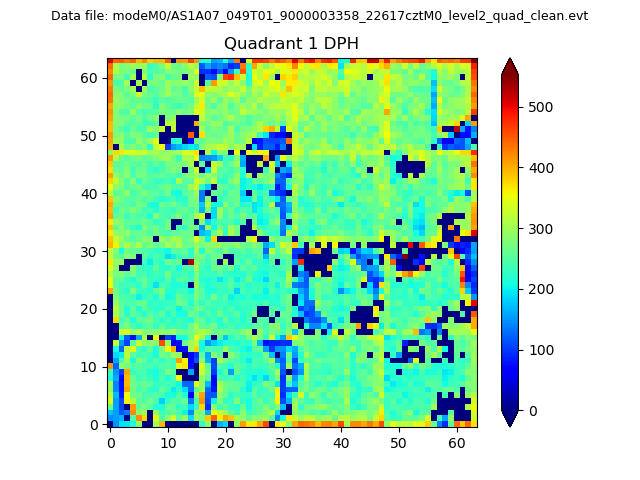 |
Quadrant B |
|---|---|---|---|
| Quadrant D | 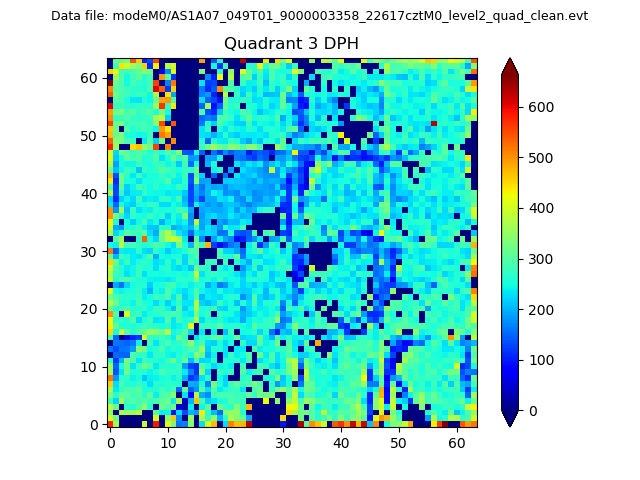 |
 |
Quadrant C |
| Plot type | Count rate plots | Images |
|---|---|---|
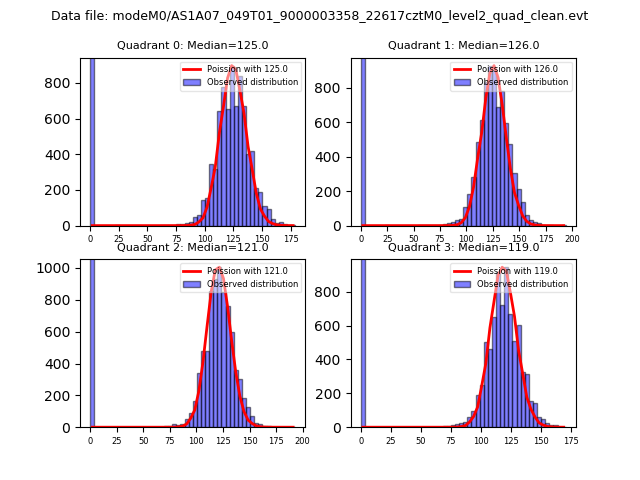
| Comparison with Poisson distribution Blue bars denote a histogram of data divided into 1 sec bins. Red curve is a Poisson curve with rate = median count rate of data. |
 |
 |
| Quadrant-wise count rates Data is divided into 100 sec bins |
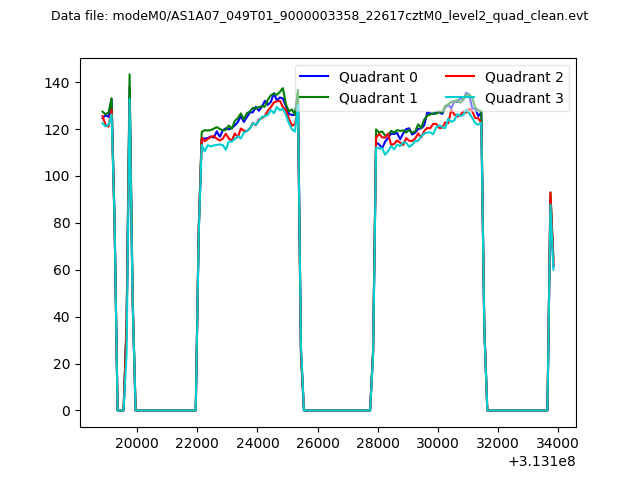 |
|
| Module-wise count rates for Quadrant A Data is divided into 100 sec bins |
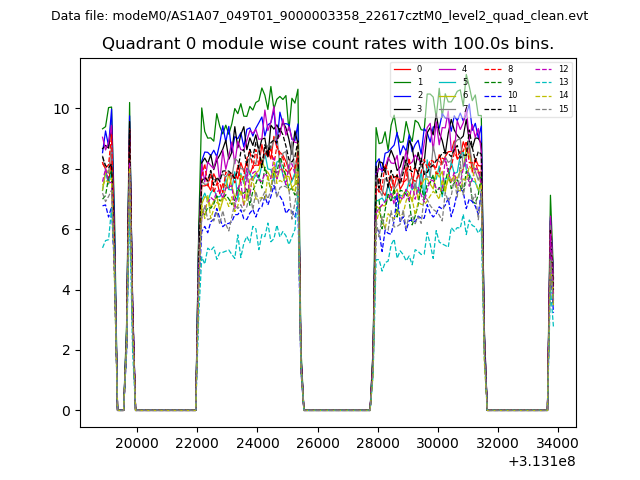 |
 |
| Module-wise count rates for Quadrant B Data is divided into 100 sec bins |
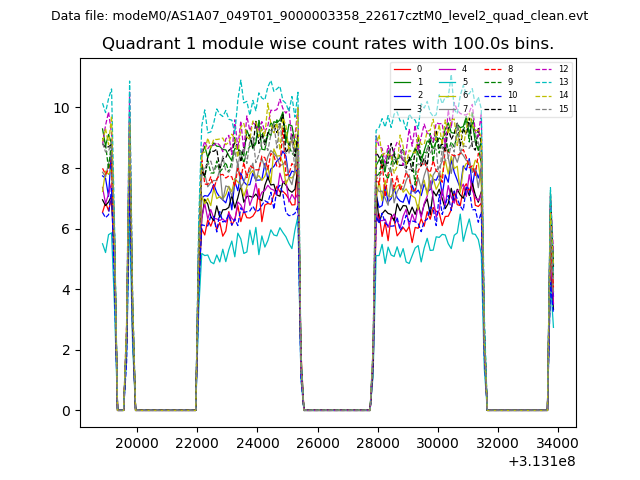 |
 |
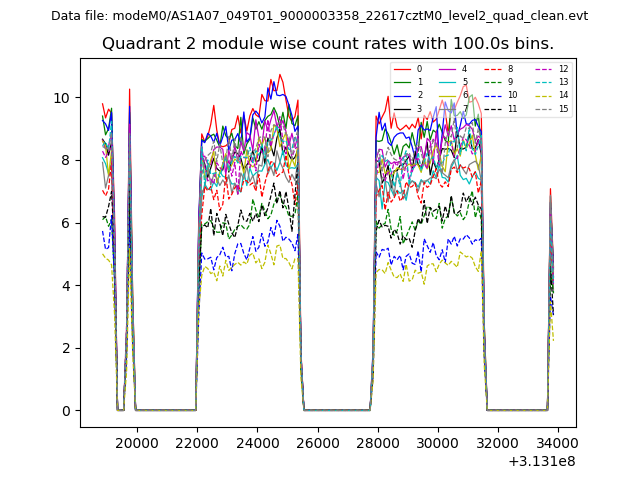
| Module-wise count rates for Quadrant C Data is divided into 100 sec bins |
 |
 |
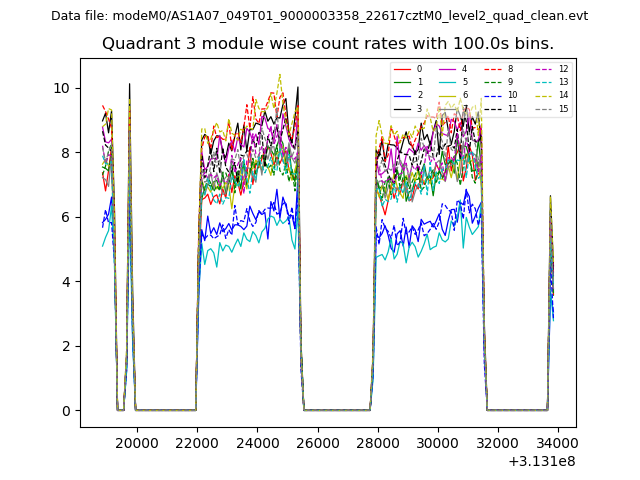
| Module-wise count rates for Quadrant D Data is divided into 100 sec bins |
 |
 |
| Parameter | Plot |
|---|---|
| CZT HV Monitor | 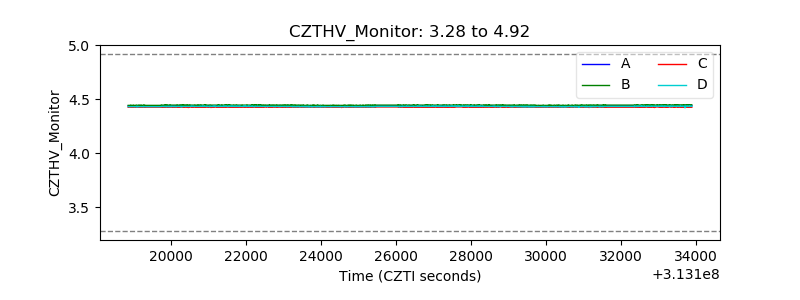 |
| D_VDD | 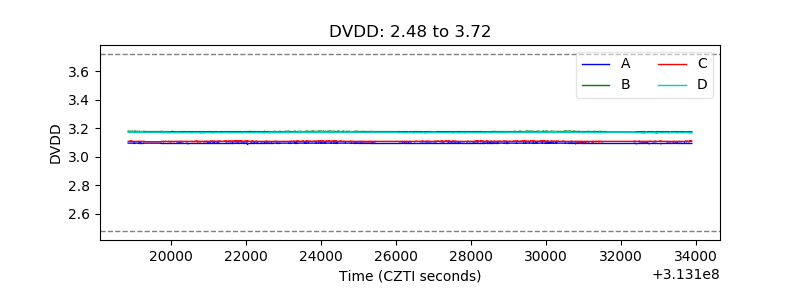 |
| Temperature 1 | 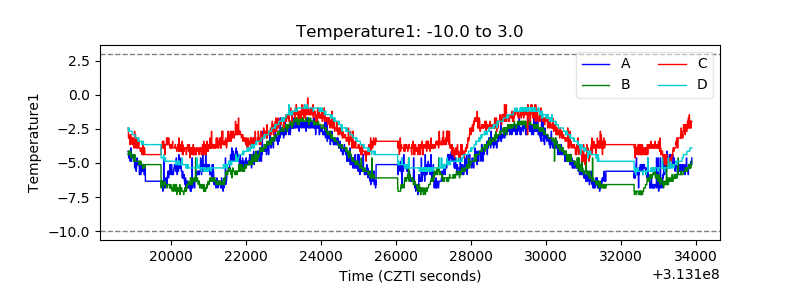 |
| Veto HV Monitor | 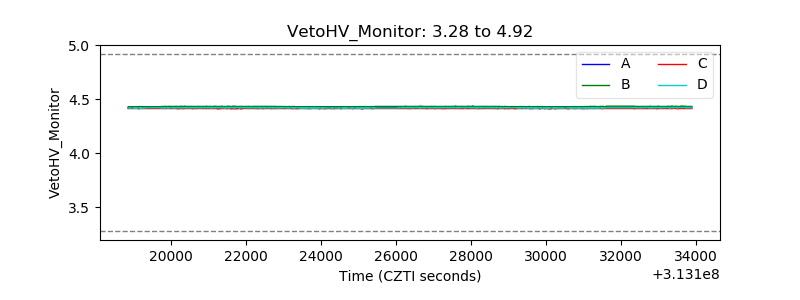 |
| Veto LLD | 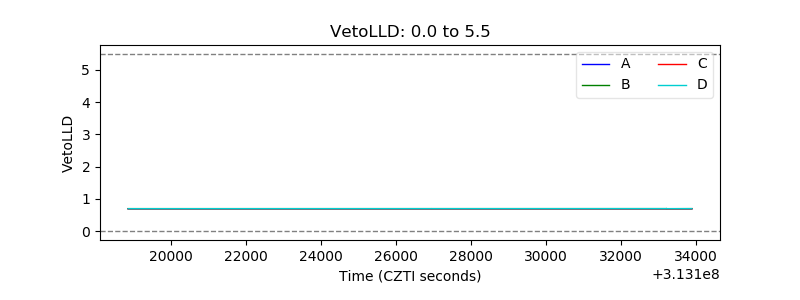 |
| Alpha Counter | 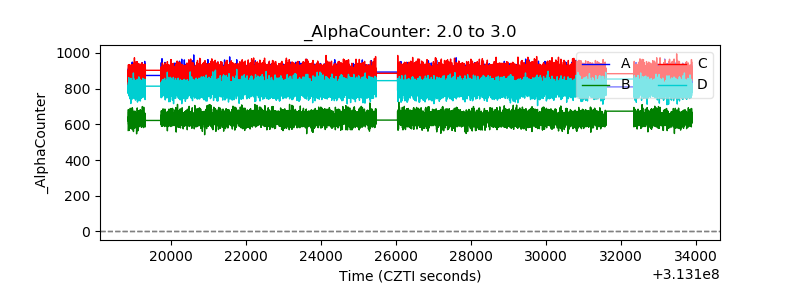 |
| _CPM_Rate | 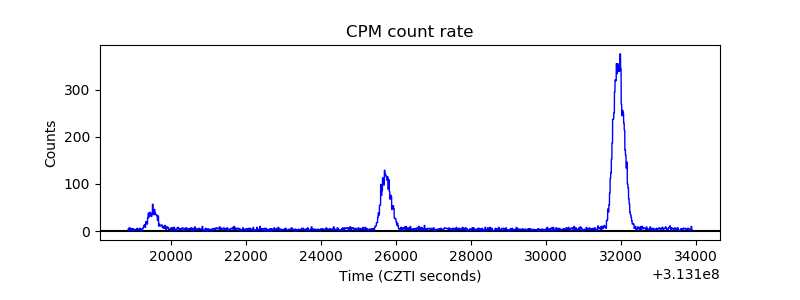 |
| CZT Counter |  |
| +2.5 Volts monitor |  |
| +5 Volts monitor |  |
| _ROLL_ROT | 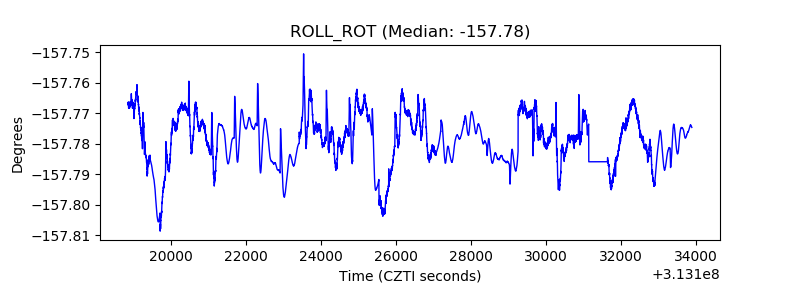 |
| _Roll_DEC | 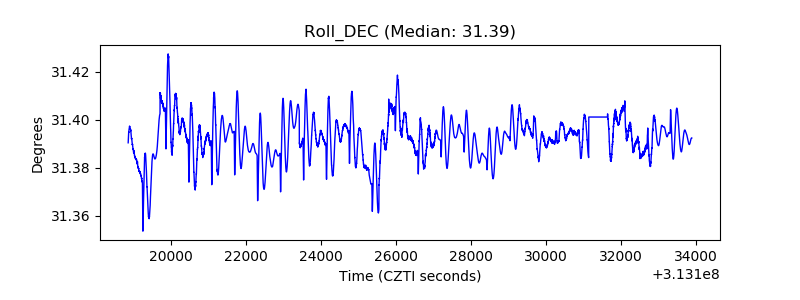 |
| _Roll_RA | 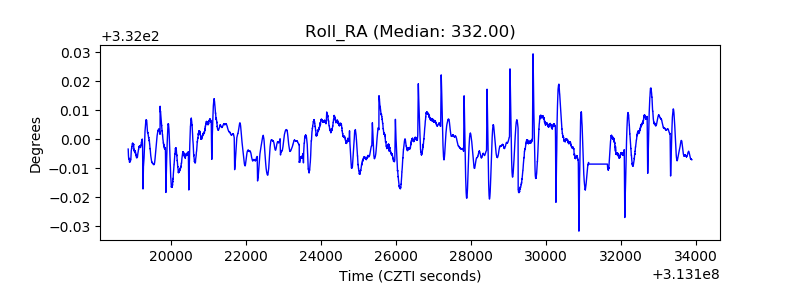 |
| Veto Counter | 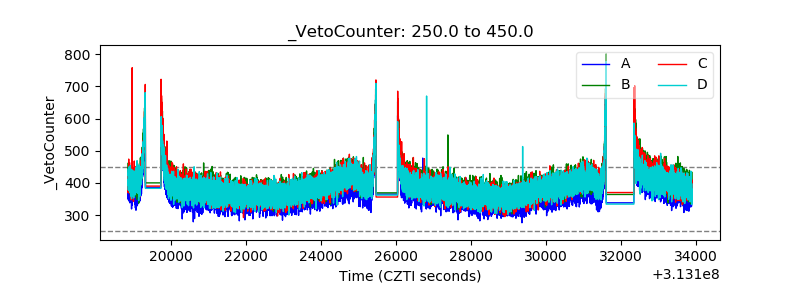 |