| Param | Original file | Final file |
|---|---|---|
| Filename | modeM0/AS1A07_049T01_9000003358_22618cztM0_level2.evt | modeM0/AS1A07_049T01_9000003358_22618cztM0_level2_quad_clean.evt |
| Size (bytes) | 475,611,840 | 85,478,400 |
| Size | 453.6 MB | 81.5 MB |
| Events in quadrant A | 3,361,431 | 533,248 |
| Events in quadrant B | 3,453,943 | 539,435 |
| Events in quadrant C | 3,408,772 | 515,991 |
| Events in quadrant D | 3,699,532 | 507,654 |
| Mode SS | |||
|---|---|---|---|
| Quadrant | BADHDUFLAG | Total packets | Discarded packets |
| A | 0 | 146 | 0 |
| B | 0 | 146 | 0 |
| C | 0 | 146 | 0 |
| D | 0 | 146 | 0 |
| Mode M0 | |||
|---|---|---|---|
| Quadrant | BADHDUFLAG | Total packets | Discarded packets |
| A | 0 | 14466 | 2 |
| B | 0 | 14703 | 2 |
| C | 0 | 14588 | 2 |
| D | 0 | 15545 | 2 |
| Mode M9 | |||
|---|---|---|---|
| Quadrant | BADHDUFLAG | Total packets | Discarded packets |
| A | 0 | 16 | 0 |
| B | 0 | 16 | 0 |
| C | 0 | 16 | 0 |
| D | 0 | 16 | 0 |
| Quadrant | Total seconds | Saturated seconds | Saturation percentage |
|---|---|---|---|
| A | 7062 | 79 | 1.118663% |
| B | 7063 | 113 | 1.599887% |
| C | 7063 | 124 | 1.755628% |
| D | 7063 | 115 | 1.628203% |
Noise dominated data is calculated using 1-second bins in cleaned event files. If a bin has >2000 counts, and if more than 50% of those come from <1% of pixels, then it is considered to be noise-dominated and hence unusable.
| Quadrant | # 1 sec bins | Bins with >0 counts | Bins with >2000 counts | High rate bins dominated by noise | Noise dominated (total time) | Noise dominated (detector-on time) | Marked lightcurve |
|---|---|---|---|---|---|---|---|
| A | 8687 | 7064 | 0 | 0 | 0.00% | 0.00% | 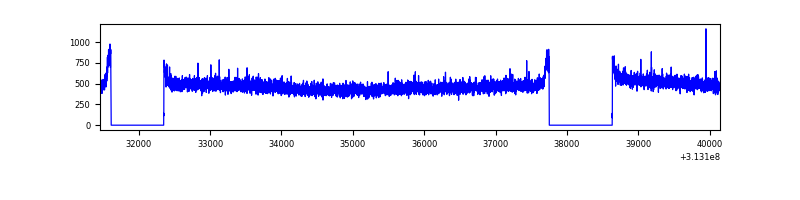 |
| B | 8688 | 7065 | 5 | 5 | 0.06% | 0.07% | 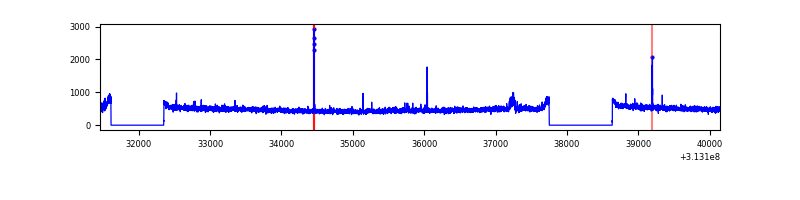 |
| C | 8688 | 7065 | 1 | 1 | 0.01% | 0.01% | 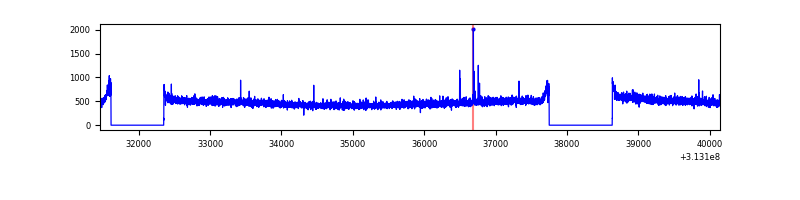 |
| D | 8688 | 7065 | 38 | 38 | 0.44% | 0.54% | 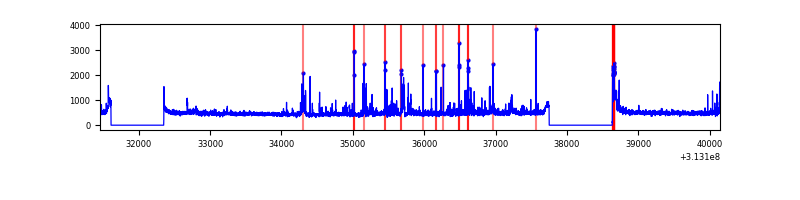 |
Top three noisy pixels from each quadrant. If the there are fewer than three noisy pixels in the level2.evt file, extra rows are filled as -1
| Pixel properties | Quadrant properties | ||||||
|---|---|---|---|---|---|---|---|
| Quadrant | DetID | PixID | Counts | Sigma | Mean | Median | Sigma |
| A | 13 | 254 | 11433 | 59.88 | 871 | 851 | 176.7 |
| A | 3 | 137 | 7696 | 38.73 | 871 | 851 | 176.7 |
| A | 0 | 226 | 7479 | 37.5 | 871 | 851 | 176.7 |
| B | 0 | 197 | 25860 | 148.44 | 866 | 842 | 168.5 |
| B | 12 | 111 | 21002 | 119.61 | 866 | 842 | 168.5 |
| B | 11 | 111 | 18451 | 104.48 | 866 | 842 | 168.5 |
| C | 14 | 238 | 129528 | 660.77 | 832 | 837 | 194.8 |
| C | 10 | 22 | 13003 | 62.47 | 832 | 837 | 194.8 |
| C | 10 | 222 | 12204 | 58.36 | 832 | 837 | 194.8 |
| D | 1 | 52 | 246169 | 1191.75 | 842 | 816 | 205.9 |
| D | 2 | 136 | 116268 | 560.78 | 842 | 816 | 205.9 |
| D | 1 | 239 | 75138 | 361.0 | 842 | 816 | 205.9 |
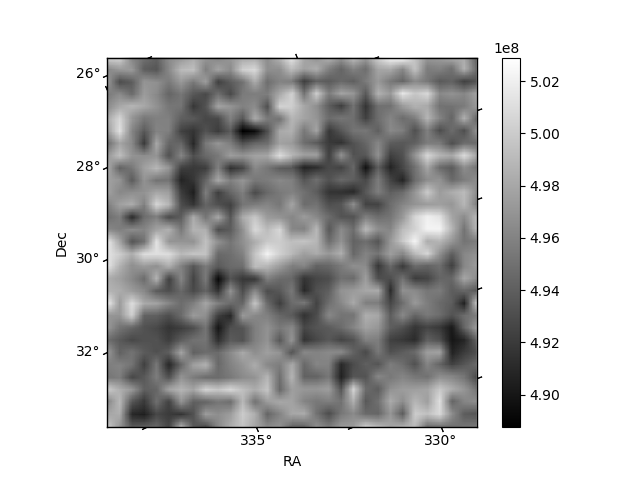
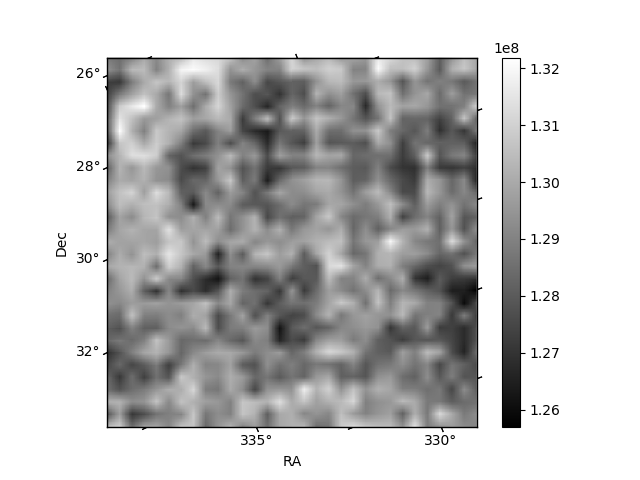
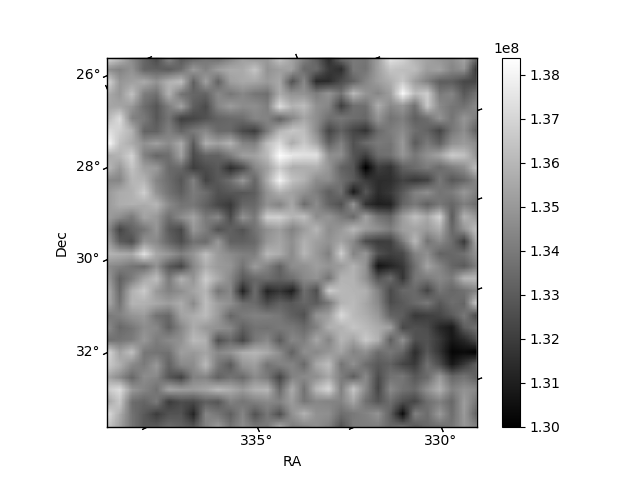
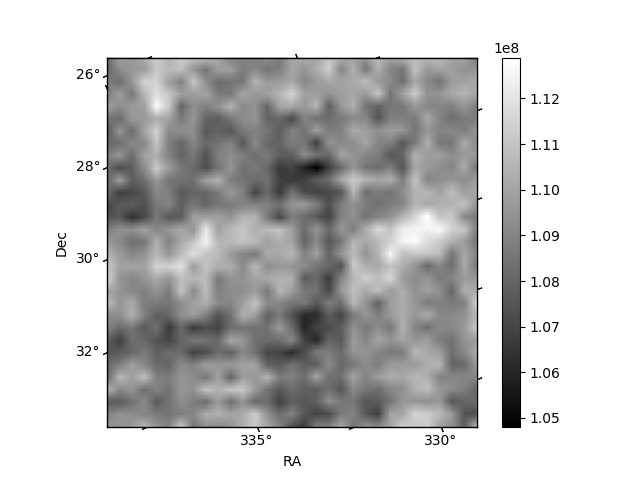
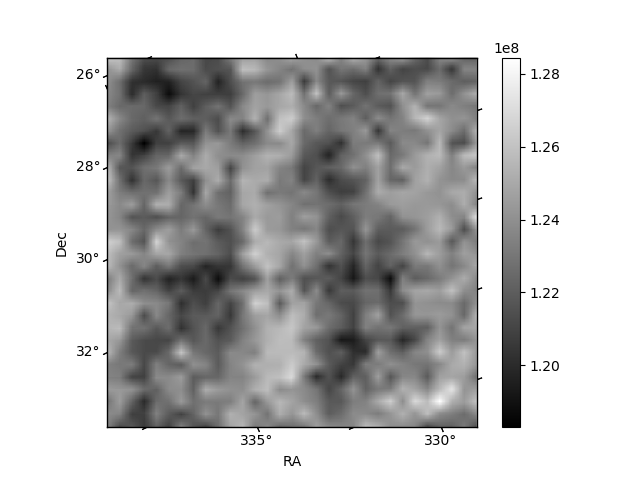
Histogram calculated using DETX and DETY for each event in the final _common_clean file
| Quadrant A | 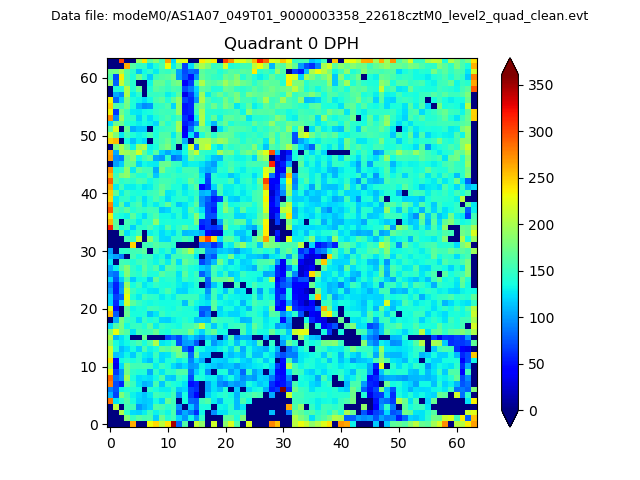 |
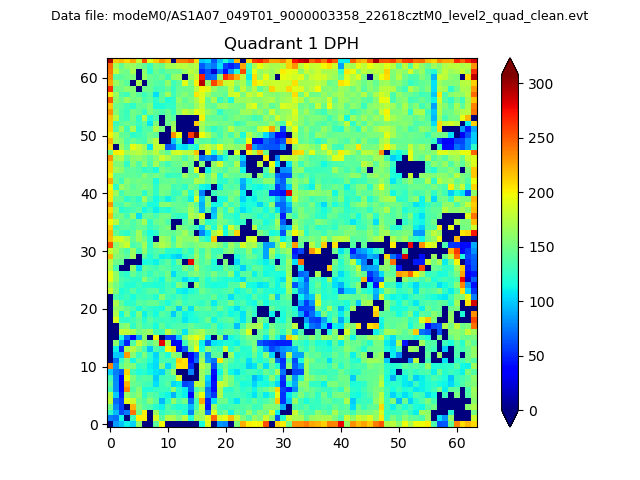 |
Quadrant B |
|---|---|---|---|
| Quadrant D | 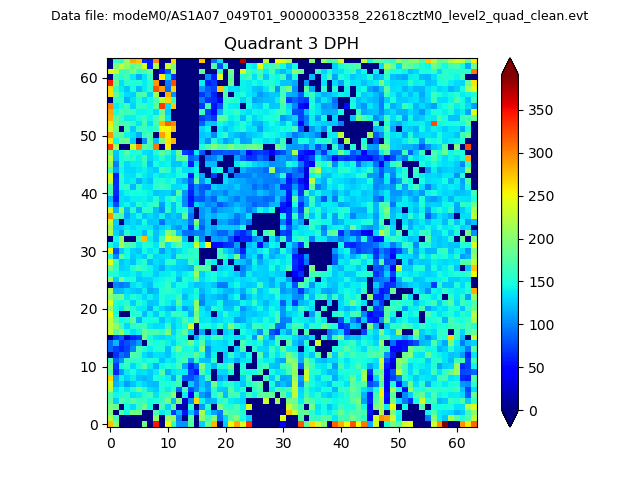 |
 |
Quadrant C |
| Plot type | Count rate plots | Images |
|---|---|---|
| Comparison with Poisson distribution Blue bars denote a histogram of data divided into 1 sec bins. Red curve is a Poisson curve with rate = median count rate of data. |
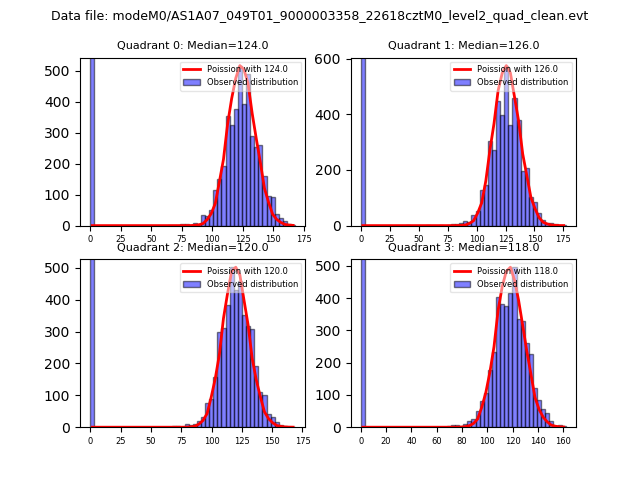 |
 |
| Quadrant-wise count rates Data is divided into 100 sec bins |
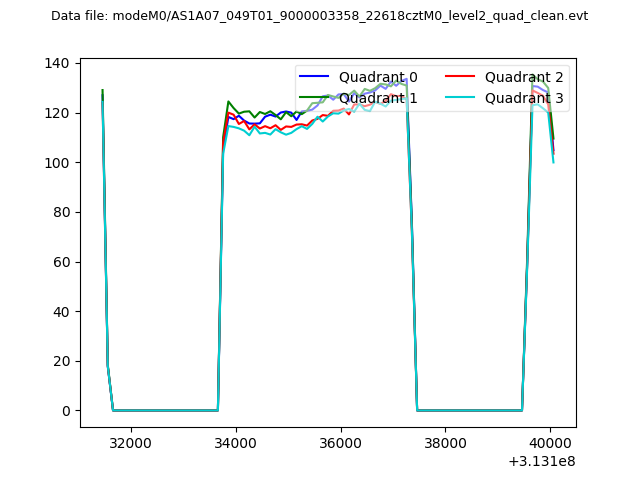 |
|
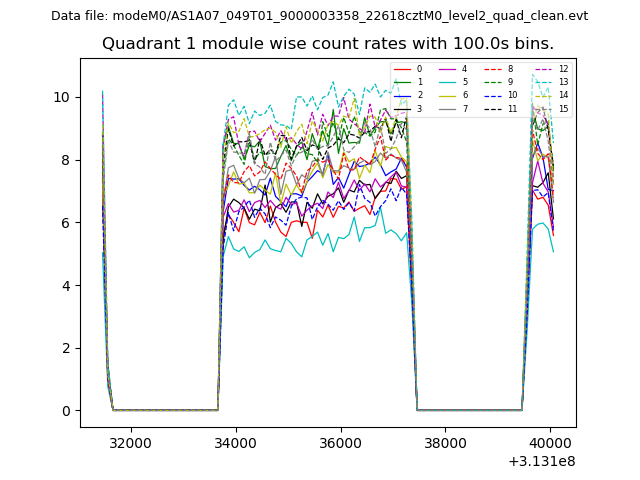
| Module-wise count rates for Quadrant A Data is divided into 100 sec bins |
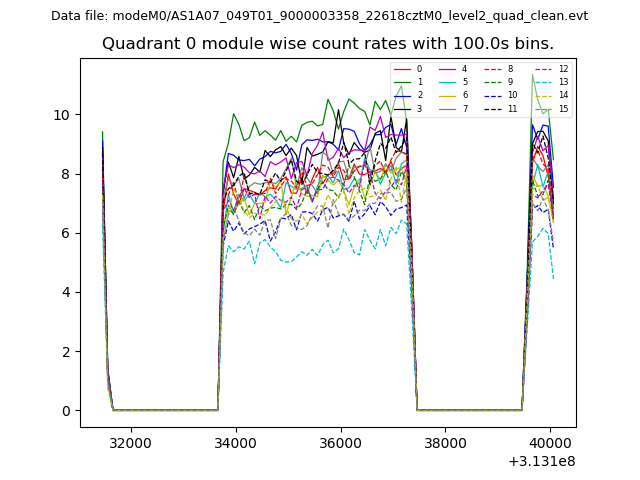 |
 |
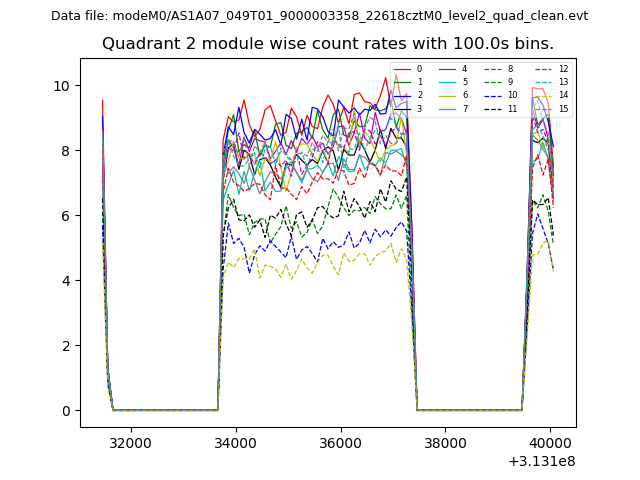
| Module-wise count rates for Quadrant B Data is divided into 100 sec bins |
 |
 |
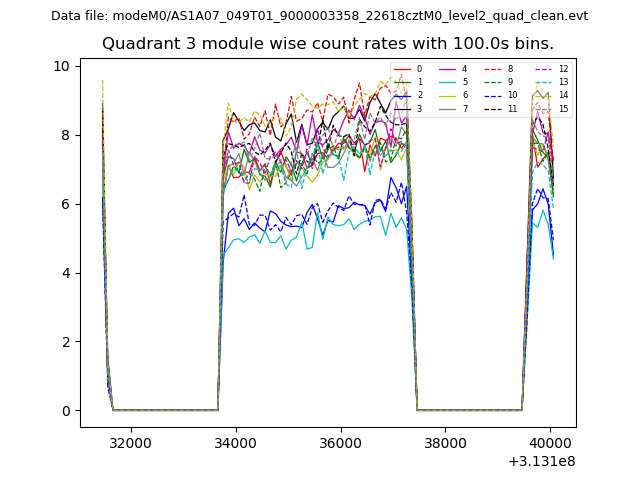
| Module-wise count rates for Quadrant C Data is divided into 100 sec bins |
 |
 |
| Module-wise count rates for Quadrant D Data is divided into 100 sec bins |
 |
 |
| Parameter | Plot |
|---|---|
| CZT HV Monitor | 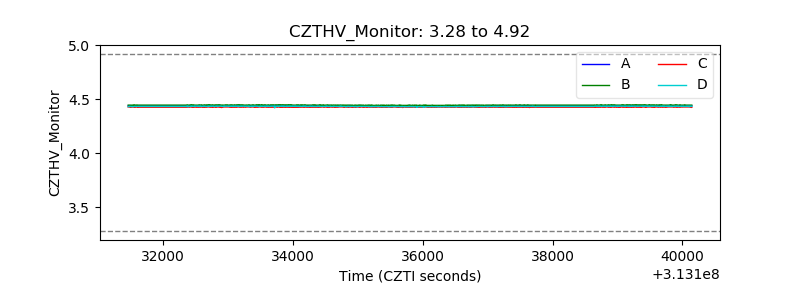 |
| D_VDD | 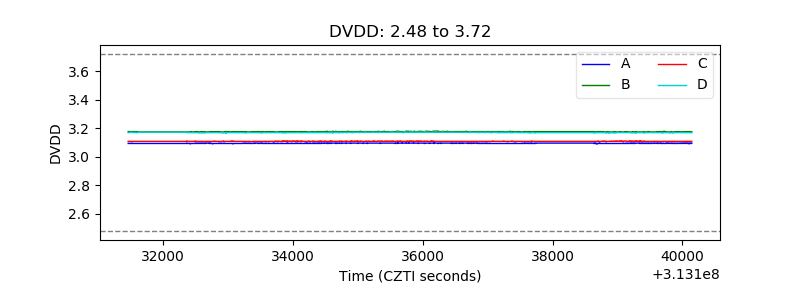 |
| Temperature 1 | 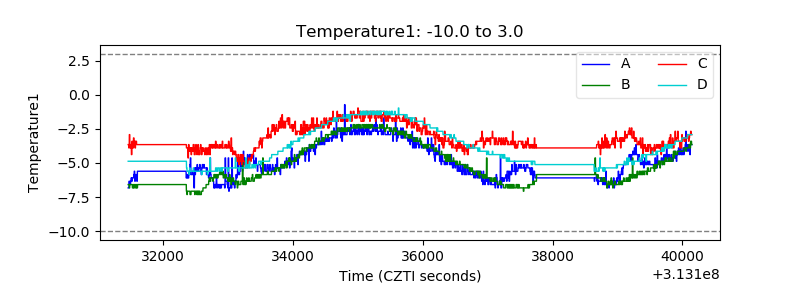 |
| Veto HV Monitor | 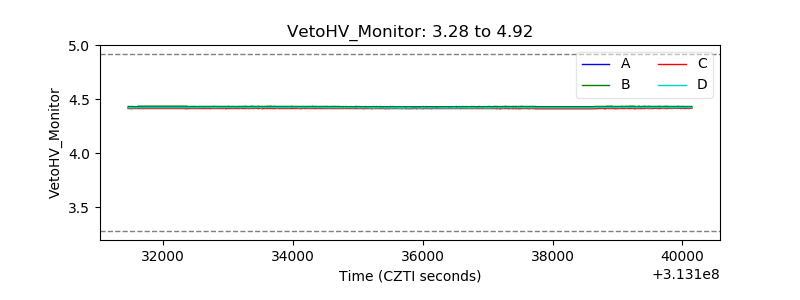 |
| Veto LLD | 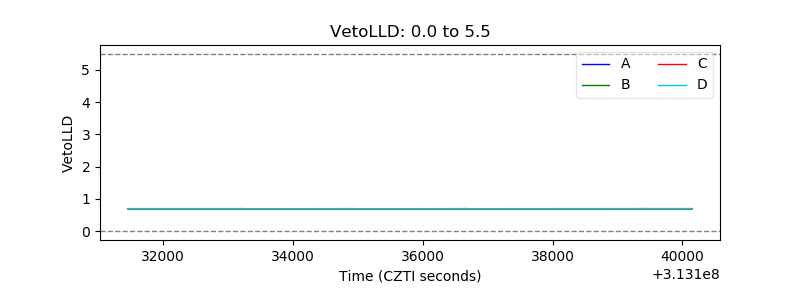 |
| Alpha Counter | 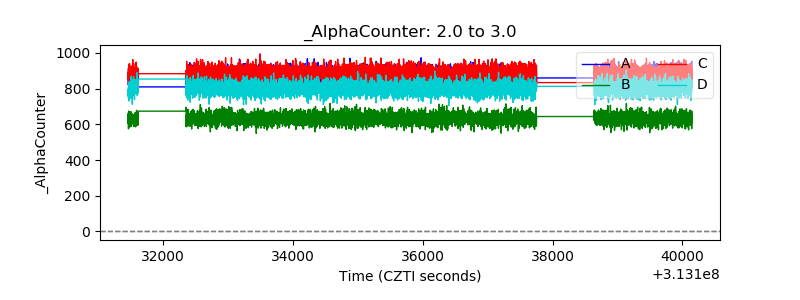 |
| _CPM_Rate | 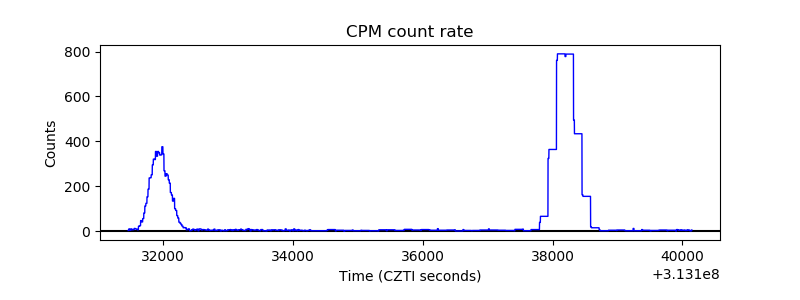 |
| CZT Counter |  |
| +2.5 Volts monitor |  |
| +5 Volts monitor | 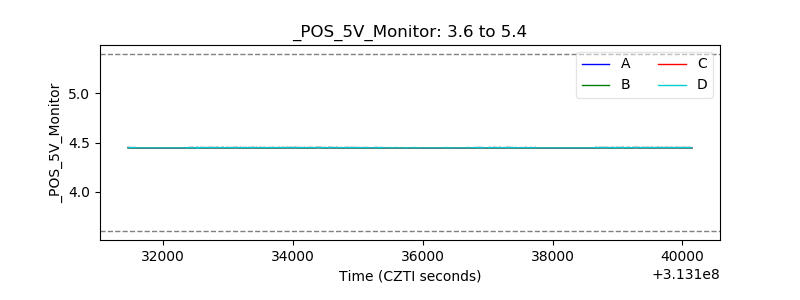 |
| _ROLL_ROT | 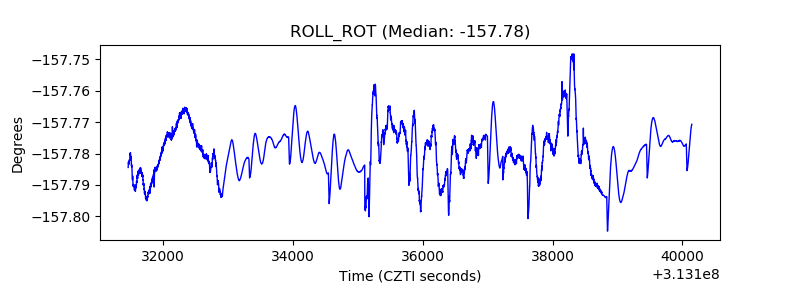 |
| _Roll_DEC | 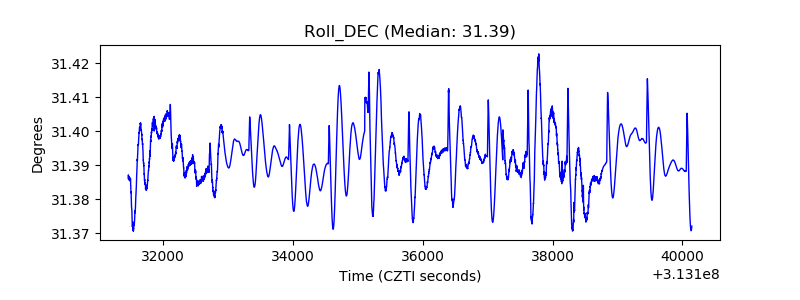 |
| _Roll_RA |  |
| Veto Counter | 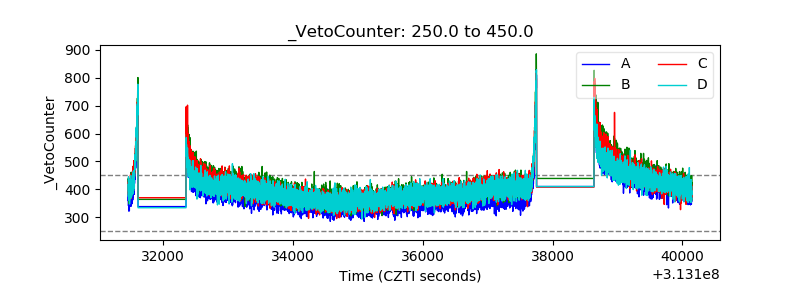 |