| Param | Original file | Final file |
|---|---|---|
| Filename | modeM0/AS1A07_049T01_9000003358_22619cztM0_level2.evt | modeM0/AS1A07_049T01_9000003358_22619cztM0_level2_quad_clean.evt |
| Size (bytes) | 407,810,880 | 89,979,840 |
| Size | 388.9 MB | 85.8 MB |
| Events in quadrant A | 2,930,972 | 588,248 |
| Events in quadrant B | 2,983,279 | 595,197 |
| Events in quadrant C | 2,987,110 | 561,251 |
| Events in quadrant D | 3,035,899 | 555,972 |
| Mode SS | |||
|---|---|---|---|
| Quadrant | BADHDUFLAG | Total packets | Discarded packets |
| A | 0 | 122 | 0 |
| B | 0 | 122 | 0 |
| C | 0 | 122 | 0 |
| D | 0 | 122 | 0 |
| Mode M0 | |||
|---|---|---|---|
| Quadrant | BADHDUFLAG | Total packets | Discarded packets |
| A | 0 | 12663 | 1 |
| B | 0 | 12800 | 1 |
| C | 0 | 12839 | 1 |
| D | 0 | 13006 | 1 |
| Mode M9 | |||
|---|---|---|---|
| Quadrant | BADHDUFLAG | Total packets | Discarded packets |
| A | 0 | 11 | 0 |
| B | 0 | 11 | 0 |
| C | 0 | 11 | 0 |
| D | 0 | 11 | 0 |
| Quadrant | Total seconds | Saturated seconds | Saturation percentage |
|---|---|---|---|
| A | 6080 | 41 | 0.674342% |
| B | 6081 | 50 | 0.822233% |
| C | 6080 | 59 | 0.970395% |
| D | 6080 | 50 | 0.822368% |
Noise dominated data is calculated using 1-second bins in cleaned event files. If a bin has >2000 counts, and if more than 50% of those come from <1% of pixels, then it is considered to be noise-dominated and hence unusable.
| Quadrant | # 1 sec bins | Bins with >0 counts | Bins with >2000 counts | High rate bins dominated by noise | Noise dominated (total time) | Noise dominated (detector-on time) | Marked lightcurve |
|---|---|---|---|---|---|---|---|
| A | 7125 | 6081 | 0 | 0 | 0.00% | 0.00% | 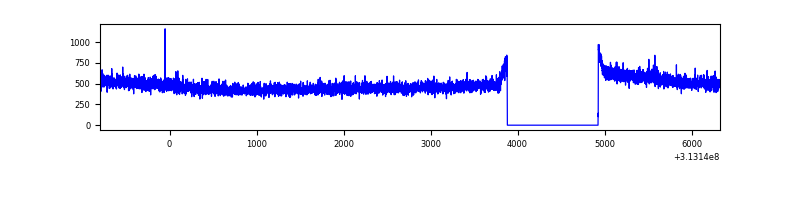 |
| B | 7126 | 6082 | 0 | 0 | 0.00% | 0.00% | 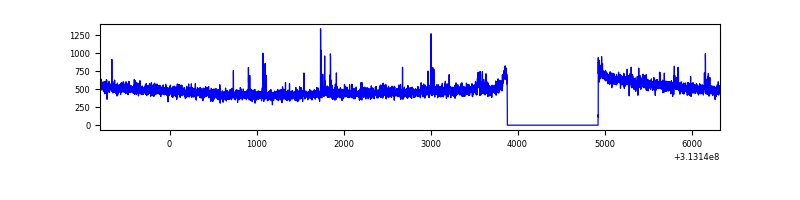 |
| C | 7125 | 6081 | 0 | 0 | 0.00% | 0.00% | 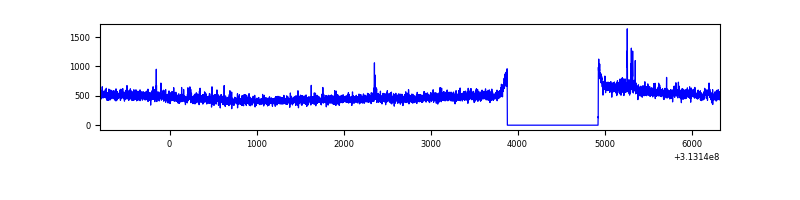 |
| D | 7125 | 6081 | 31 | 31 | 0.44% | 0.51% | 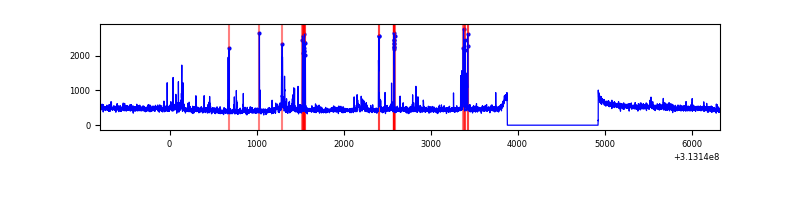 |
Top three noisy pixels from each quadrant. If the there are fewer than three noisy pixels in the level2.evt file, extra rows are filled as -1
| Pixel properties | Quadrant properties | ||||||
|---|---|---|---|---|---|---|---|
| Quadrant | DetID | PixID | Counts | Sigma | Mean | Median | Sigma |
| A | 13 | 254 | 8333 | 49.76 | 760 | 744 | 152.5 |
| A | 0 | 226 | 6531 | 37.95 | 760 | 744 | 152.5 |
| A | 3 | 137 | 6469 | 37.54 | 760 | 744 | 152.5 |
| B | 0 | 230 | 18555 | 122.75 | 750 | 731 | 145.2 |
| B | 12 | 111 | 17452 | 115.15 | 750 | 731 | 145.2 |
| B | 11 | 111 | 15464 | 101.46 | 750 | 731 | 145.2 |
| C | 14 | 238 | 113695 | 666.59 | 716 | 720 | 169.5 |
| C | 10 | 222 | 50730 | 295.08 | 716 | 720 | 169.5 |
| C | 10 | 22 | 21126 | 120.4 | 716 | 720 | 169.5 |
| D | 13 | 249 | 114820 | 642.58 | 732 | 710 | 177.6 |
| D | 1 | 52 | 96616 | 540.07 | 732 | 710 | 177.6 |
| D | 1 | 239 | 26921 | 147.6 | 732 | 710 | 177.6 |
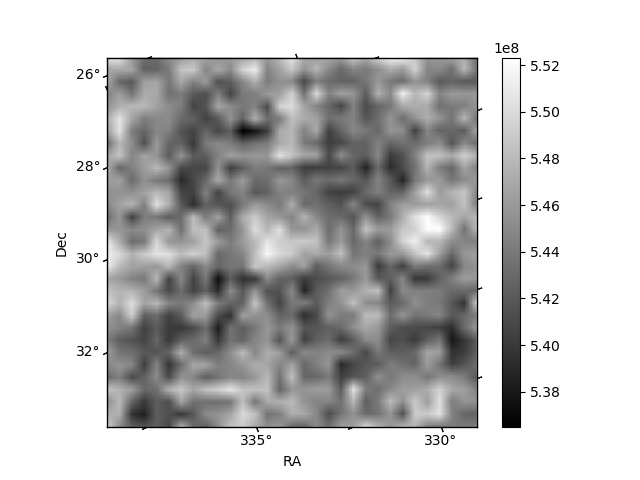
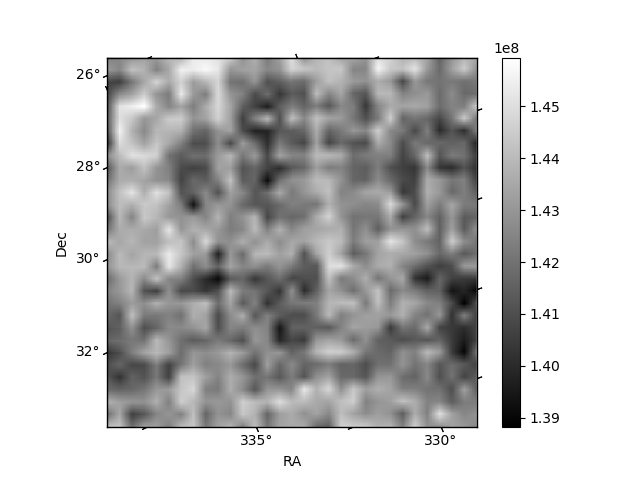
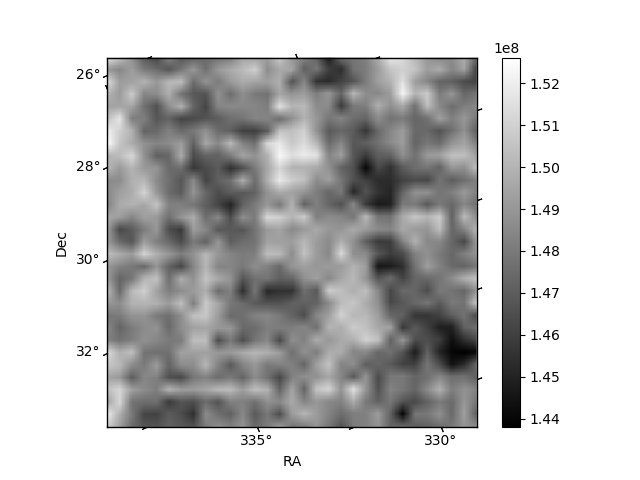
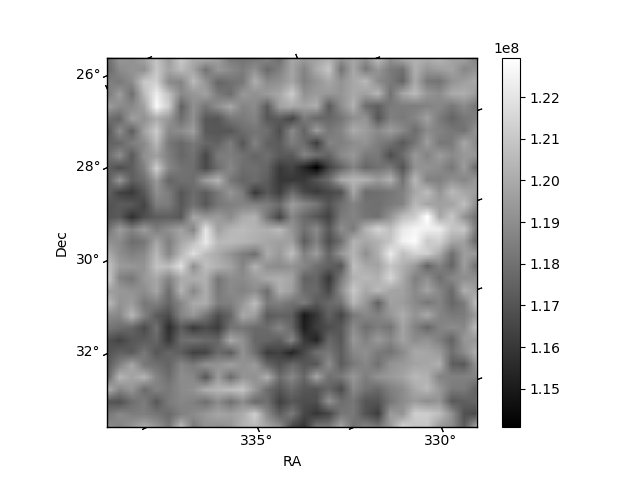
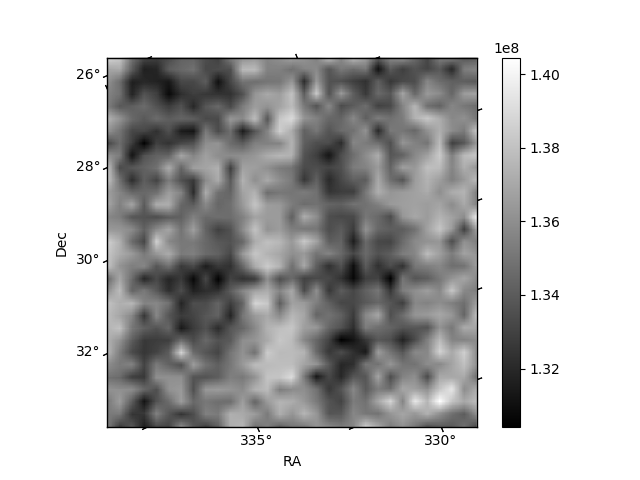
Histogram calculated using DETX and DETY for each event in the final _common_clean file
| Quadrant A | 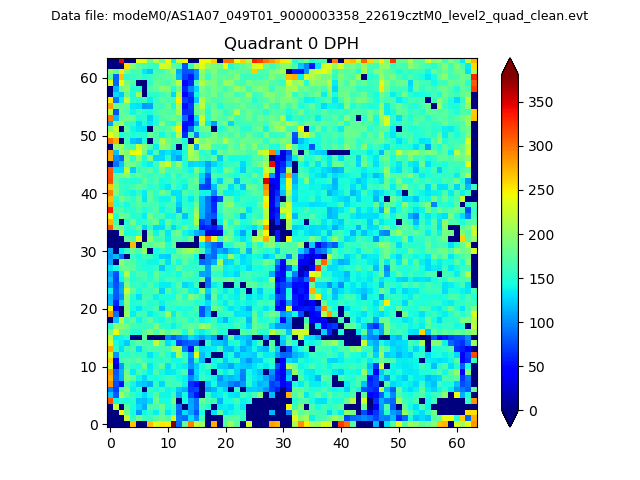 |
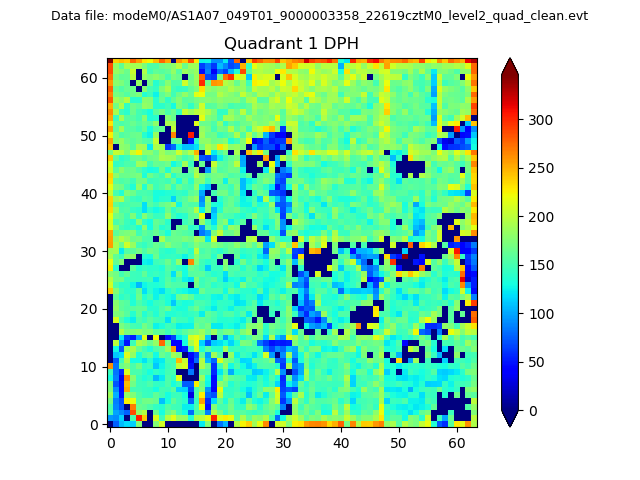 |
Quadrant B |
|---|---|---|---|
| Quadrant D | 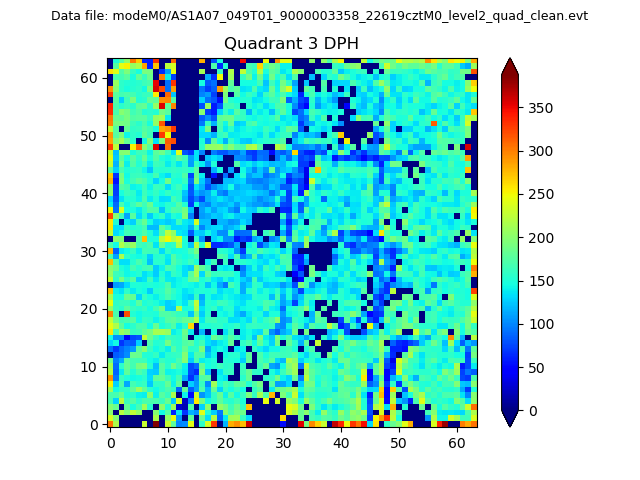 |
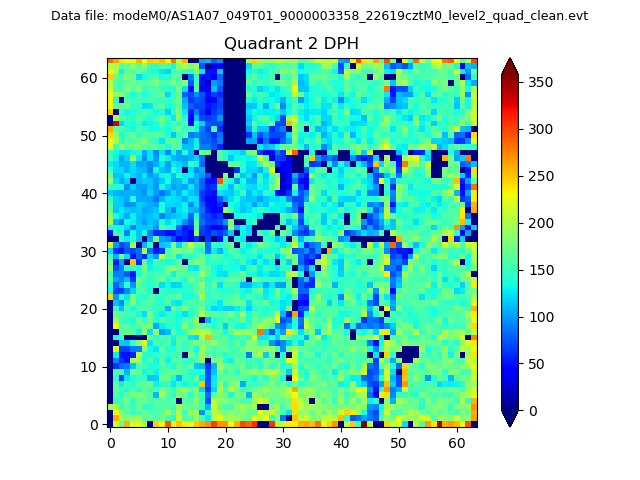 |
Quadrant C |
| Plot type | Count rate plots | Images |
|---|---|---|
| Comparison with Poisson distribution Blue bars denote a histogram of data divided into 1 sec bins. Red curve is a Poisson curve with rate = median count rate of data. |
 |
 |
| Quadrant-wise count rates Data is divided into 100 sec bins |
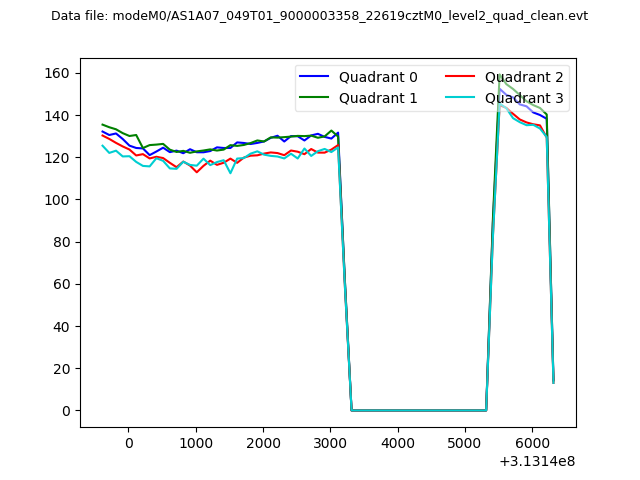 |
|
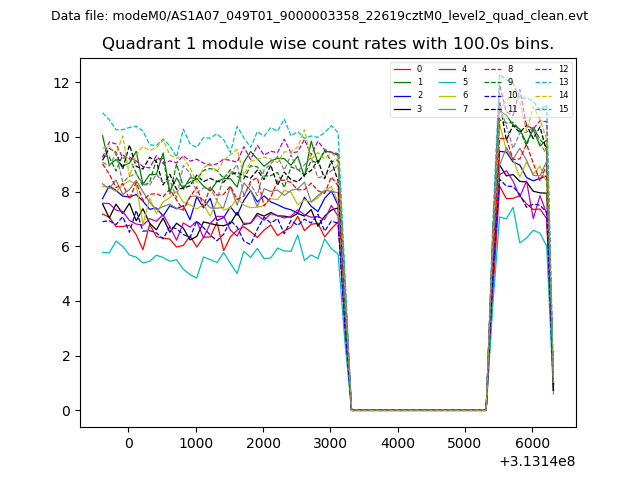
| Module-wise count rates for Quadrant A Data is divided into 100 sec bins |
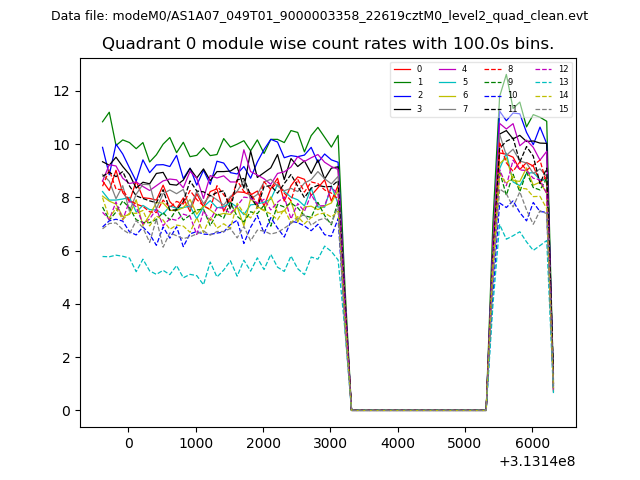 |
 |
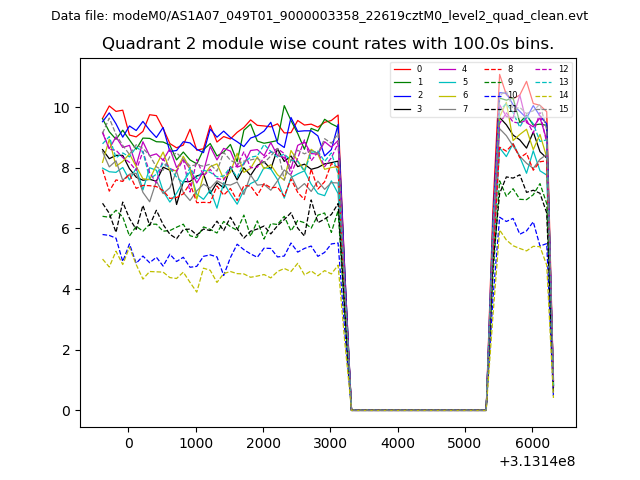
| Module-wise count rates for Quadrant B Data is divided into 100 sec bins |
 |
 |
| Module-wise count rates for Quadrant C Data is divided into 100 sec bins |
 |
 |
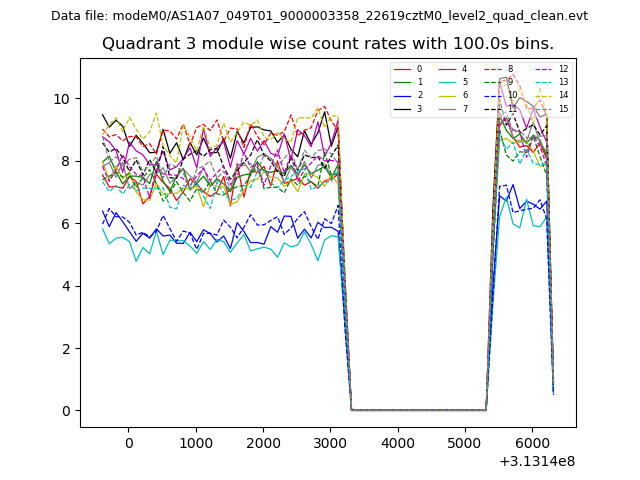
| Module-wise count rates for Quadrant D Data is divided into 100 sec bins |
 |
 |
| Parameter | Plot |
|---|---|
| CZT HV Monitor | 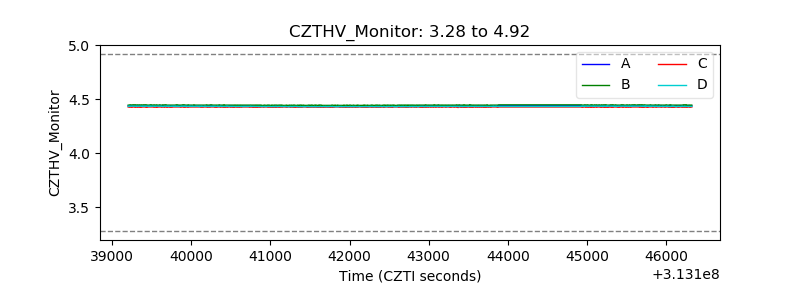 |
| D_VDD | 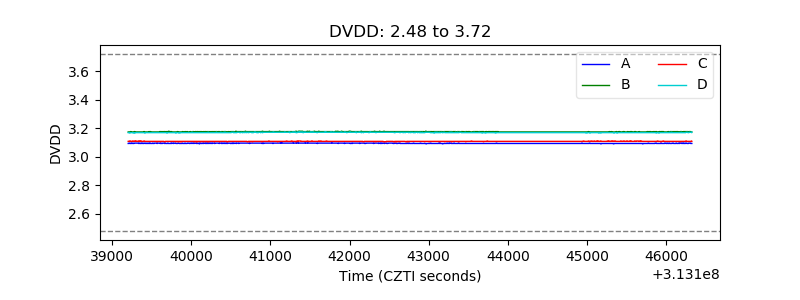 |
| Temperature 1 | 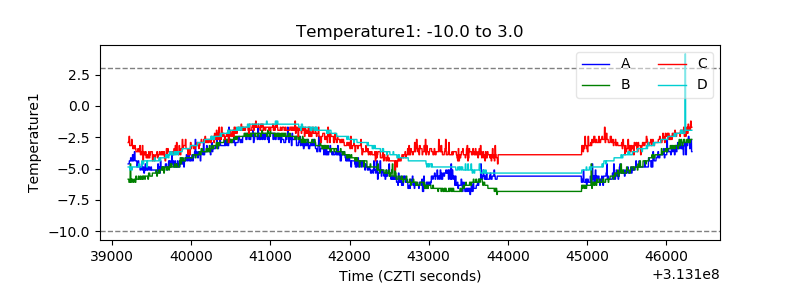 |
| Veto HV Monitor | 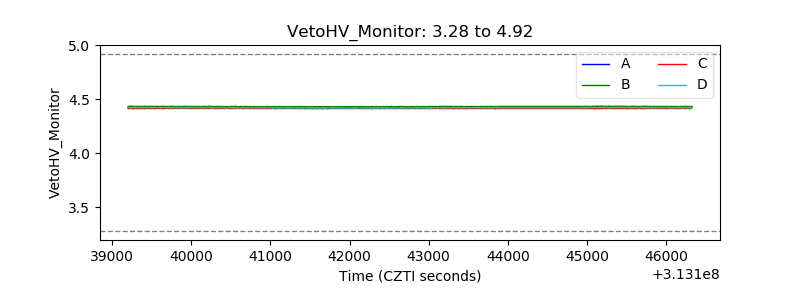 |
| Veto LLD | 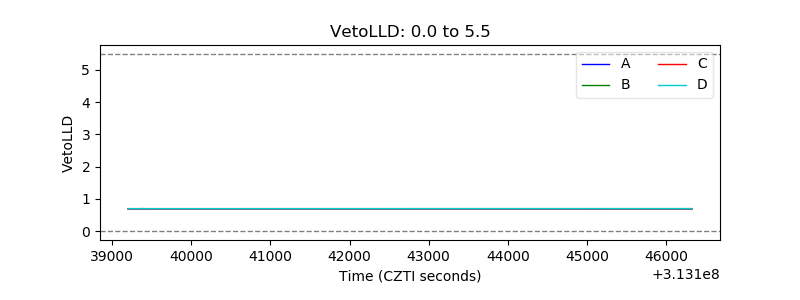 |
| Alpha Counter | 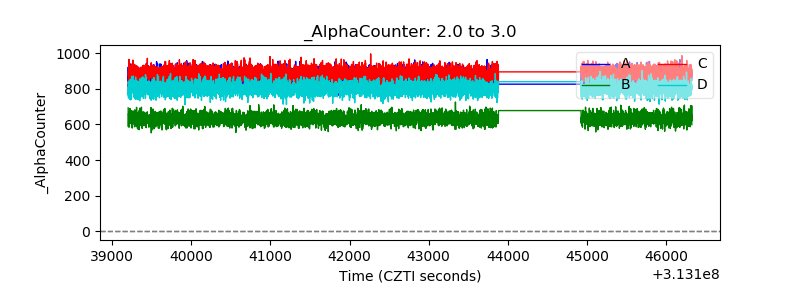 |
| _CPM_Rate | 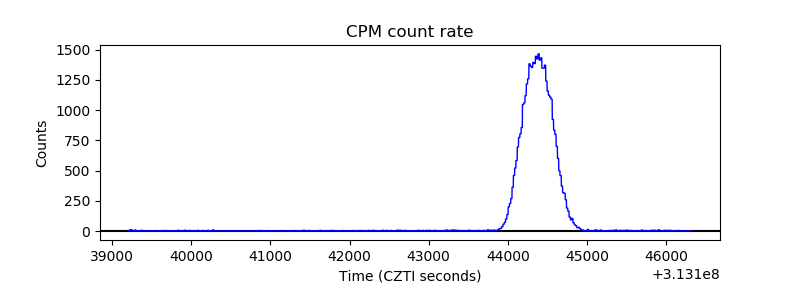 |
| CZT Counter | 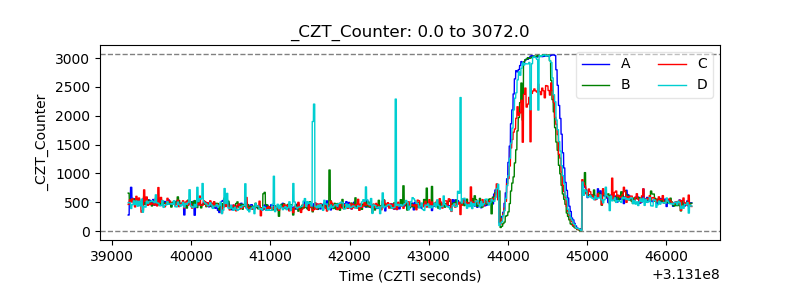 |
| +2.5 Volts monitor |  |
| +5 Volts monitor | 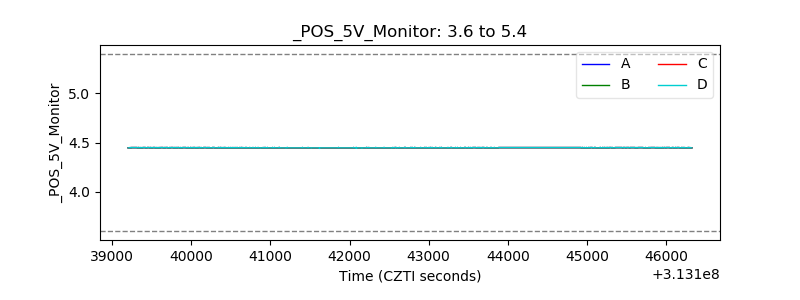 |
| _ROLL_ROT | 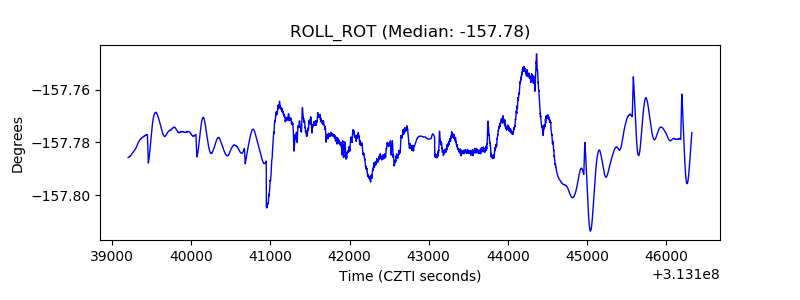 |
| _Roll_DEC | 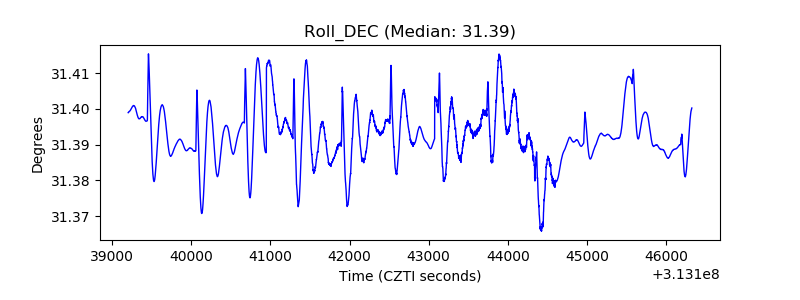 |
| _Roll_RA | 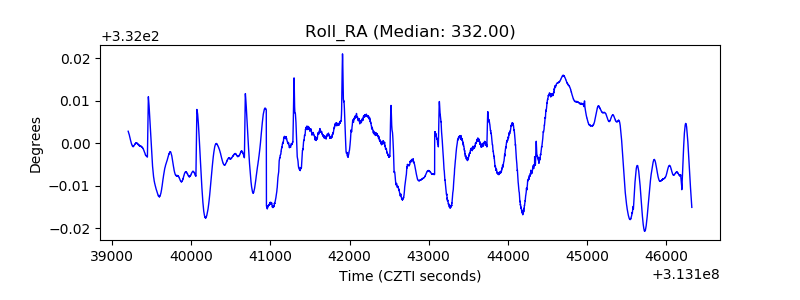 |
| Veto Counter | 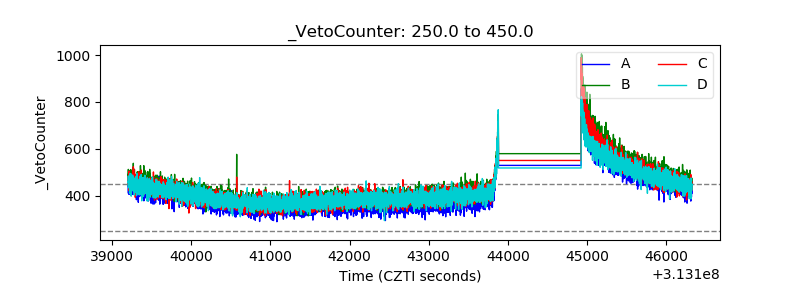 |