| Param | Original file | Final file |
|---|---|---|
| Filename | modeM0/AS1A07_049T01_9000003358_22621cztM0_level2.evt | modeM0/AS1A07_049T01_9000003358_22621cztM0_level2_quad_clean.evt |
| Size (bytes) | 170,801,280 | 52,971,840 |
| Size | 162.9 MB | 50.5 MB |
| Events in quadrant A | 1,246,567 | 362,780 |
| Events in quadrant B | 1,273,414 | 366,026 |
| Events in quadrant C | 1,260,548 | 342,430 |
| Events in quadrant D | 1,208,537 | 341,808 |
| Mode SS | |||
|---|---|---|---|
| Quadrant | BADHDUFLAG | Total packets | Discarded packets |
| A | 0 | 54 | 0 |
| B | 0 | 54 | 0 |
| C | 0 | 54 | 0 |
| D | 0 | 54 | 0 |
| Mode M0 | |||
|---|---|---|---|
| Quadrant | BADHDUFLAG | Total packets | Discarded packets |
| A | 0 | 5409 | 0 |
| B | 0 | 5492 | 0 |
| C | 0 | 5443 | 0 |
| D | 0 | 5417 | 0 |
| Quadrant | Total seconds | Saturated seconds | Saturation percentage |
|---|---|---|---|
| A | 2662 | 3 | 0.112697% |
| B | 2663 | 2 | 0.075103% |
| C | 2663 | 7 | 0.262861% |
| D | 2663 | 1 | 0.037552% |
Noise dominated data is calculated using 1-second bins in cleaned event files. If a bin has >2000 counts, and if more than 50% of those come from <1% of pixels, then it is considered to be noise-dominated and hence unusable.
| Quadrant | # 1 sec bins | Bins with >0 counts | Bins with >2000 counts | High rate bins dominated by noise | Noise dominated (total time) | Noise dominated (detector-on time) | Marked lightcurve |
|---|---|---|---|---|---|---|---|
| A | 2662 | 2662 | 0 | 0 | 0.00% | 0.00% | 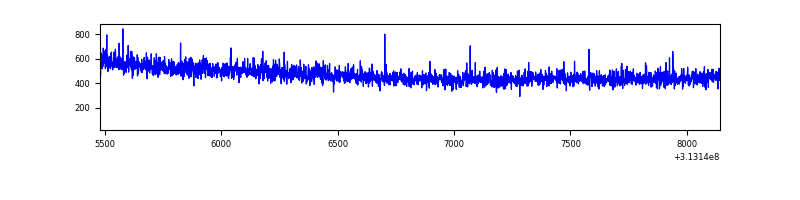 |
| B | 2663 | 2663 | 0 | 0 | 0.00% | 0.00% | 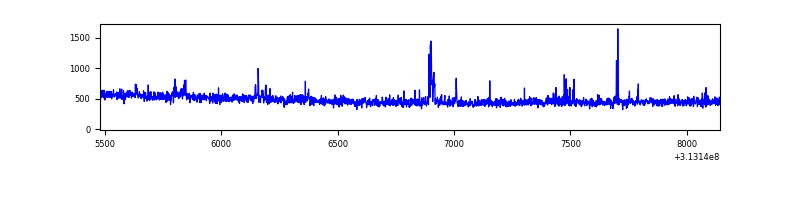 |
| C | 2663 | 2663 | 0 | 0 | 0.00% | 0.00% | 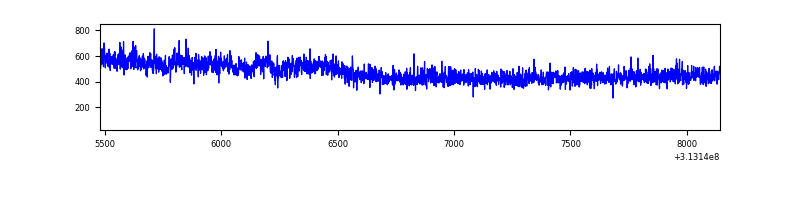 |
| D | 2663 | 2663 | 0 | 0 | 0.00% | 0.00% | 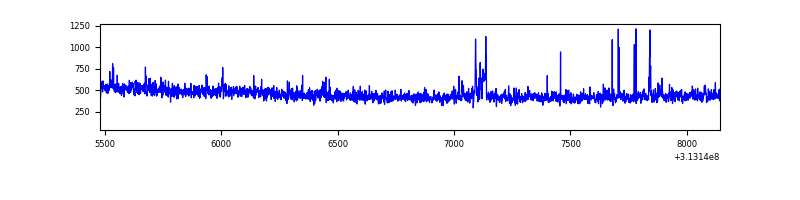 |
Top three noisy pixels from each quadrant. If the there are fewer than three noisy pixels in the level2.evt file, extra rows are filled as -1
| Pixel properties | Quadrant properties | ||||||
|---|---|---|---|---|---|---|---|
| Quadrant | DetID | PixID | Counts | Sigma | Mean | Median | Sigma |
| A | 13 | 254 | 3680 | 50.85 | 323 | 317 | 66.1 |
| A | 0 | 226 | 2815 | 37.77 | 323 | 317 | 66.1 |
| A | 3 | 137 | 2618 | 34.79 | 323 | 317 | 66.1 |
| B | 0 | 190 | 19590 | 315.22 | 316 | 310 | 61.2 |
| B | 0 | 230 | 6869 | 107.24 | 316 | 310 | 61.2 |
| B | 12 | 111 | 6849 | 106.91 | 316 | 310 | 61.2 |
| C | 14 | 238 | 47333 | 662.96 | 299 | 301 | 70.9 |
| C | 10 | 222 | 43793 | 613.06 | 299 | 301 | 70.9 |
| C | 3 | 233 | 3042 | 38.64 | 299 | 301 | 70.9 |
| D | 13 | 249 | 14985 | 193.56 | 310 | 300 | 75.9 |
| D | 12 | 233 | 14917 | 192.67 | 310 | 300 | 75.9 |
| D | 2 | 234 | 10344 | 132.39 | 310 | 300 | 75.9 |
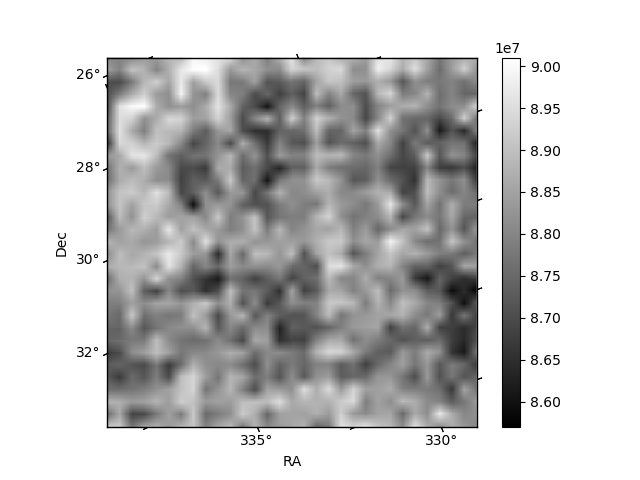
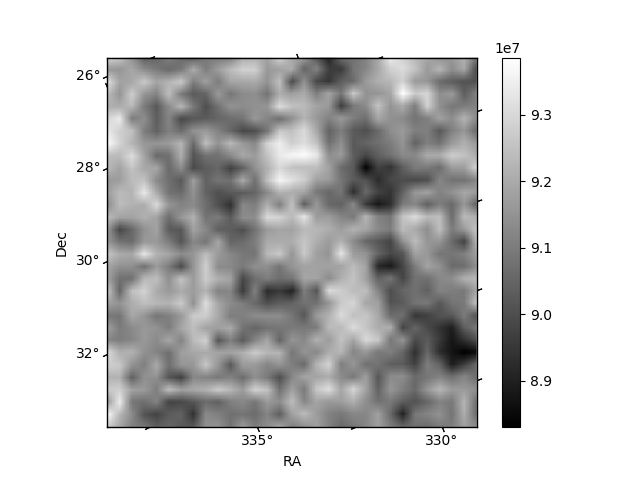
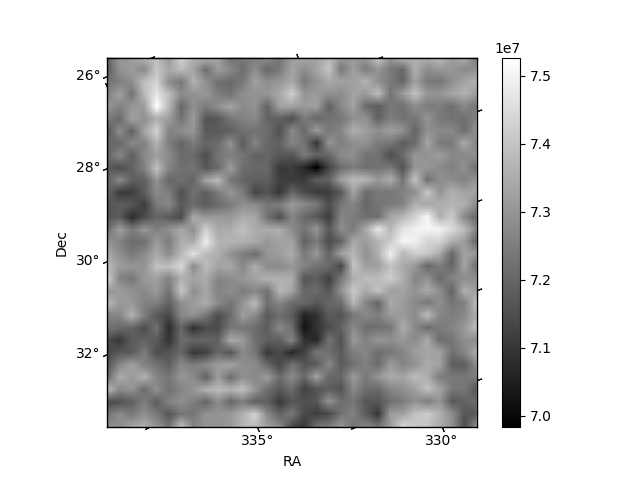
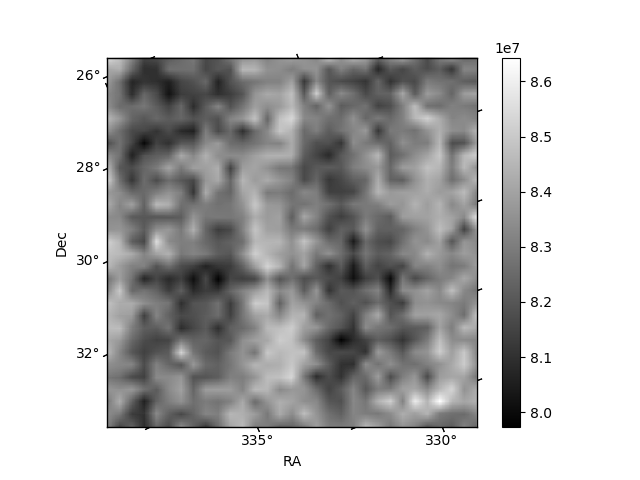
Histogram calculated using DETX and DETY for each event in the final _common_clean file
| Quadrant A | 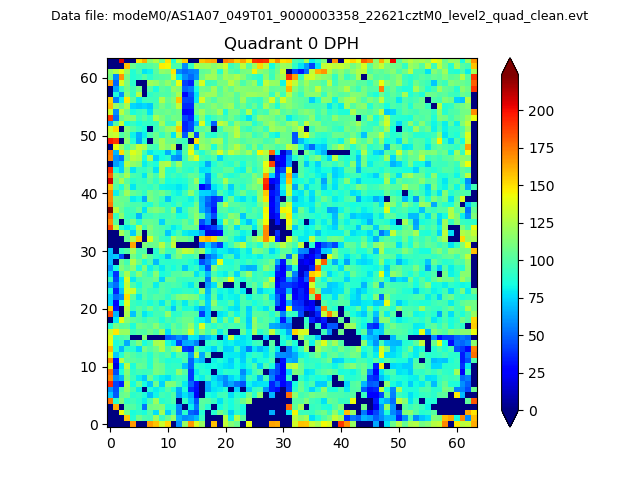 |
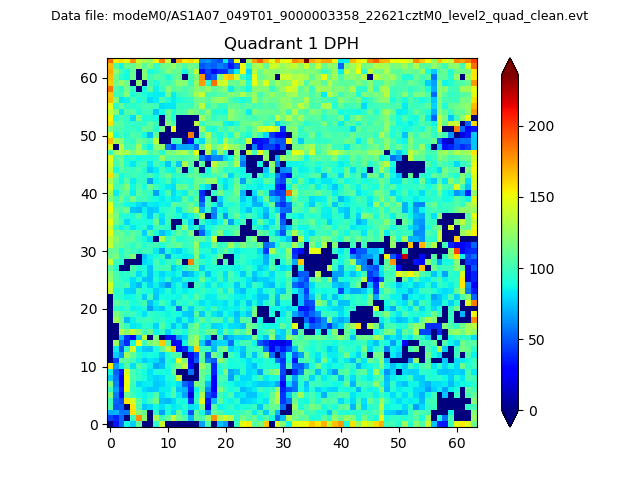 |
Quadrant B |
|---|---|---|---|
| Quadrant D | 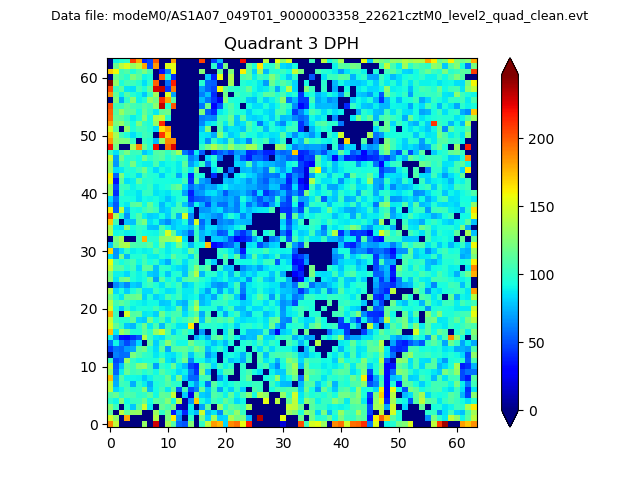 |
 |
Quadrant C |
| Plot type | Count rate plots | Images |
|---|---|---|
| Comparison with Poisson distribution Blue bars denote a histogram of data divided into 1 sec bins. Red curve is a Poisson curve with rate = median count rate of data. |
 |
 |
| Quadrant-wise count rates Data is divided into 100 sec bins |
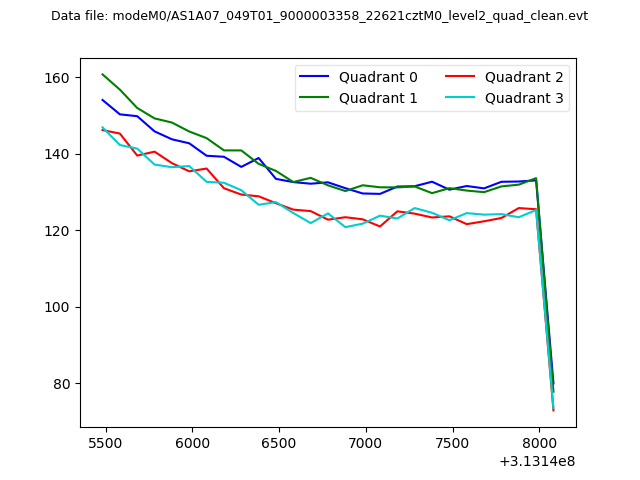 |
|
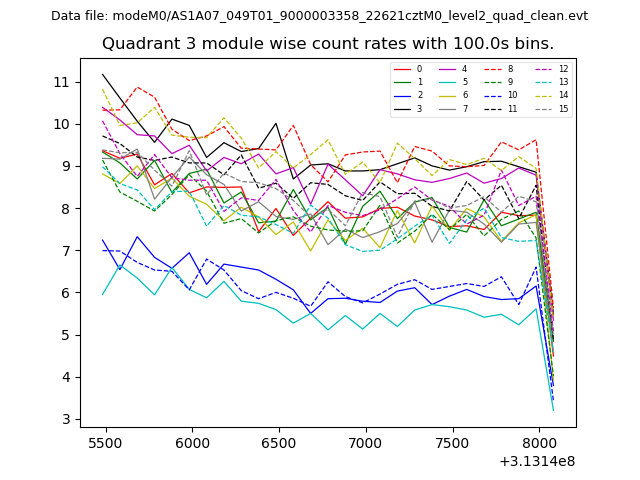
| Module-wise count rates for Quadrant A Data is divided into 100 sec bins |
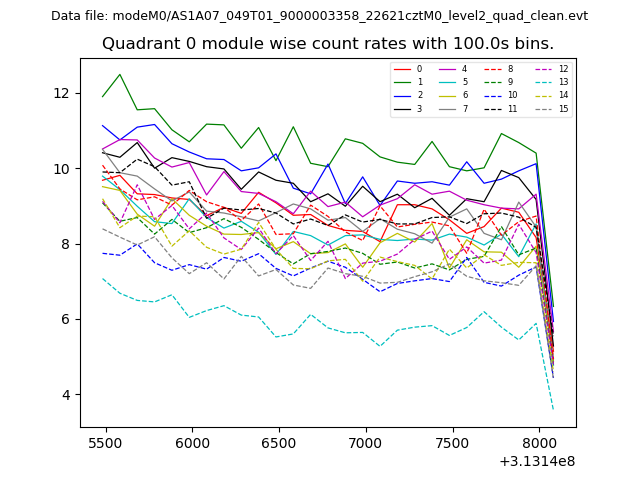 |
 |
| Module-wise count rates for Quadrant B Data is divided into 100 sec bins |
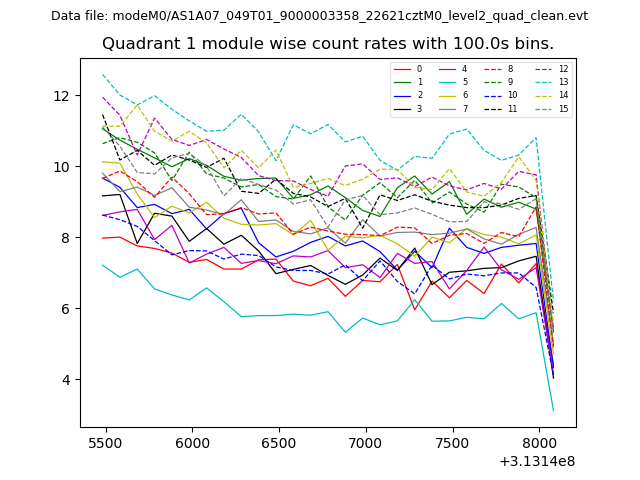 |
 |
| Module-wise count rates for Quadrant C Data is divided into 100 sec bins |
 |
 |
| Module-wise count rates for Quadrant D Data is divided into 100 sec bins |
 |
 |
| Parameter | Plot |
|---|---|
| CZT HV Monitor | 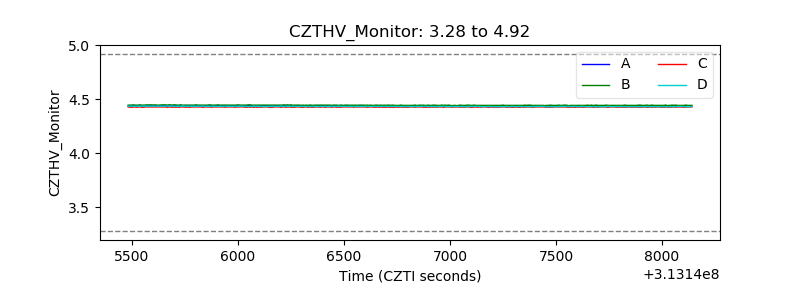 |
| D_VDD | 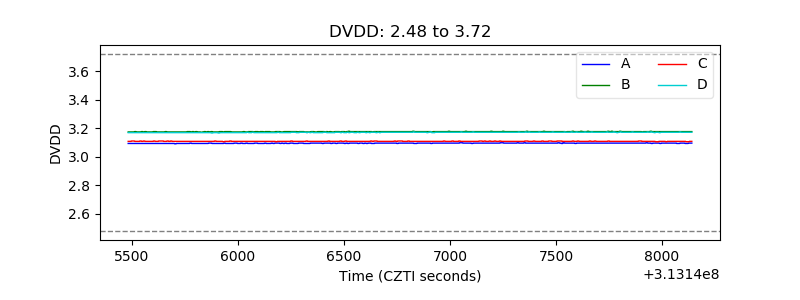 |
| Temperature 1 |  |
| Veto HV Monitor | 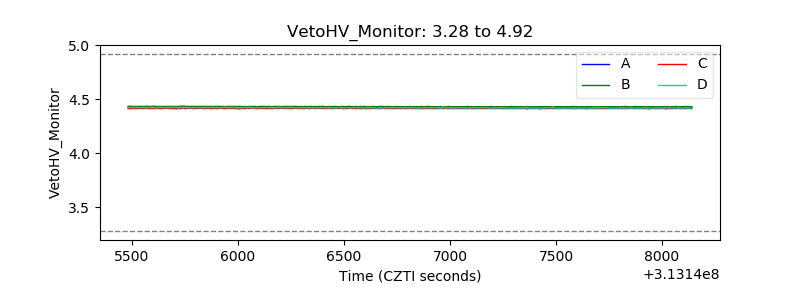 |
| Veto LLD | 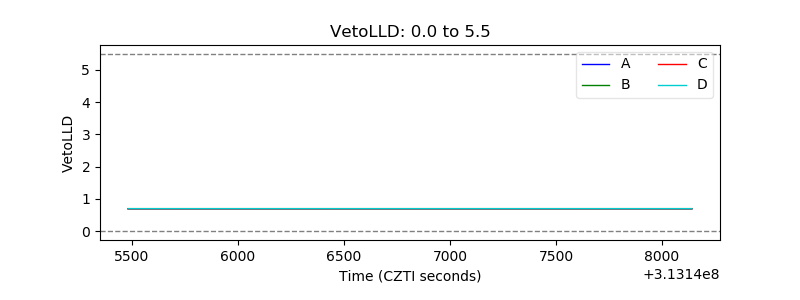 |
| Alpha Counter |  |
| _CPM_Rate | 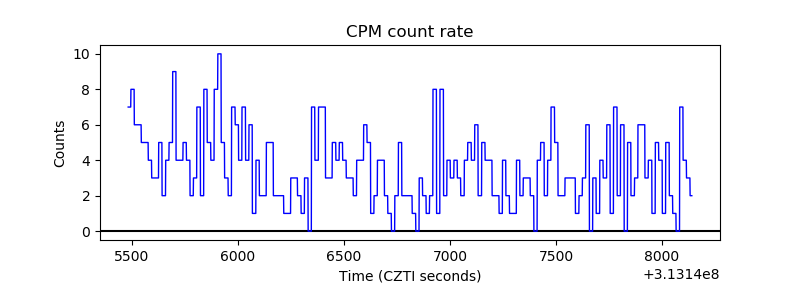 |
| CZT Counter |  |
| +2.5 Volts monitor |  |
| +5 Volts monitor |  |
| _ROLL_ROT | 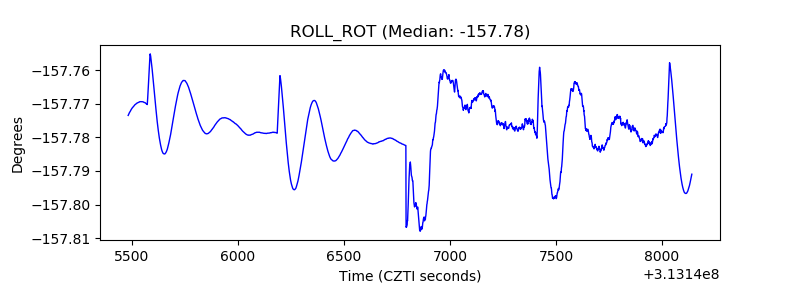 |
| _Roll_DEC | 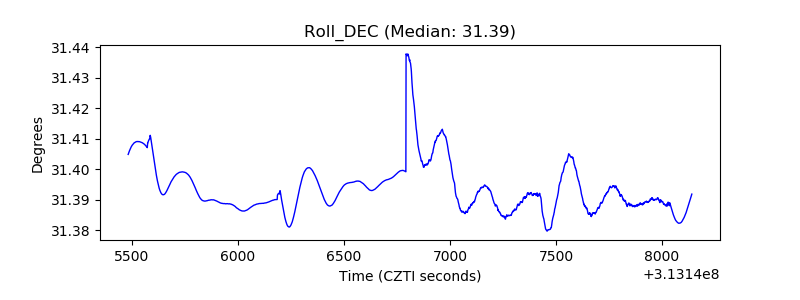 |
| _Roll_RA |  |
| Veto Counter | 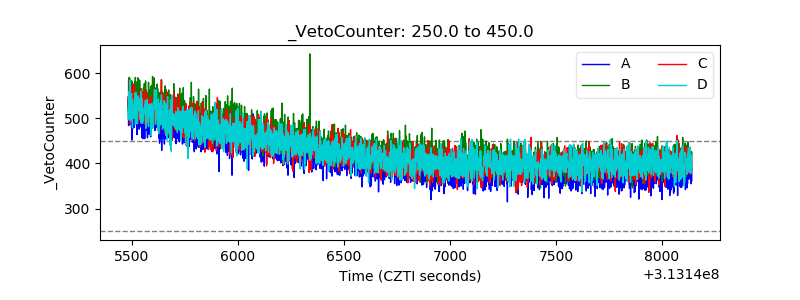 |