| Param | Original file | Final file |
|---|---|---|
| Filename | modeM0/AS1A07_112T01_9000003360cztM0_level2.fits | modeM0/AS1A07_112T01_9000003360cztM0_level2_quad_clean.evt |
| Size (bytes) | 842,754,240 | 662,137,920 |
| Size | 803.7 MB | 631.5 MB |
| Events in quadrant A | 5,303,760 | 3,786,805 |
| Events in quadrant B | 5,047,576 | 3,796,740 |
| Events in quadrant C | 5,186,904 | 3,642,701 |
| Events in quadrant D | 4,380,546 | 3,222,052 |
| Mode M9 | |||
|---|---|---|---|
| Quadrant | BADHDUFLAG | Total packets | Discarded packets |
| A | 0 | 162 | 0 |
| B | 0 | 162 | 0 |
| C | 0 | 162 | 0 |
| D | 0 | 162 | 0 |
| Mode M0 | |||
|---|---|---|---|
| Quadrant | BADHDUFLAG | Total packets | Discarded packets |
| A | 0 | 171886 | 0 |
| B | 0 | 174866 | 0 |
| C | 0 | 173982 | 0 |
| D | 0 | 239547 | 0 |
| Mode SS | |||
|---|---|---|---|
| Quadrant | BADHDUFLAG | Total packets | Discarded packets |
| A | 0 | 1668 | 0 |
| B | 0 | 1668 | 0 |
| C | 0 | 1668 | 0 |
| D | 0 | 1668 | 0 |
| Quadrant | Total seconds | Saturated seconds | Saturation percentage |
|---|---|---|---|
| A | 81706 | 952 | 1.165153% |
| B | 81710 | 1162 | 1.422103% |
| C | 81722 | 1510 | 1.847728% |
| D | 81731 | 6429 | 7.866048% |
Noise dominated data is calculated using 1-second bins in cleaned event files. If a bin has >2000 counts, and if more than 50% of those come from <1% of pixels, then it is considered to be noise-dominated and hence unusable.
| Quadrant | # 1 sec bins | Bins with >0 counts | Bins with >2000 counts | High rate bins dominated by noise | Noise dominated (total time) | Noise dominated (detector-on time) | Marked lightcurve |
|---|---|---|---|---|---|---|---|
| A | 105616 | 81766 | 0 | 0 | 0.00% | 0.00% |  |
| B | 105616 | 81744 | 0 | 0 | 0.00% | 0.00% |  |
| C | 105616 | 81774 | 0 | 0 | 0.00% | 0.00% |  |
| D | 105616 | 81643 | 0 | 0 | 0.00% | 0.00% |  |
Top three noisy pixels from each quadrant. If the there are fewer than three noisy pixels in the level2.evt file, extra rows are filled as -1
| Pixel properties | Quadrant properties | ||||||
|---|---|---|---|---|---|---|---|
| Quadrant | DetID | PixID | Counts | Sigma | Mean | Median | Sigma |
| A | 0 | 29 | 5067 | 11.06 | 1383 | 1297 | 340.7 |
| A | 7 | 110 | 4141 | 8.35 | 1383 | 1297 | 340.7 |
| A | 0 | 30 | 3968 | 7.84 | 1383 | 1297 | 340.7 |
| B | 2 | 9 | 3950 | 10.1 | 1336 | 1277 | 264.6 |
| B | 3 | 80 | 3409 | 8.06 | 1336 | 1277 | 264.6 |
| B | 5 | 128 | 3405 | 8.04 | 1336 | 1277 | 264.6 |
| C | 3 | 126 | 3535 | 6.49 | 1372 | 1288 | 346.3 |
| C | 9 | 209 | 3432 | 6.19 | 1372 | 1288 | 346.3 |
| C | 2 | 191 | 3426 | 6.17 | 1372 | 1288 | 346.3 |
| D | 3 | 14 | 3073 | 5.84 | 1253 | 1146 | 329.9 |
| D | 10 | 189 | 3049 | 5.77 | 1253 | 1146 | 329.9 |
| D | 6 | 231 | 3016 | 5.67 | 1253 | 1146 | 329.9 |
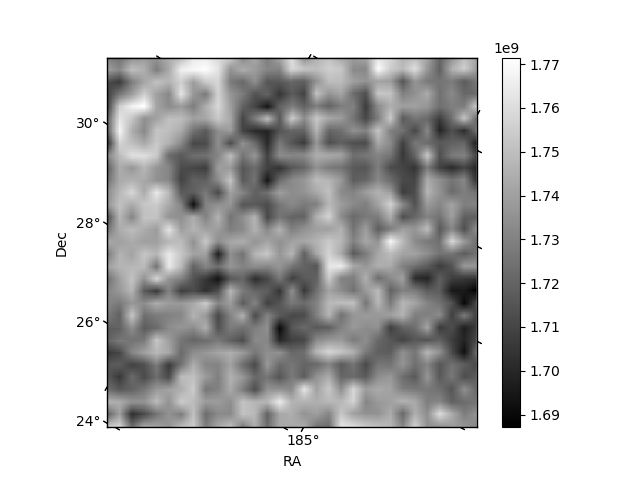
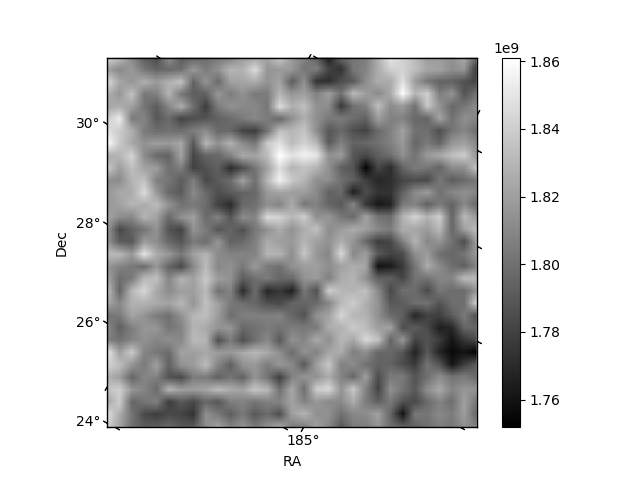
Histogram calculated using DETX and DETY for each event in the final _common_clean file
| Quadrant A | 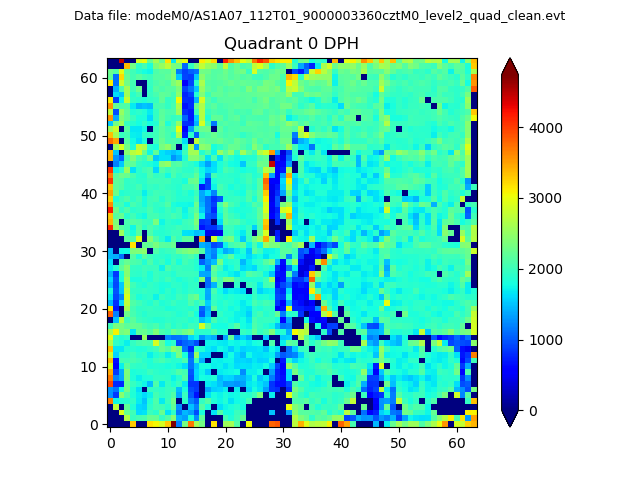 |
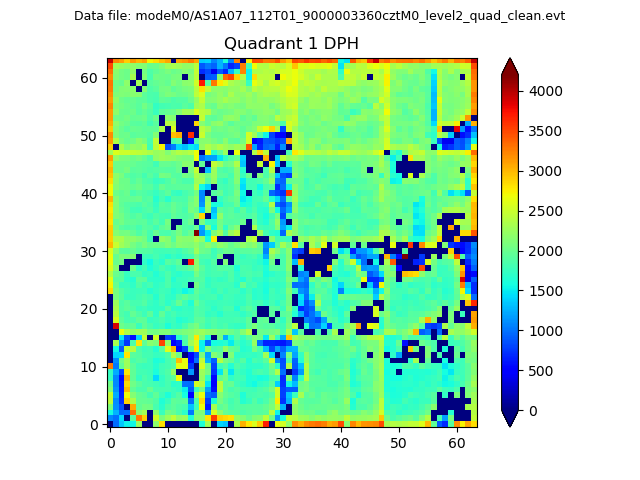 |
Quadrant B |
|---|---|---|---|
| Quadrant D |  |
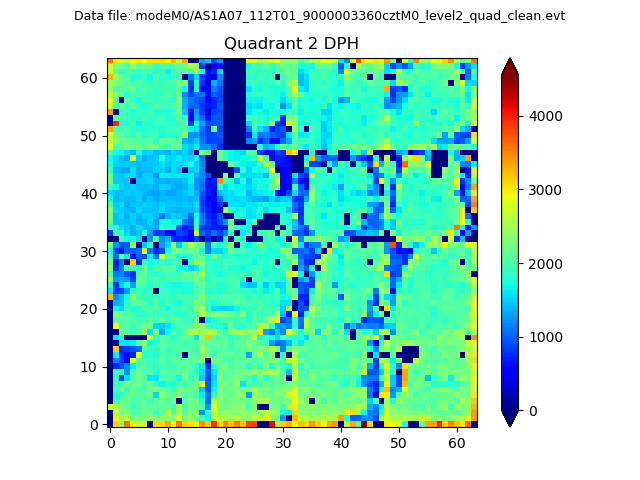 |
Quadrant C |
| Plot type | Count rate plots | Images |
|---|---|---|
| Comparison with Poisson distribution Blue bars denote a histogram of data divided into 1 sec bins. Red curve is a Poisson curve with rate = median count rate of data. |
 |
 |
| Quadrant-wise count rates Data is divided into 100 sec bins |
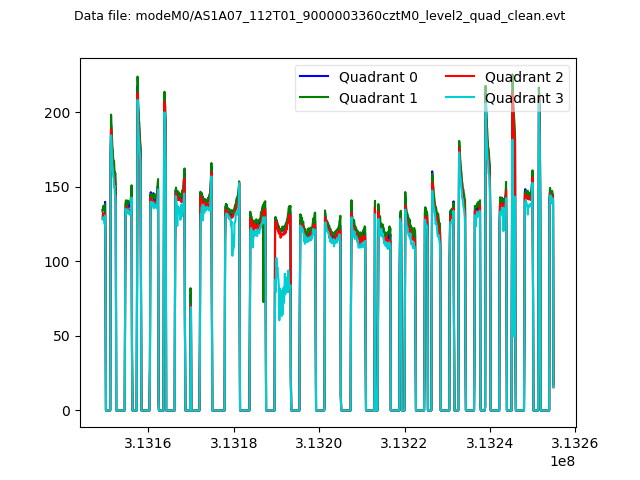 |
|
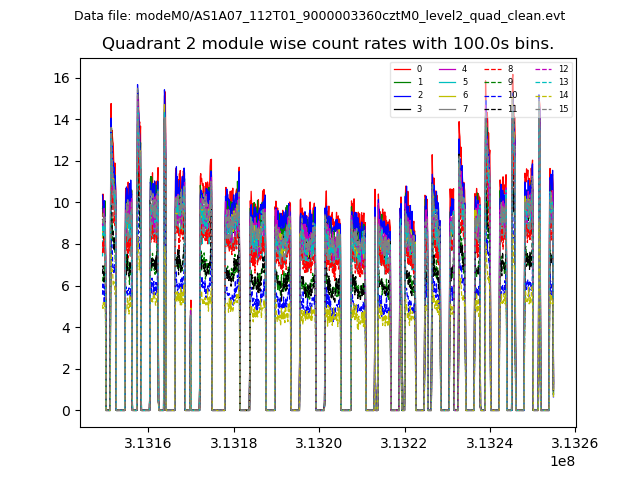
| Module-wise count rates for Quadrant A Data is divided into 100 sec bins |
 |
 |
| Module-wise count rates for Quadrant B Data is divided into 100 sec bins |
 |
 |
| Module-wise count rates for Quadrant C Data is divided into 100 sec bins |
 |
 |
| Module-wise count rates for Quadrant D Data is divided into 100 sec bins |
 |
 |
| Parameter | Plot |
|---|---|
| CZT HV Monitor |  |
| D_VDD | 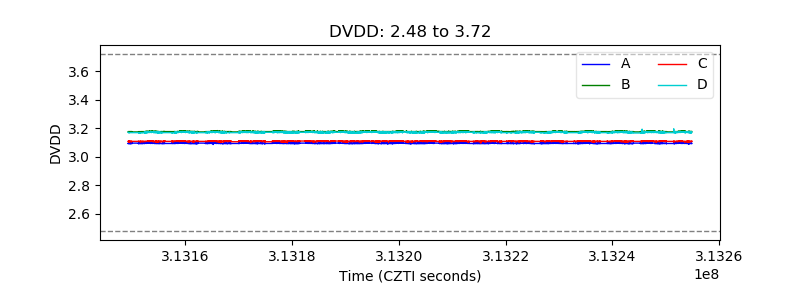 |
| Temperature 1 |  |
| Veto HV Monitor | 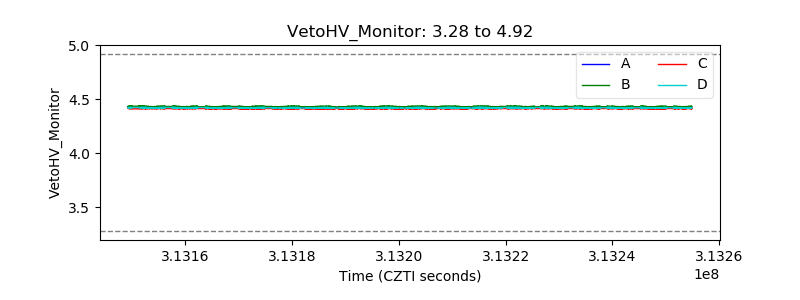 |
| Veto LLD |  |
| Alpha Counter | 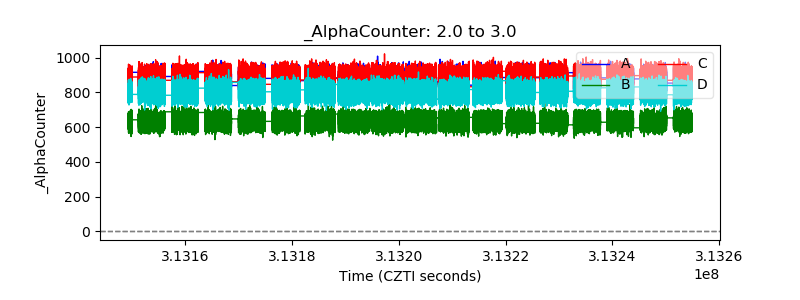 |
| _CPM_Rate | 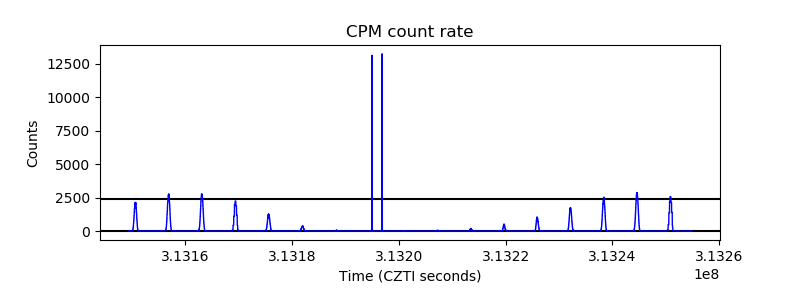 |
| CZT Counter | 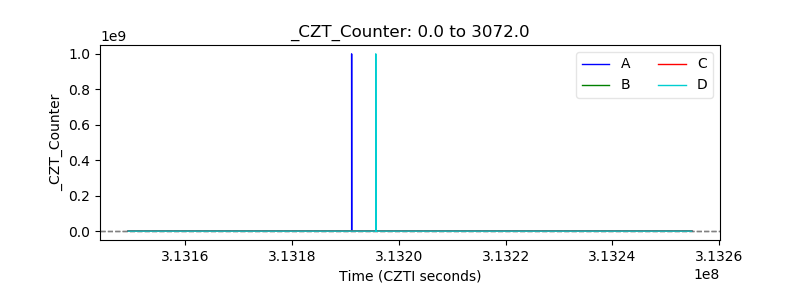 |
| +2.5 Volts monitor | 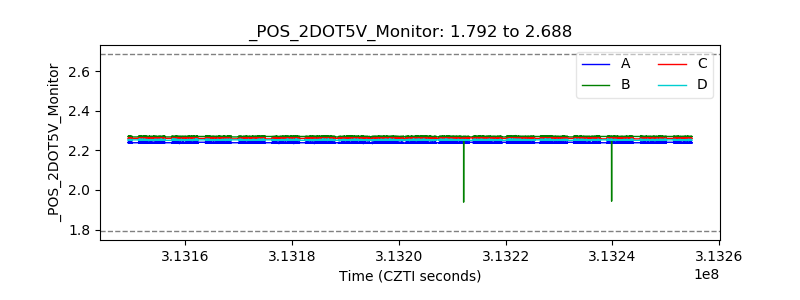 |
| +5 Volts monitor |  |
| _ROLL_ROT |  |
| _Roll_DEC |  |
| _Roll_RA |  |
| Veto Counter |  |