| Param | Original file | Final file |
|---|---|---|
| Filename | modeM0/AS1A07_112T01_9000003360_22622cztM0_level2.evt | modeM0/AS1A07_112T01_9000003360_22622cztM0_level2_quad_clean.evt |
| Size (bytes) | 479,520,000 | 94,464,000 |
| Size | 457.3 MB | 90.1 MB |
| Events in quadrant A | 3,395,644 | 611,272 |
| Events in quadrant B | 3,428,608 | 623,483 |
| Events in quadrant C | 3,466,464 | 594,690 |
| Events in quadrant D | 3,797,627 | 585,121 |
| Mode M9 | |||
|---|---|---|---|
| Quadrant | BADHDUFLAG | Total packets | Discarded packets |
| A | 0 | 12 | 0 |
| B | 0 | 13 | 0 |
| C | 0 | 13 | 0 |
| D | 0 | 13 | 0 |
| Mode M0 | |||
|---|---|---|---|
| Quadrant | BADHDUFLAG | Total packets | Discarded packets |
| A | 0 | 13991 | 2 |
| B | 0 | 14057 | 2 |
| C | 0 | 14196 | 2 |
| D | 0 | 15350 | 2 |
| Mode SS | |||
|---|---|---|---|
| Quadrant | BADHDUFLAG | Total packets | Discarded packets |
| A | 0 | 130 | 0 |
| B | 0 | 130 | 0 |
| C | 0 | 130 | 0 |
| D | 0 | 130 | 0 |
| Quadrant | Total seconds | Saturated seconds | Saturation percentage |
|---|---|---|---|
| A | 6394 | 92 | 1.438849% |
| B | 6394 | 92 | 1.438849% |
| C | 6394 | 107 | 1.673444% |
| D | 6394 | 88 | 1.376290% |
Noise dominated data is calculated using 1-second bins in cleaned event files. If a bin has >2000 counts, and if more than 50% of those come from <1% of pixels, then it is considered to be noise-dominated and hence unusable.
| Quadrant | # 1 sec bins | Bins with >0 counts | Bins with >2000 counts | High rate bins dominated by noise | Noise dominated (total time) | Noise dominated (detector-on time) | Marked lightcurve |
|---|---|---|---|---|---|---|---|
| A | 7614 | 6395 | 0 | 0 | 0.00% | 0.00% | 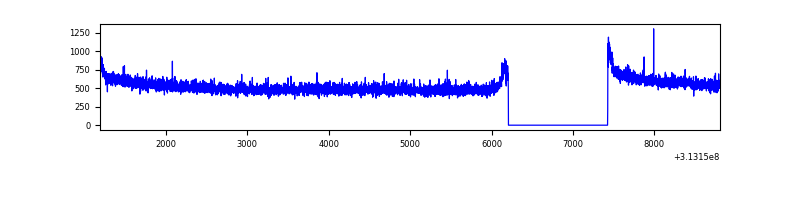 |
| B | 7614 | 6395 | 0 | 0 | 0.00% | 0.00% | 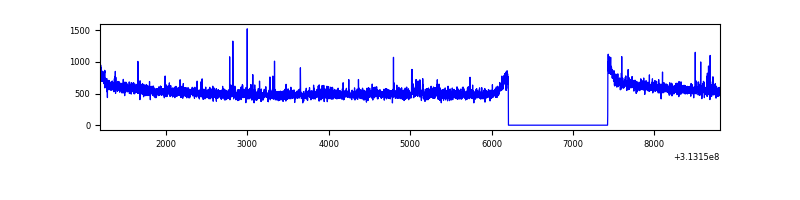 |
| C | 7614 | 6395 | 0 | 0 | 0.00% | 0.00% | 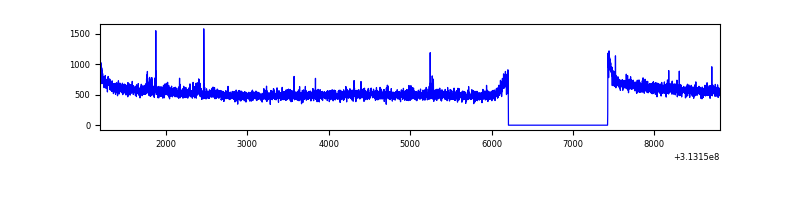 |
| D | 7614 | 6395 | 8 | 8 | 0.11% | 0.13% |  |
Top three noisy pixels from each quadrant. If the there are fewer than three noisy pixels in the level2.evt file, extra rows are filled as -1
| Pixel properties | Quadrant properties | ||||||
|---|---|---|---|---|---|---|---|
| Quadrant | DetID | PixID | Counts | Sigma | Mean | Median | Sigma |
| A | 13 | 254 | 9788 | 51.02 | 881 | 865 | 174.9 |
| A | 0 | 226 | 7642 | 38.75 | 881 | 865 | 174.9 |
| A | 3 | 137 | 6723 | 33.49 | 881 | 865 | 174.9 |
| B | 12 | 111 | 18899 | 112.51 | 866 | 847 | 160.4 |
| B | 11 | 111 | 16715 | 98.9 | 866 | 847 | 160.4 |
| B | 14 | 111 | 14810 | 87.03 | 866 | 847 | 160.4 |
| C | 14 | 238 | 136317 | 695.71 | 843 | 850 | 194.7 |
| C | 10 | 22 | 28252 | 140.73 | 843 | 850 | 194.7 |
| C | 2 | 16 | 6332 | 28.15 | 843 | 850 | 194.7 |
| D | 12 | 227 | 339659 | 1648.33 | 858 | 836 | 205.6 |
| D | 1 | 52 | 84062 | 404.88 | 858 | 836 | 205.6 |
| D | 2 | 136 | 61539 | 295.31 | 858 | 836 | 205.6 |
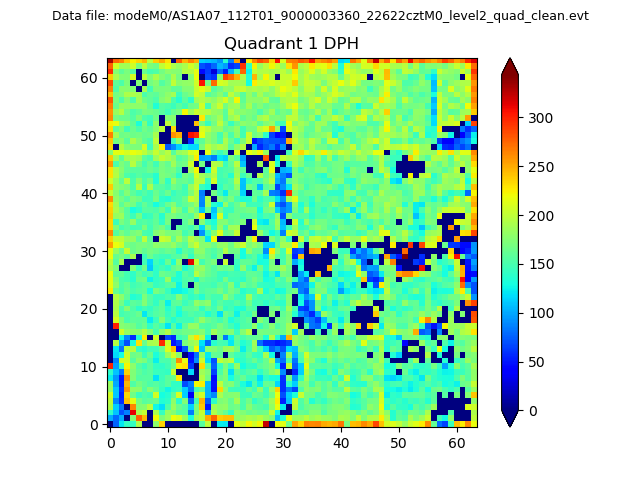
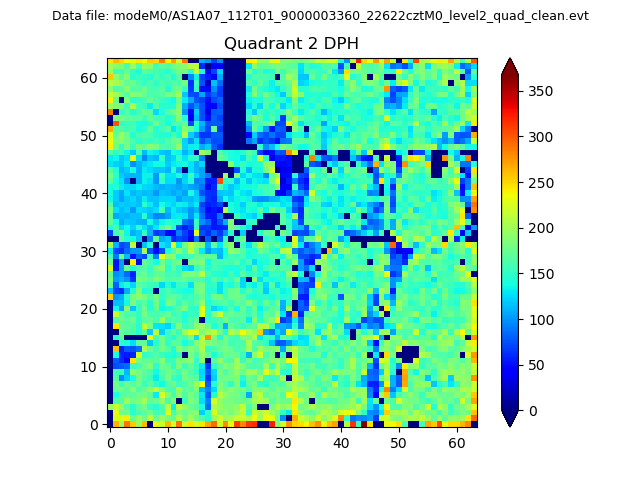
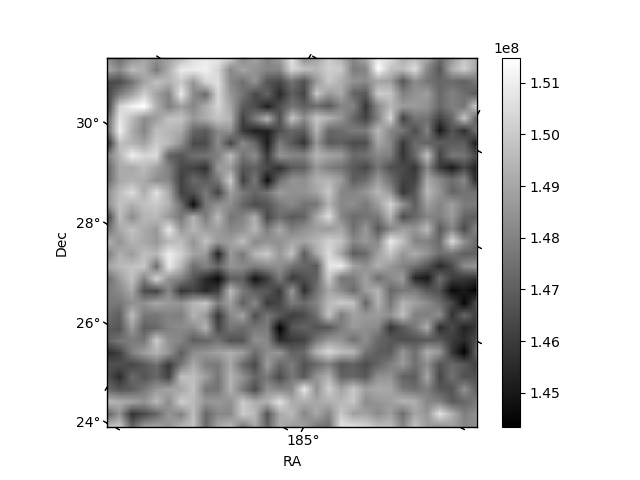
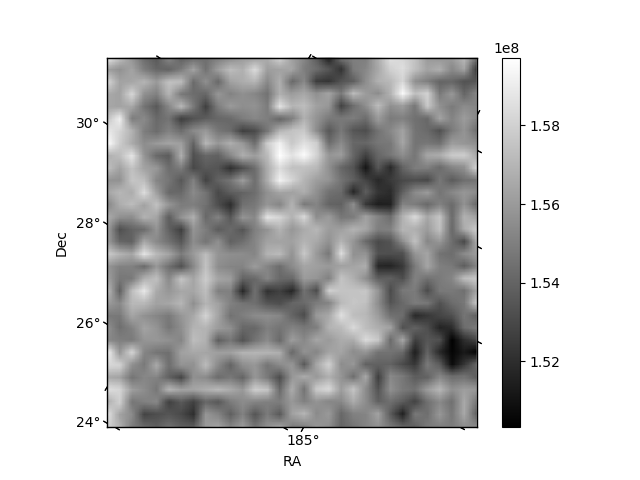
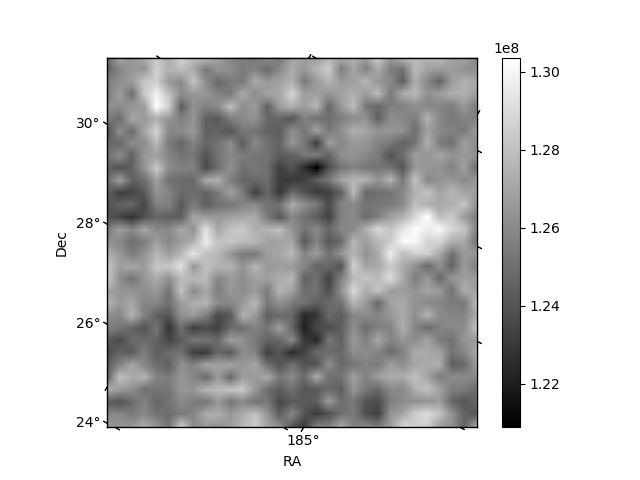
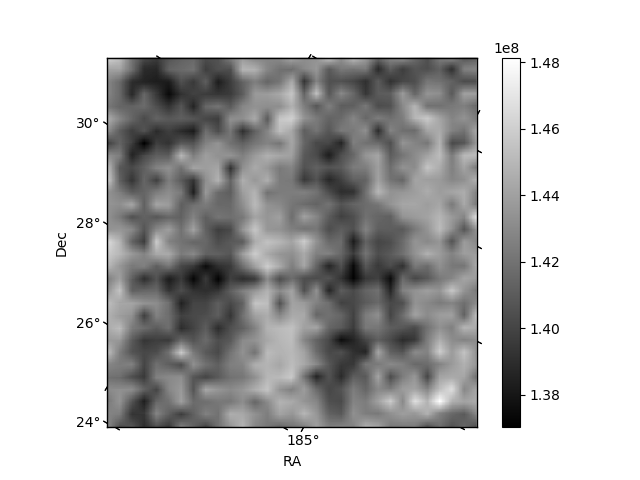
Histogram calculated using DETX and DETY for each event in the final _common_clean file
| Quadrant A | 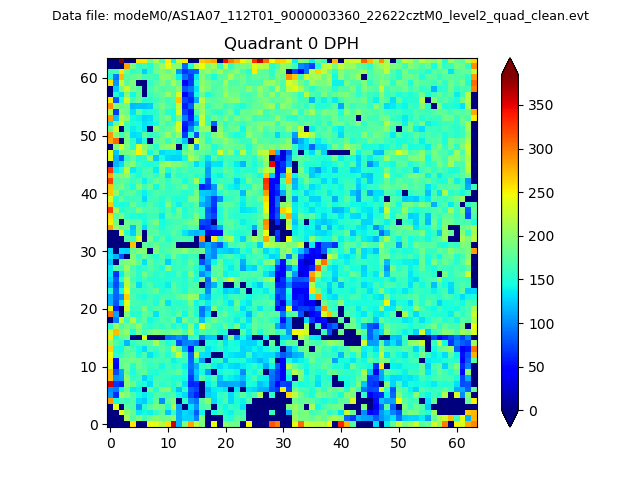 |
 |
Quadrant B |
|---|---|---|---|
| Quadrant D | 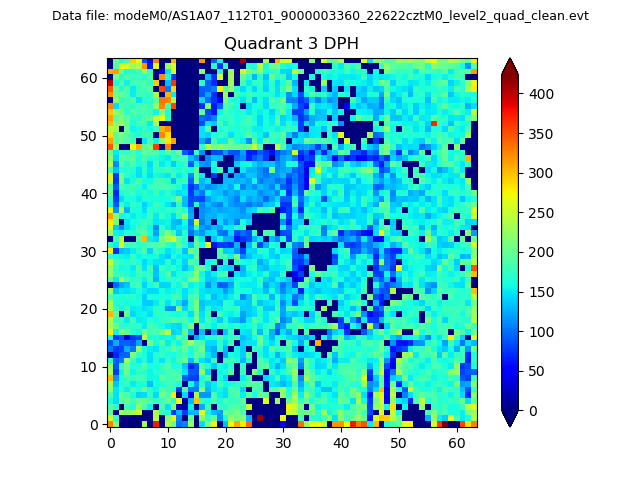 |
 |
Quadrant C |
| Plot type | Count rate plots | Images |
|---|---|---|
| Comparison with Poisson distribution Blue bars denote a histogram of data divided into 1 sec bins. Red curve is a Poisson curve with rate = median count rate of data. |
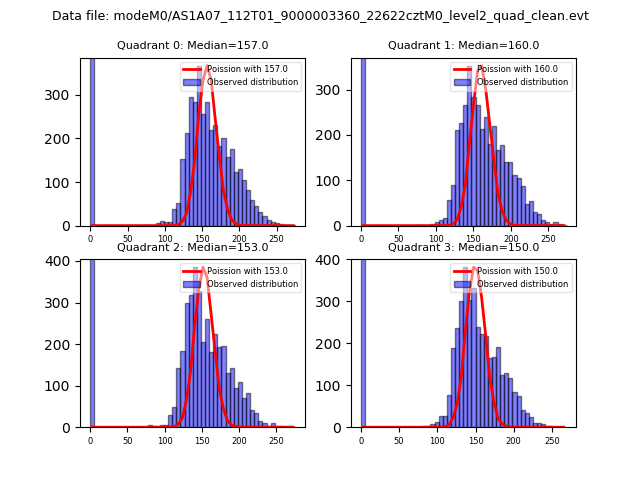 |
 |
| Quadrant-wise count rates Data is divided into 100 sec bins |
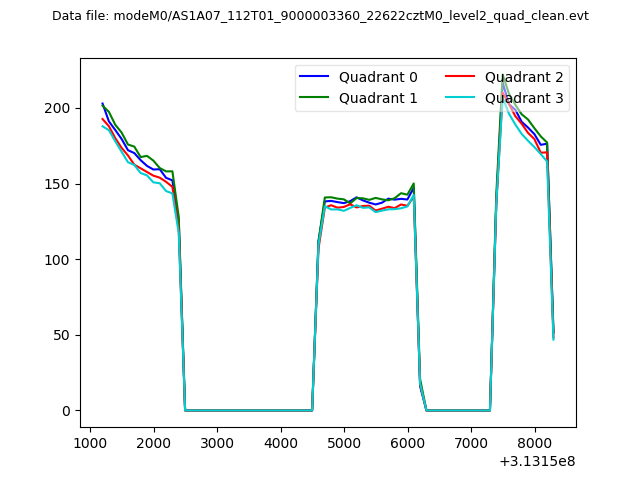 |
|
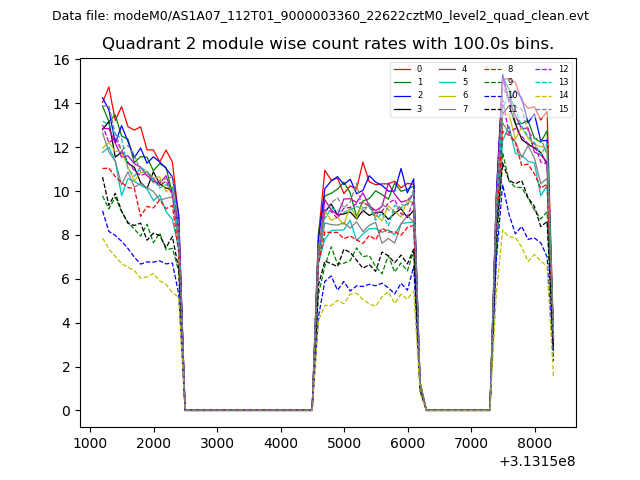
| Module-wise count rates for Quadrant A Data is divided into 100 sec bins |
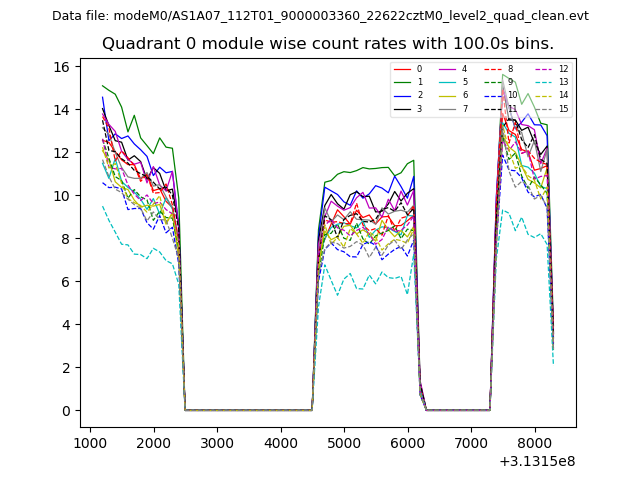 |
 |
| Module-wise count rates for Quadrant B Data is divided into 100 sec bins |
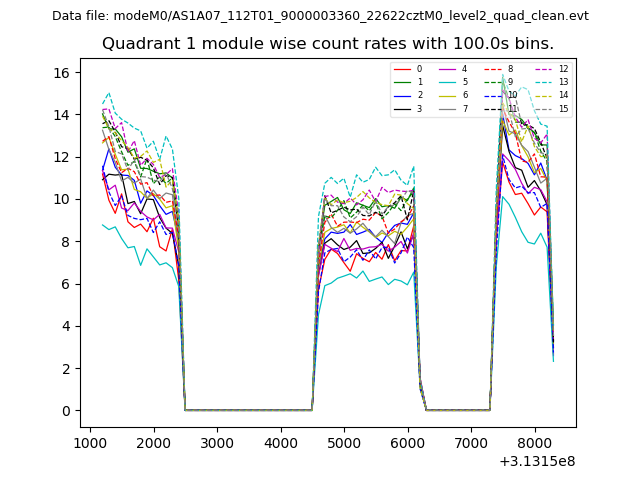 |
 |
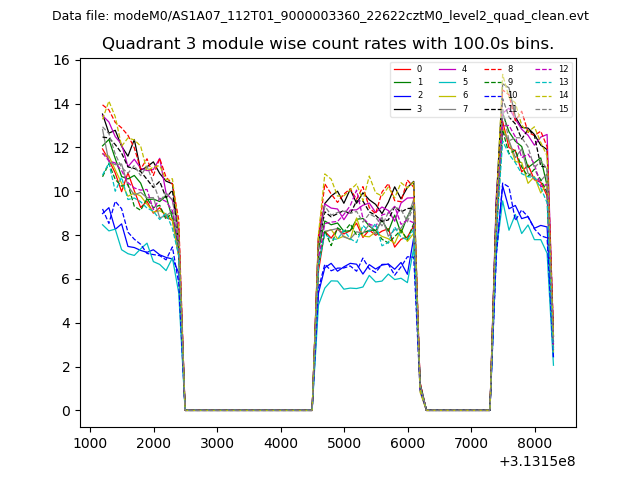
| Module-wise count rates for Quadrant C Data is divided into 100 sec bins |
 |
 |
| Module-wise count rates for Quadrant D Data is divided into 100 sec bins |
 |
 |
| Parameter | Plot |
|---|---|
| CZT HV Monitor | 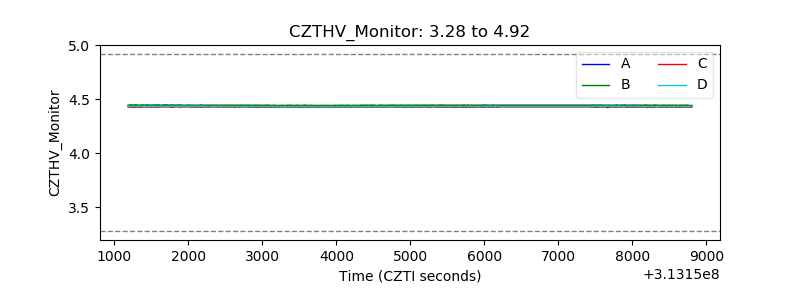 |
| D_VDD | 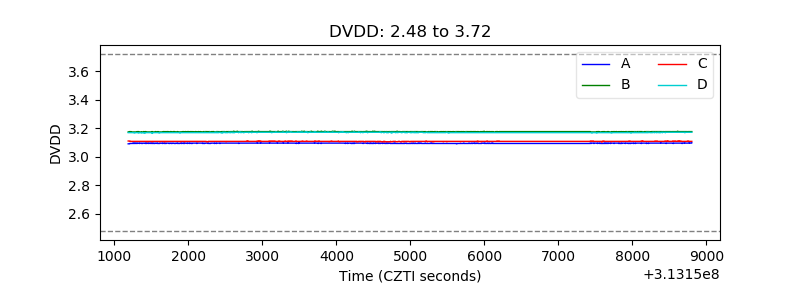 |
| Temperature 1 | 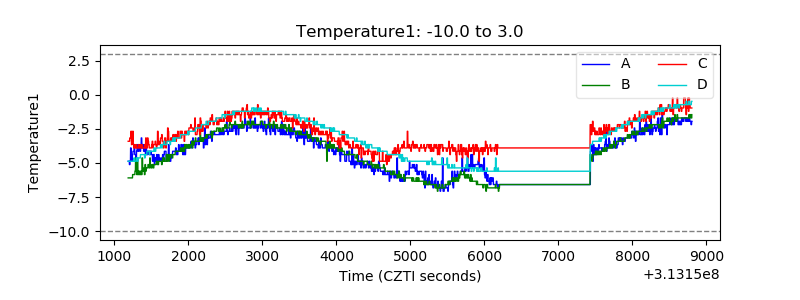 |
| Veto HV Monitor | 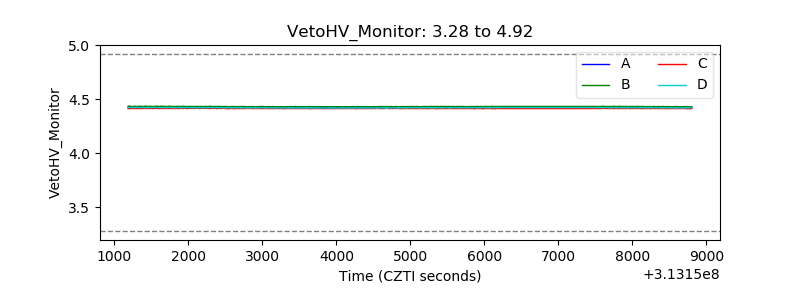 |
| Veto LLD | 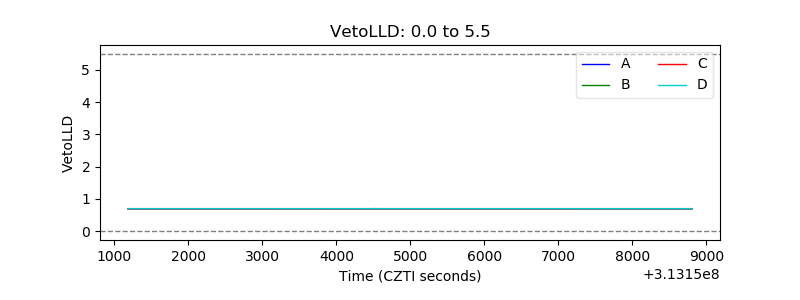 |
| Alpha Counter | 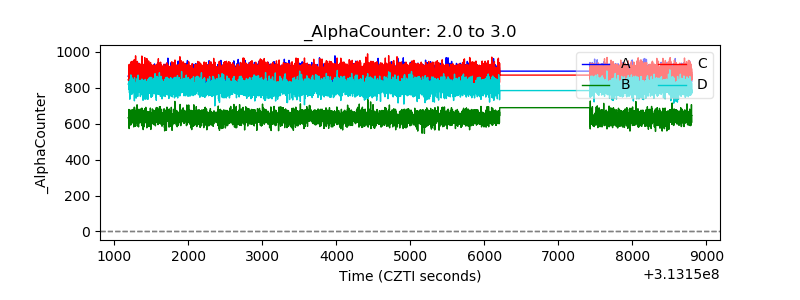 |
| _CPM_Rate | 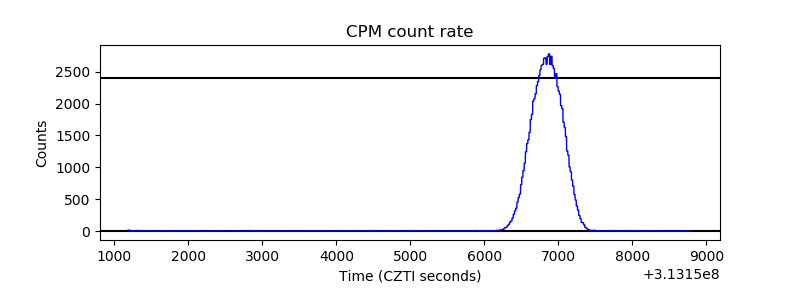 |
| CZT Counter | 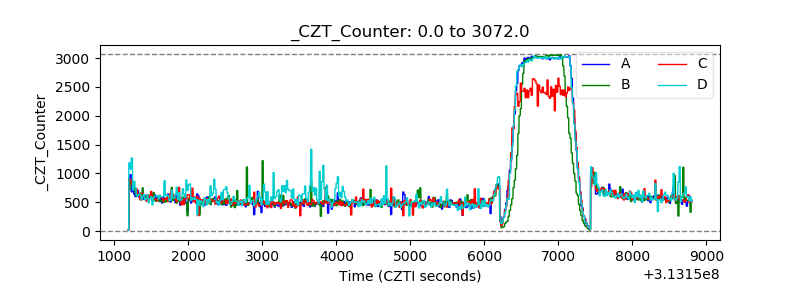 |
| +2.5 Volts monitor |  |
| +5 Volts monitor |  |
| _ROLL_ROT | 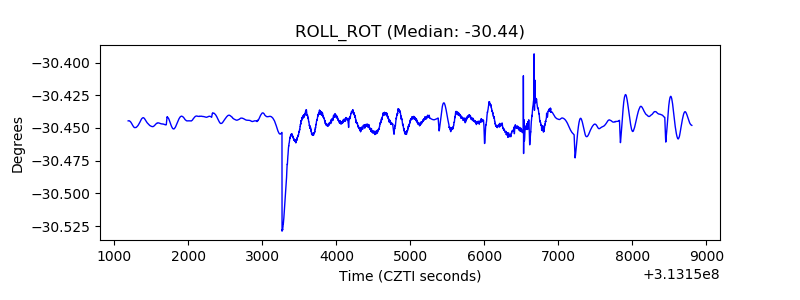 |
| _Roll_DEC | 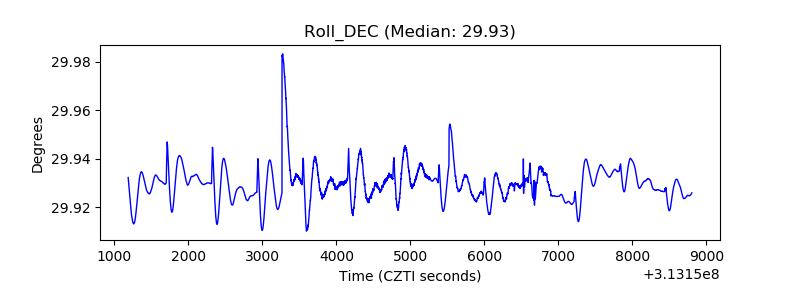 |
| _Roll_RA | 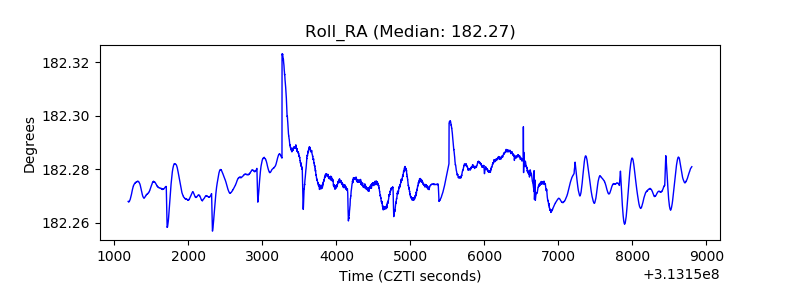 |
| Veto Counter | 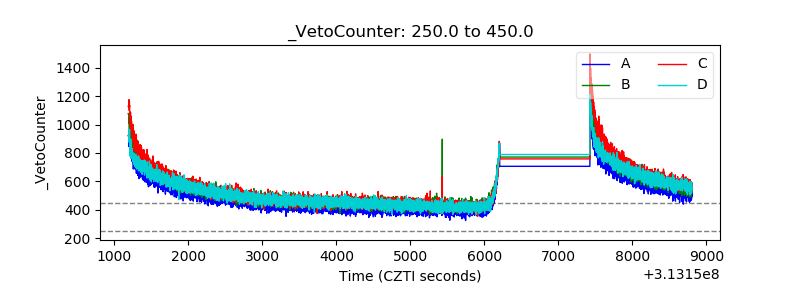 |