| Param | Original file | Final file |
|---|---|---|
| Filename | modeM0/AS1A07_112T01_9000003360_22623cztM0_level2.evt | modeM0/AS1A07_112T01_9000003360_22623cztM0_level2_quad_clean.evt |
| Size (bytes) | 465,019,200 | 81,440,640 |
| Size | 443.5 MB | 77.7 MB |
| Events in quadrant A | 3,346,127 | 515,241 |
| Events in quadrant B | 3,372,899 | 522,884 |
| Events in quadrant C | 3,405,916 | 505,178 |
| Events in quadrant D | 3,541,620 | 494,475 |
| Mode M9 | |||
|---|---|---|---|
| Quadrant | BADHDUFLAG | Total packets | Discarded packets |
| A | 0 | 14 | 0 |
| B | 0 | 14 | 0 |
| C | 0 | 14 | 0 |
| D | 0 | 14 | 0 |
| Mode M0 | |||
|---|---|---|---|
| Quadrant | BADHDUFLAG | Total packets | Discarded packets |
| A | 0 | 13798 | 1 |
| B | 0 | 13822 | 1 |
| C | 0 | 13913 | 1 |
| D | 0 | 14556 | 1 |
| Mode SS | |||
|---|---|---|---|
| Quadrant | BADHDUFLAG | Total packets | Discarded packets |
| A | 0 | 124 | 0 |
| B | 0 | 124 | 0 |
| C | 0 | 124 | 0 |
| D | 0 | 124 | 0 |
| Quadrant | Total seconds | Saturated seconds | Saturation percentage |
|---|---|---|---|
| A | 6138 | 66 | 1.075269% |
| B | 6139 | 72 | 1.172829% |
| C | 6139 | 101 | 1.645219% |
| D | 6139 | 73 | 1.189119% |
Noise dominated data is calculated using 1-second bins in cleaned event files. If a bin has >2000 counts, and if more than 50% of those come from <1% of pixels, then it is considered to be noise-dominated and hence unusable.
| Quadrant | # 1 sec bins | Bins with >0 counts | Bins with >2000 counts | High rate bins dominated by noise | Noise dominated (total time) | Noise dominated (detector-on time) | Marked lightcurve |
|---|---|---|---|---|---|---|---|
| A | 7453 | 6139 | 0 | 0 | 0.00% | 0.00% | 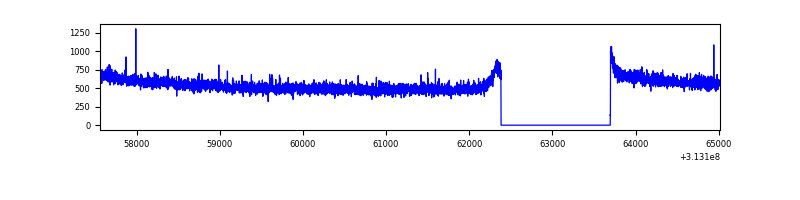 |
| B | 7454 | 6140 | 0 | 0 | 0.00% | 0.00% | 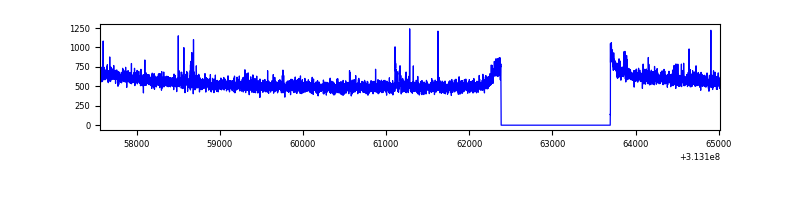 |
| C | 7454 | 6140 | 0 | 0 | 0.00% | 0.00% | 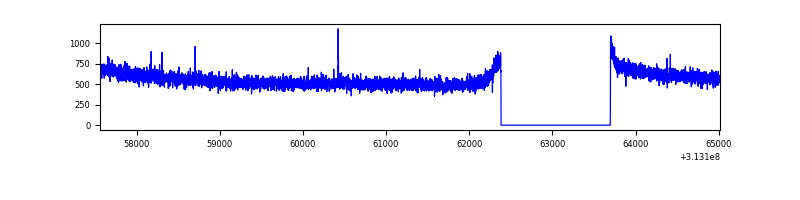 |
| D | 7454 | 6140 | 9 | 9 | 0.12% | 0.15% | 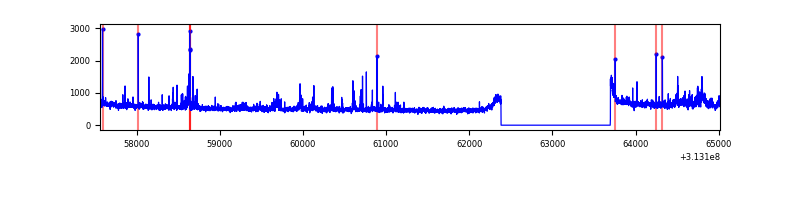 |
Top three noisy pixels from each quadrant. If the there are fewer than three noisy pixels in the level2.evt file, extra rows are filled as -1
| Pixel properties | Quadrant properties | ||||||
|---|---|---|---|---|---|---|---|
| Quadrant | DetID | PixID | Counts | Sigma | Mean | Median | Sigma |
| A | 13 | 254 | 10229 | 54.57 | 868 | 851 | 171.8 |
| A | 0 | 226 | 7611 | 39.34 | 868 | 851 | 171.8 |
| A | 3 | 137 | 6538 | 33.09 | 868 | 851 | 171.8 |
| B | 12 | 111 | 18054 | 108.47 | 854 | 836 | 158.7 |
| B | 0 | 197 | 16396 | 98.03 | 854 | 836 | 158.7 |
| B | 11 | 111 | 16089 | 96.09 | 854 | 836 | 158.7 |
| C | 14 | 238 | 136740 | 704.15 | 837 | 846 | 193.0 |
| C | 13 | 61 | 5745 | 25.38 | 837 | 846 | 193.0 |
| C | 10 | 22 | 5340 | 23.29 | 837 | 846 | 193.0 |
| D | 12 | 227 | 150355 | 738.51 | 851 | 832 | 202.5 |
| D | 1 | 52 | 79884 | 390.45 | 851 | 832 | 202.5 |
| D | 12 | 233 | 30842 | 148.22 | 851 | 832 | 202.5 |
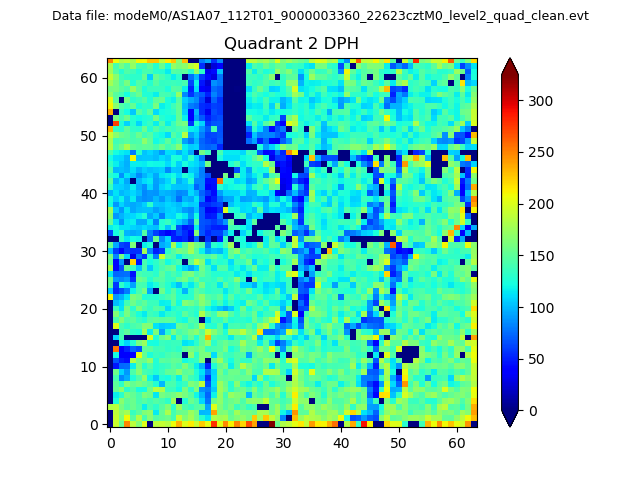
Histogram calculated using DETX and DETY for each event in the final _common_clean file
| Quadrant A | 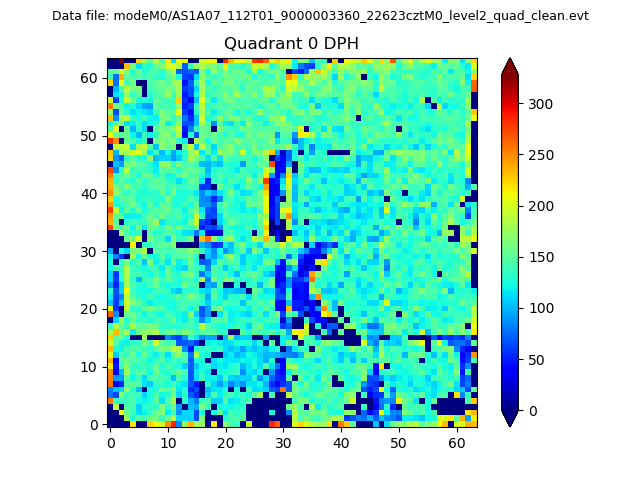 |
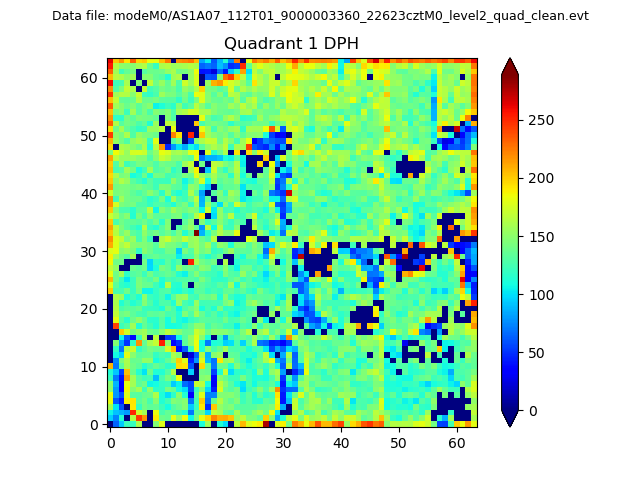 |
Quadrant B |
|---|---|---|---|
| Quadrant D | 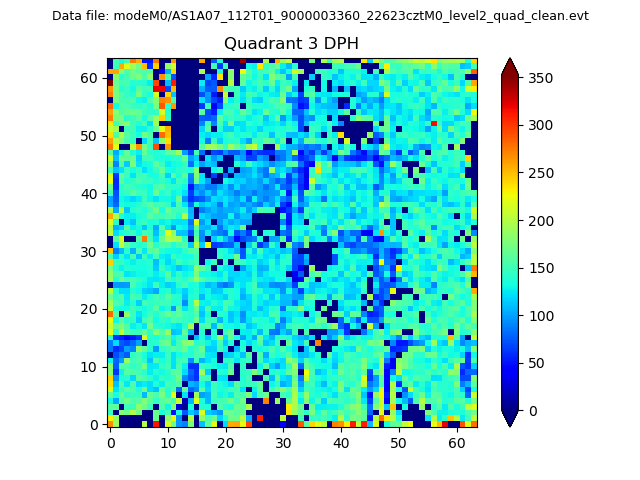 |
 |
Quadrant C |
| Plot type | Count rate plots | Images |
|---|---|---|
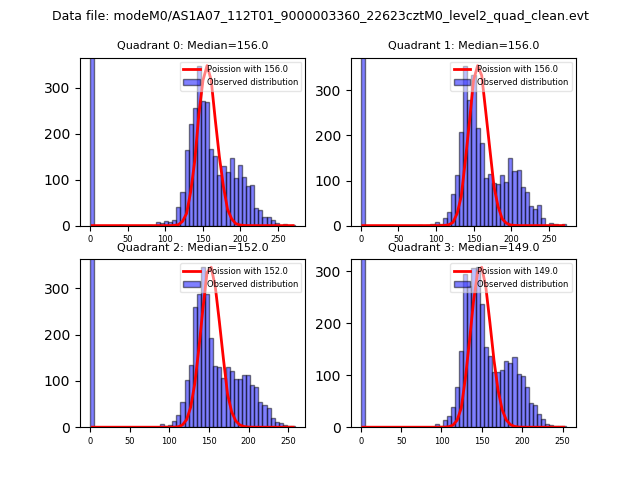
| Comparison with Poisson distribution Blue bars denote a histogram of data divided into 1 sec bins. Red curve is a Poisson curve with rate = median count rate of data. |
 |
 |
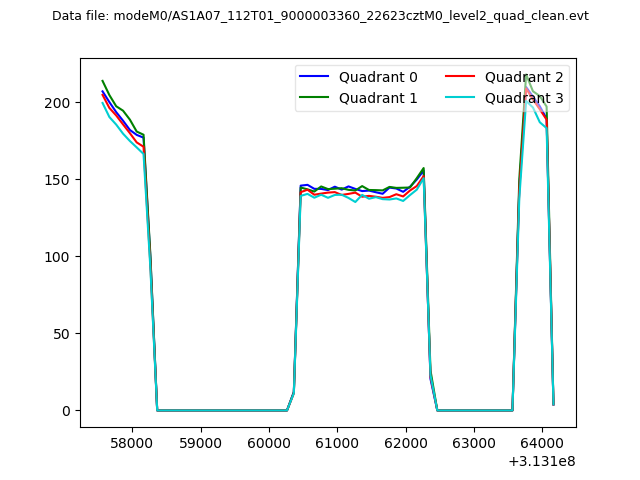
| Quadrant-wise count rates Data is divided into 100 sec bins |
 |
|
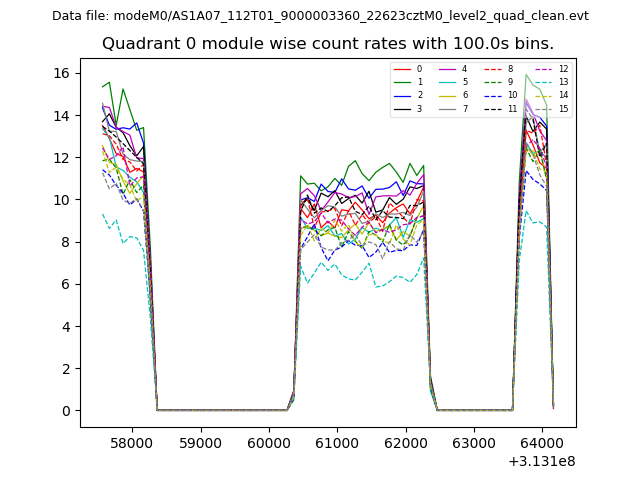
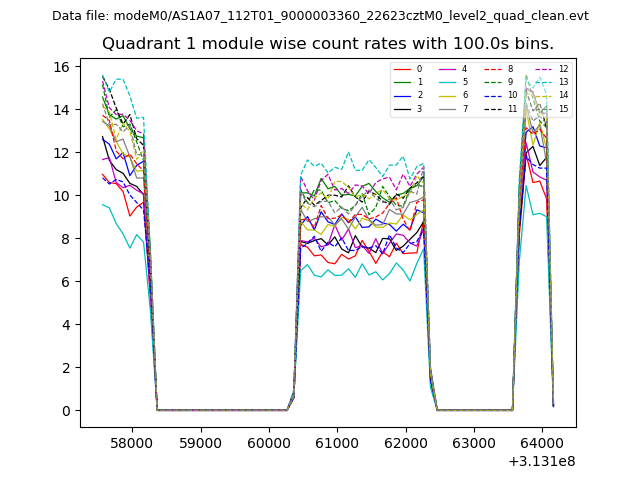
| Module-wise count rates for Quadrant A Data is divided into 100 sec bins |
 |
 |
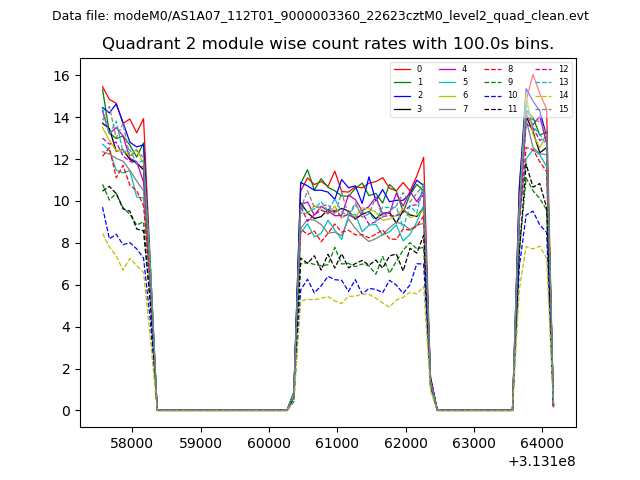
| Module-wise count rates for Quadrant B Data is divided into 100 sec bins |
 |
 |
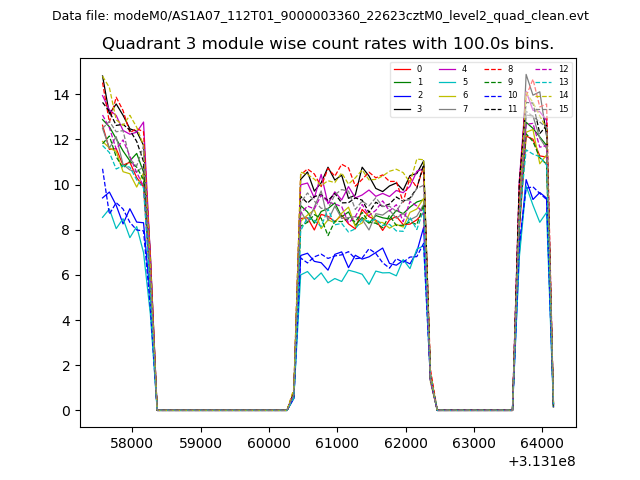
| Module-wise count rates for Quadrant C Data is divided into 100 sec bins |
 |
 |
| Module-wise count rates for Quadrant D Data is divided into 100 sec bins |
 |
 |
| Parameter | Plot |
|---|---|
| CZT HV Monitor | 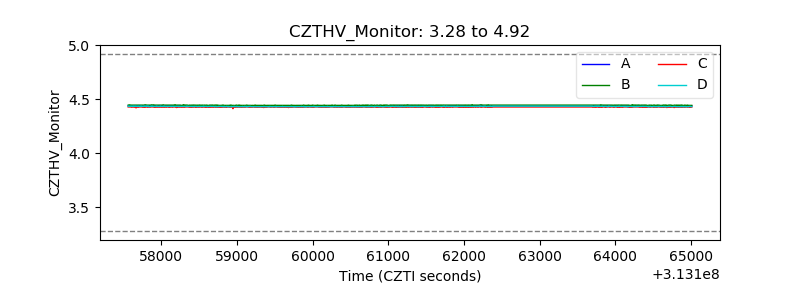 |
| D_VDD | 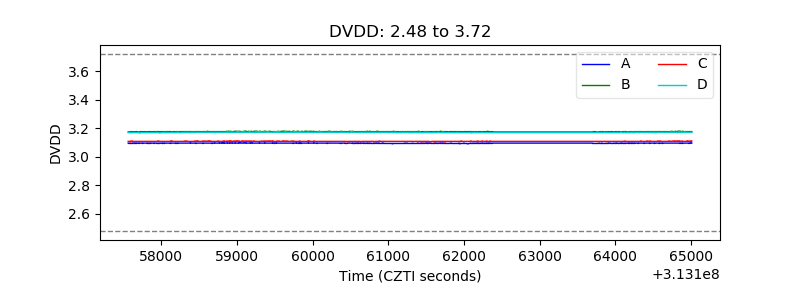 |
| Temperature 1 | 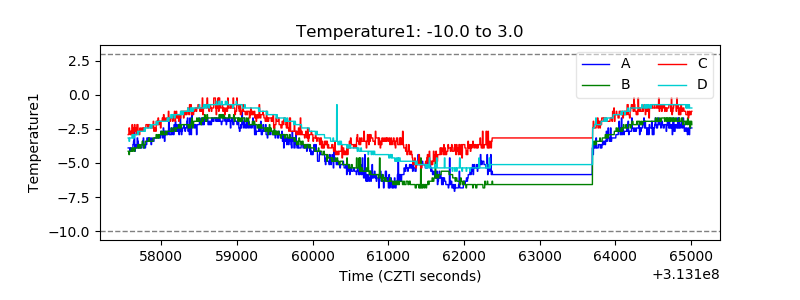 |
| Veto HV Monitor | 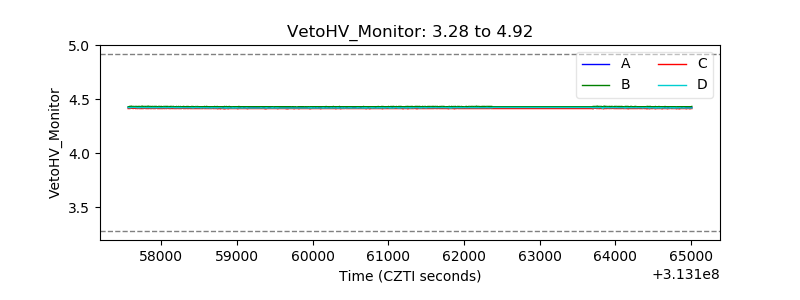 |
| Veto LLD | 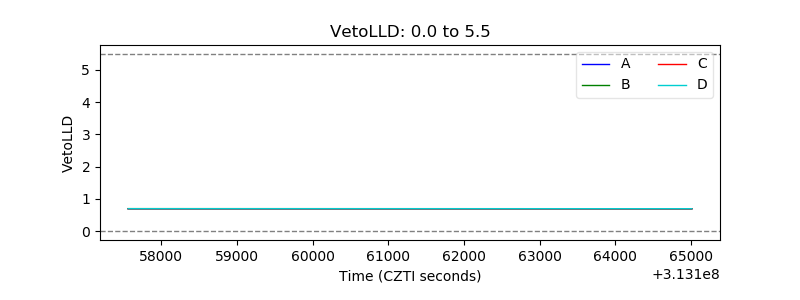 |
| Alpha Counter | 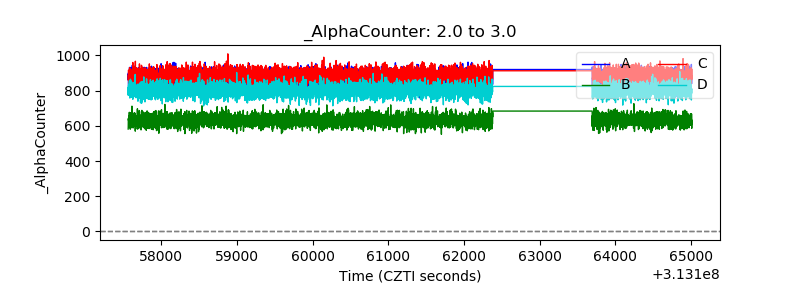 |
| _CPM_Rate | 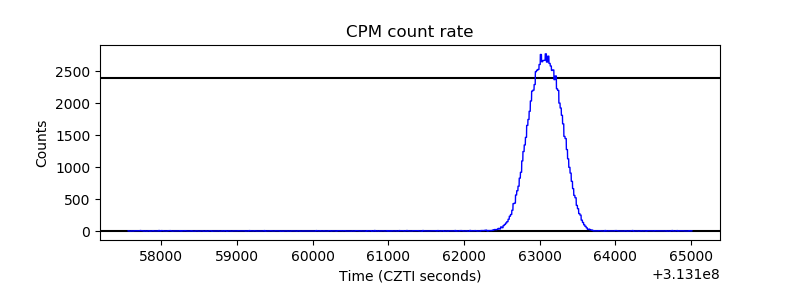 |
| CZT Counter | 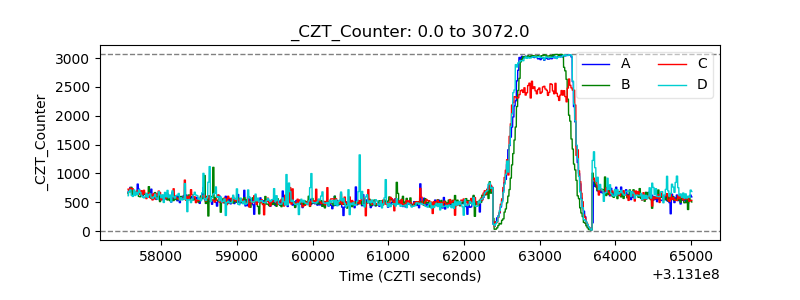 |
| +2.5 Volts monitor |  |
| +5 Volts monitor |  |
| _ROLL_ROT | 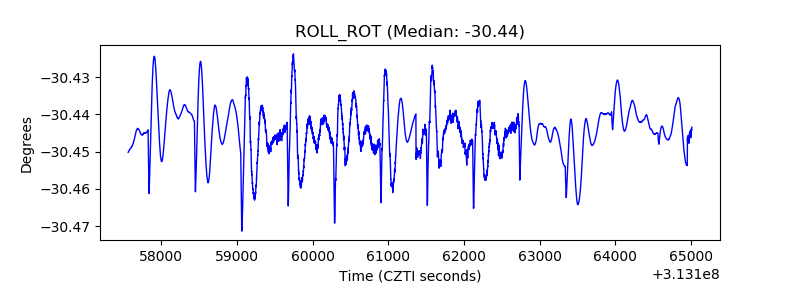 |
| _Roll_DEC | 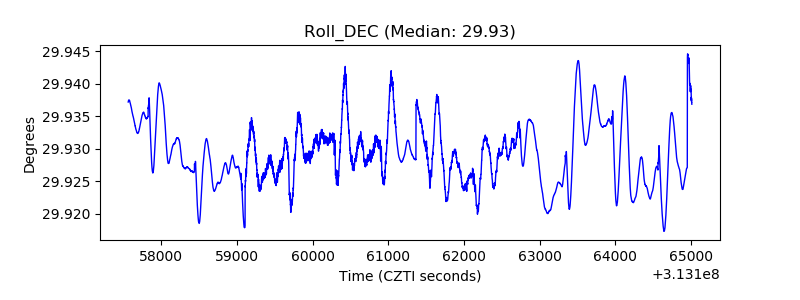 |
| _Roll_RA | 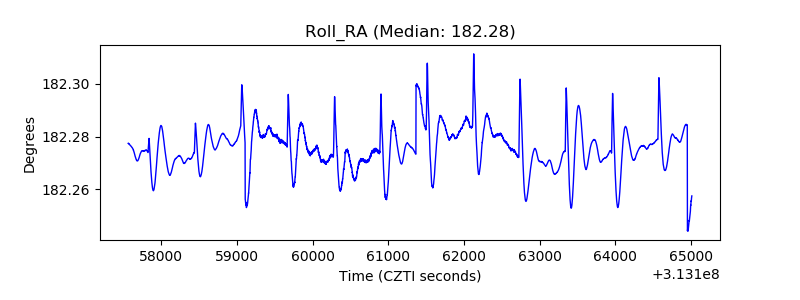 |
| Veto Counter | 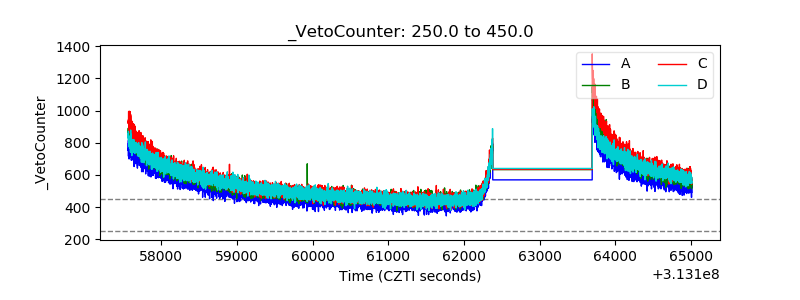 |