| Param | Original file | Final file |
|---|---|---|
| Filename | modeM0/AS1A07_112T01_9000003360_22624cztM0_level2.evt | modeM0/AS1A07_112T01_9000003360_22624cztM0_level2_quad_clean.evt |
| Size (bytes) | 533,954,880 | 65,393,280 |
| Size | 509.2 MB | 62.4 MB |
| Events in quadrant A | 3,359,928 | 392,531 |
| Events in quadrant B | 3,417,890 | 399,671 |
| Events in quadrant C | 3,454,083 | 385,969 |
| Events in quadrant D | 5,518,198 | 368,456 |
| Mode M9 | |||
|---|---|---|---|
| Quadrant | BADHDUFLAG | Total packets | Discarded packets |
| A | 0 | 13 | 0 |
| B | 0 | 13 | 0 |
| C | 0 | 13 | 0 |
| D | 0 | 13 | 0 |
| Mode M0 | |||
|---|---|---|---|
| Quadrant | BADHDUFLAG | Total packets | Discarded packets |
| A | 0 | 13817 | 1 |
| B | 0 | 13941 | 1 |
| C | 0 | 14115 | 1 |
| D | 0 | 20759 | 1 |
| Mode SS | |||
|---|---|---|---|
| Quadrant | BADHDUFLAG | Total packets | Discarded packets |
| A | 0 | 126 | 0 |
| B | 0 | 126 | 0 |
| C | 0 | 126 | 0 |
| D | 0 | 126 | 0 |
| Quadrant | Total seconds | Saturated seconds | Saturation percentage |
|---|---|---|---|
| A | 6206 | 101 | 1.627457% |
| B | 6207 | 105 | 1.691638% |
| C | 6207 | 142 | 2.287740% |
| D | 6206 | 611 | 9.845311% |
Noise dominated data is calculated using 1-second bins in cleaned event files. If a bin has >2000 counts, and if more than 50% of those come from <1% of pixels, then it is considered to be noise-dominated and hence unusable.
| Quadrant | # 1 sec bins | Bins with >0 counts | Bins with >2000 counts | High rate bins dominated by noise | Noise dominated (total time) | Noise dominated (detector-on time) | Marked lightcurve |
|---|---|---|---|---|---|---|---|
| A | 7521 | 6207 | 0 | 0 | 0.00% | 0.00% | 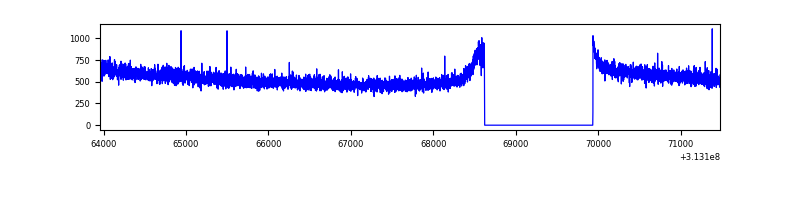 |
| B | 7522 | 6208 | 0 | 0 | 0.00% | 0.00% | 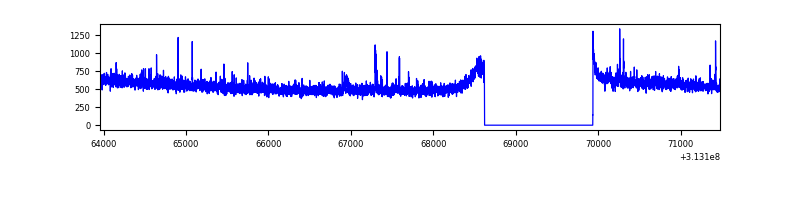 |
| C | 7522 | 6208 | 0 | 0 | 0.00% | 0.00% | 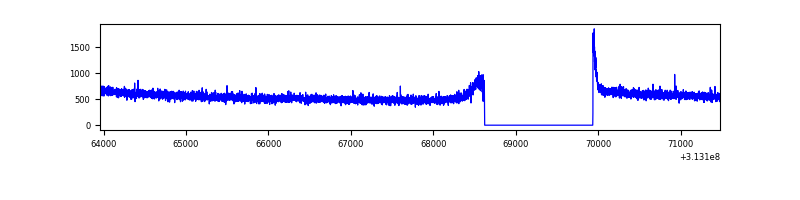 |
| D | 7521 | 6207 | 487 | 487 | 6.48% | 7.85% |  |
Top three noisy pixels from each quadrant. If the there are fewer than three noisy pixels in the level2.evt file, extra rows are filled as -1
| Pixel properties | Quadrant properties | ||||||
|---|---|---|---|---|---|---|---|
| Quadrant | DetID | PixID | Counts | Sigma | Mean | Median | Sigma |
| A | 13 | 254 | 10015 | 52.8 | 871 | 855 | 173.5 |
| A | 0 | 226 | 7696 | 39.43 | 871 | 855 | 173.5 |
| A | 3 | 137 | 6815 | 34.35 | 871 | 855 | 173.5 |
| B | 0 | 190 | 21647 | 131.08 | 861 | 842 | 158.7 |
| B | 12 | 111 | 17865 | 107.25 | 861 | 842 | 158.7 |
| B | 11 | 111 | 16398 | 98.01 | 861 | 842 | 158.7 |
| C | 14 | 238 | 135578 | 693.18 | 844 | 854 | 194.4 |
| C | 0 | 10 | 27195 | 135.53 | 844 | 854 | 194.4 |
| C | 13 | 61 | 5861 | 25.76 | 844 | 854 | 194.4 |
| D | 1 | 52 | 2143098 | 11057.0 | 806 | 784 | 193.8 |
| D | 12 | 227 | 140557 | 721.4 | 806 | 784 | 193.8 |
| D | 7 | 223 | 93346 | 477.73 | 806 | 784 | 193.8 |
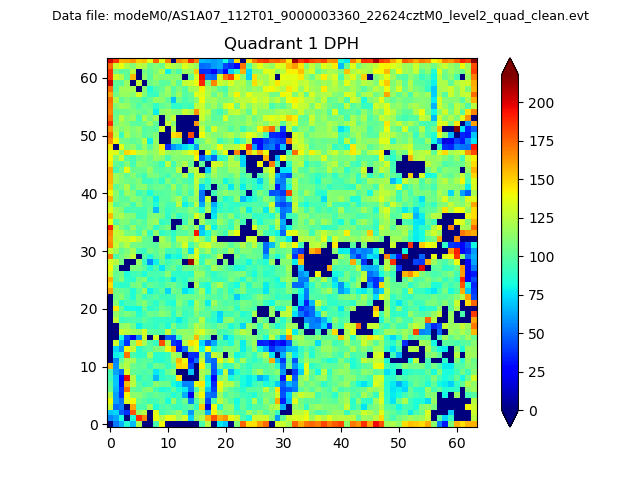
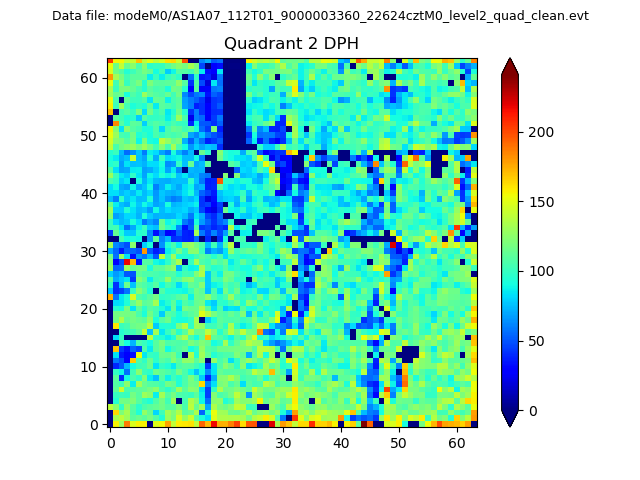
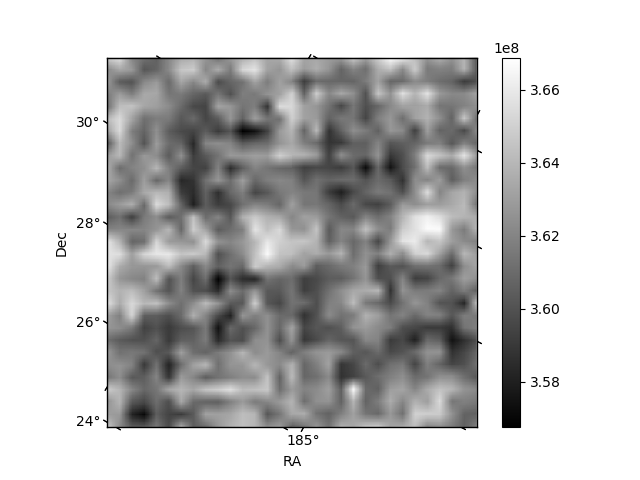
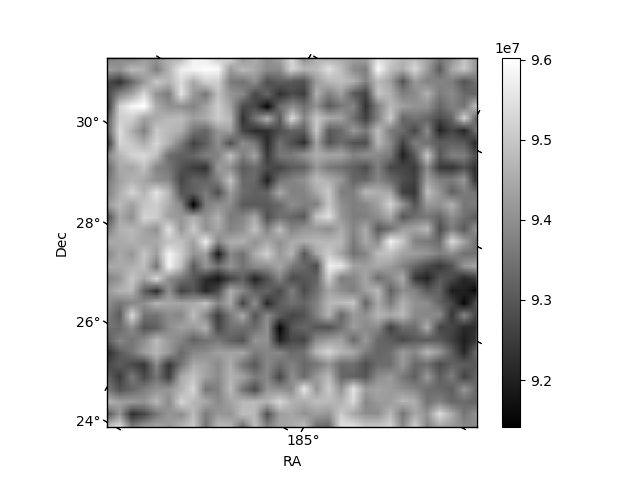
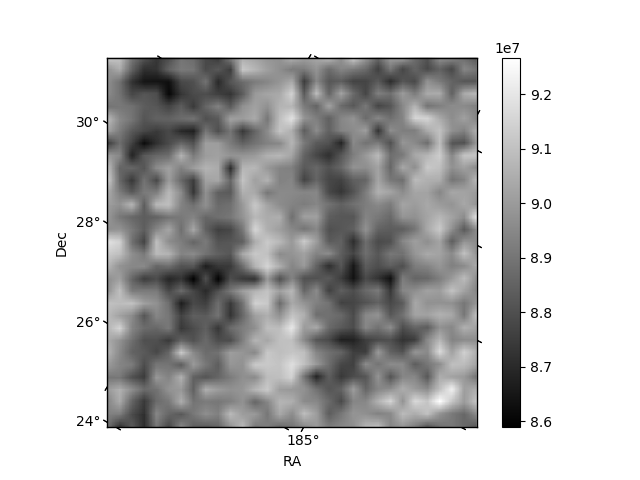
Histogram calculated using DETX and DETY for each event in the final _common_clean file
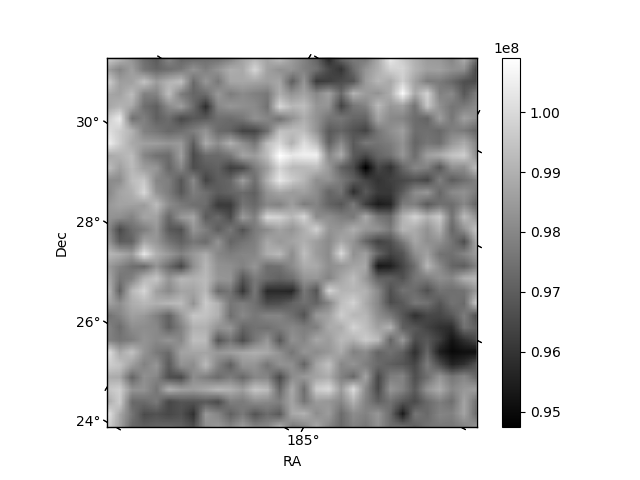
| Quadrant A | 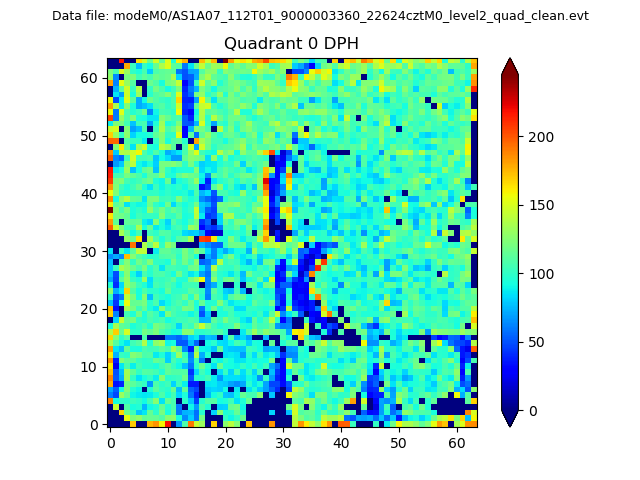 |
 |
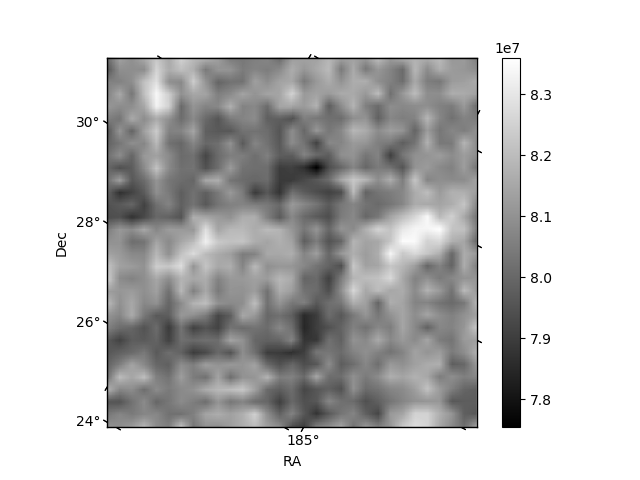
Quadrant B |
|---|---|---|---|
| Quadrant D | 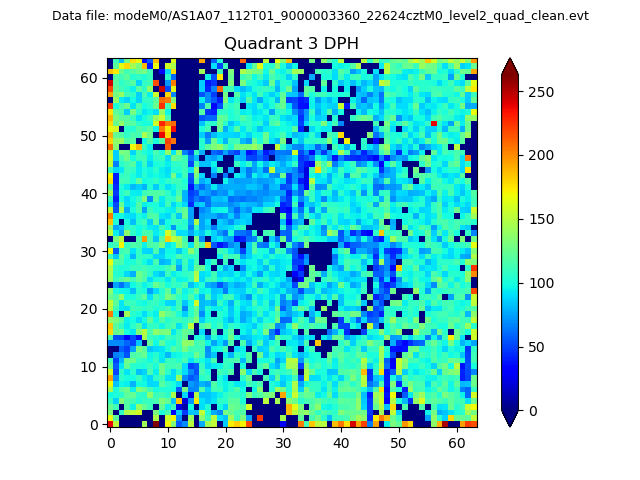 |
 |
Quadrant C |
| Plot type | Count rate plots | Images |
|---|---|---|
| Comparison with Poisson distribution Blue bars denote a histogram of data divided into 1 sec bins. Red curve is a Poisson curve with rate = median count rate of data. |
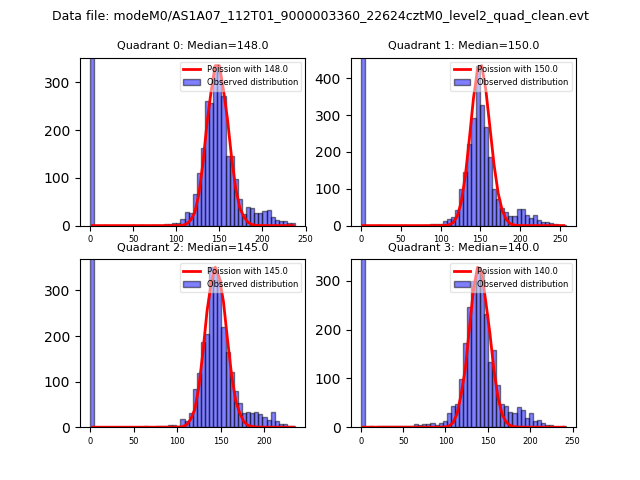 |
 |
| Quadrant-wise count rates Data is divided into 100 sec bins |
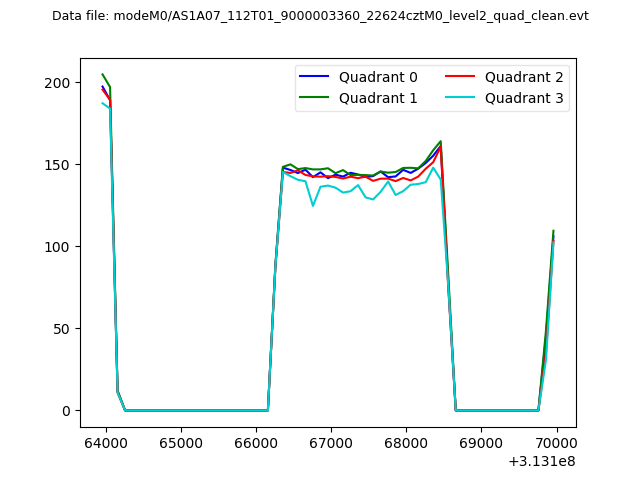 |
|
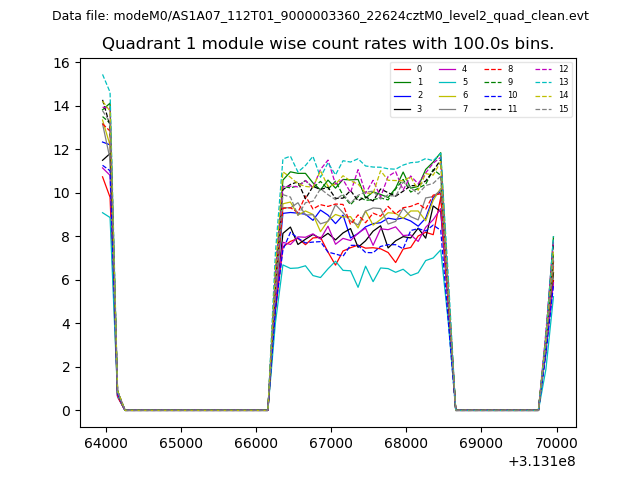
| Module-wise count rates for Quadrant A Data is divided into 100 sec bins |
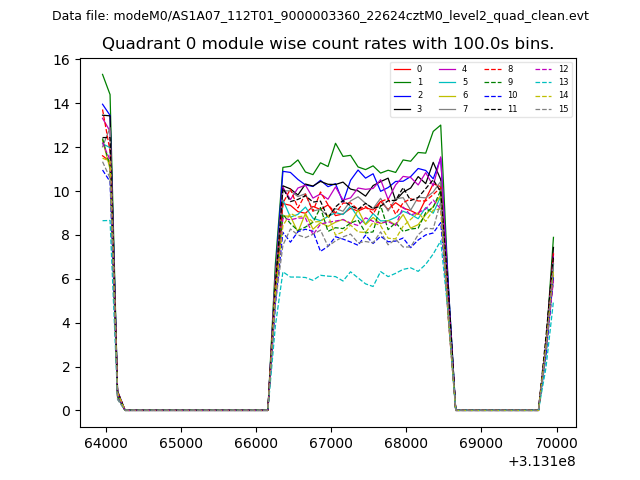 |
 |
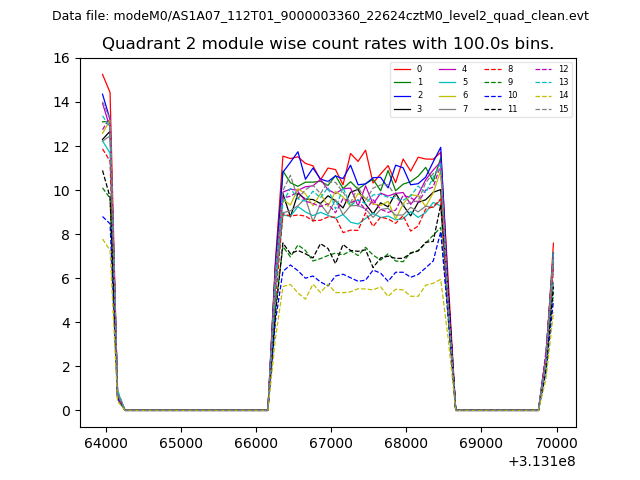
| Module-wise count rates for Quadrant B Data is divided into 100 sec bins |
 |
 |
| Module-wise count rates for Quadrant C Data is divided into 100 sec bins |
 |
 |
| Module-wise count rates for Quadrant D Data is divided into 100 sec bins |
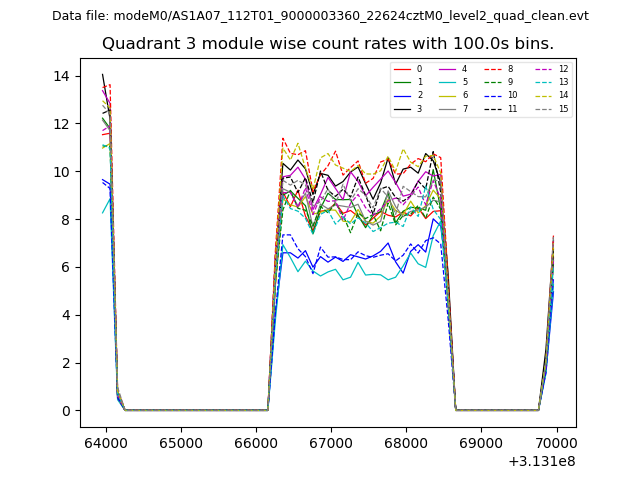 |
 |
| Parameter | Plot |
|---|---|
| CZT HV Monitor | 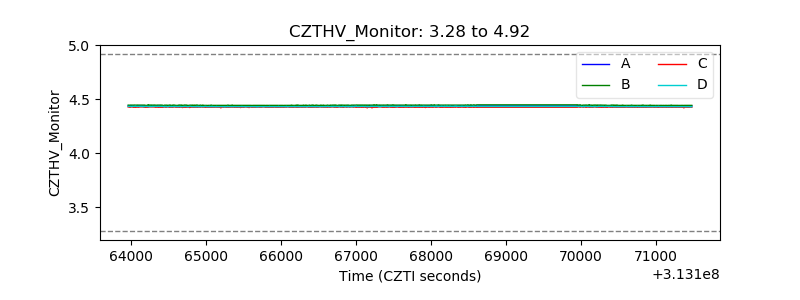 |
| D_VDD | 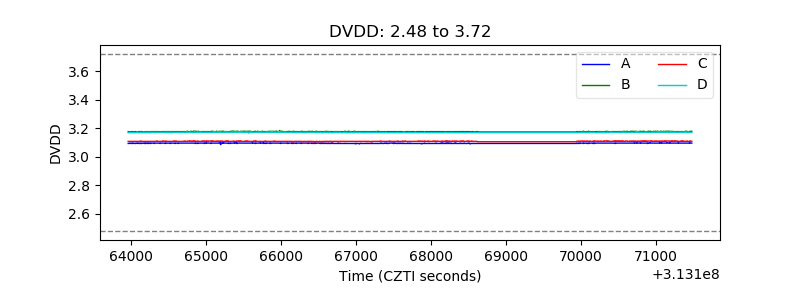 |
| Temperature 1 | 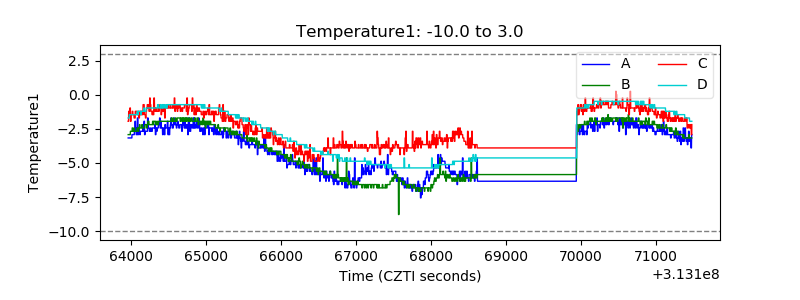 |
| Veto HV Monitor |  |
| Veto LLD | 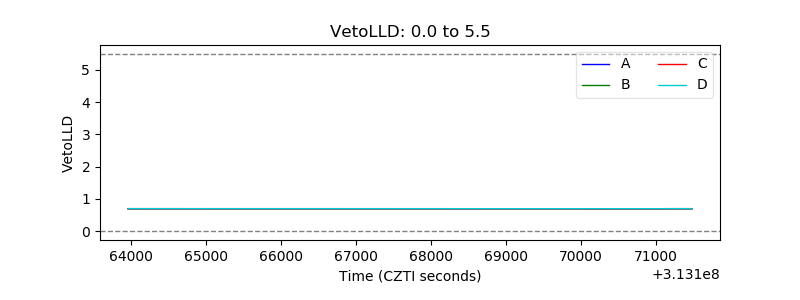 |
| Alpha Counter | 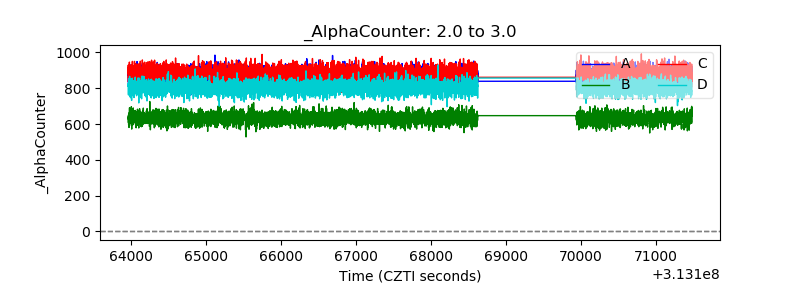 |
| _CPM_Rate | 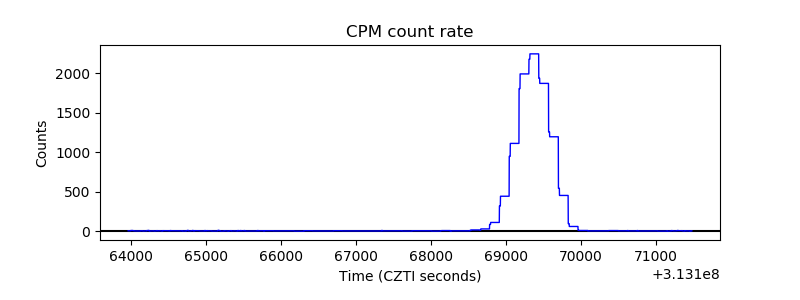 |
| CZT Counter | 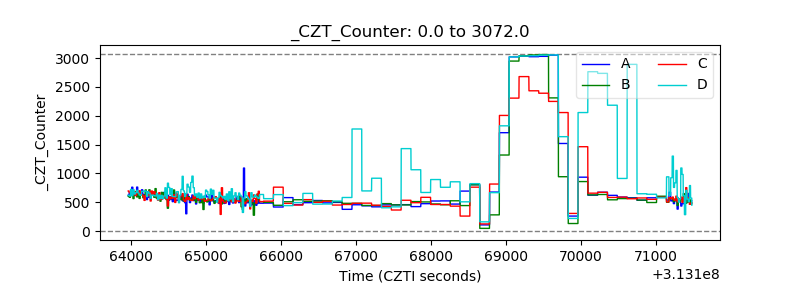 |
| +2.5 Volts monitor | 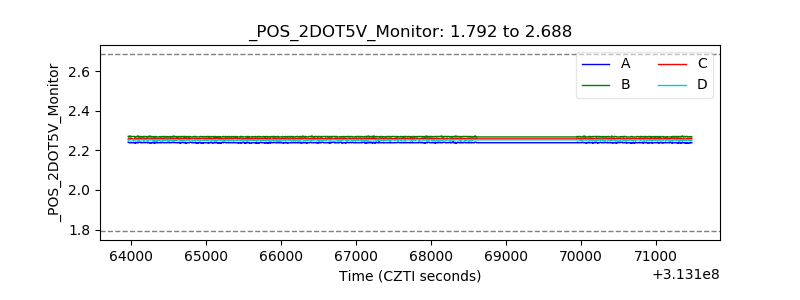 |
| +5 Volts monitor |  |
| _ROLL_ROT | 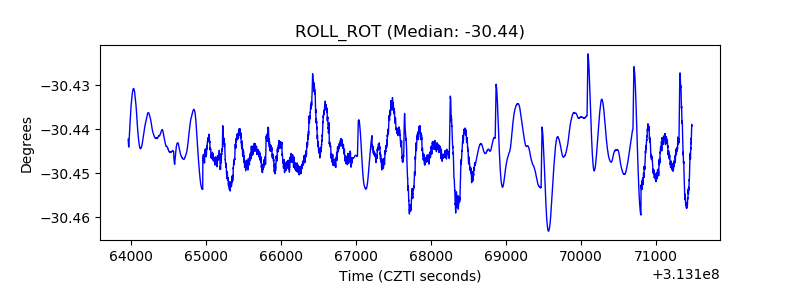 |
| _Roll_DEC | 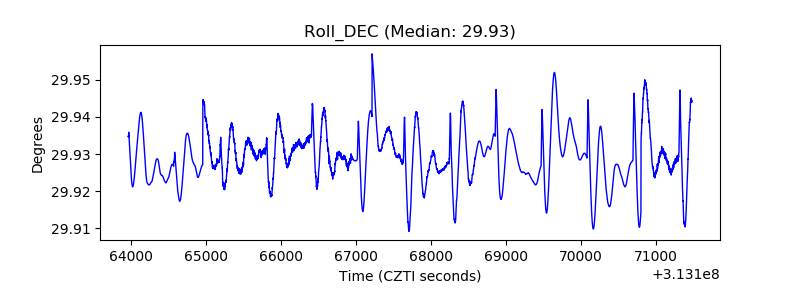 |
| _Roll_RA | 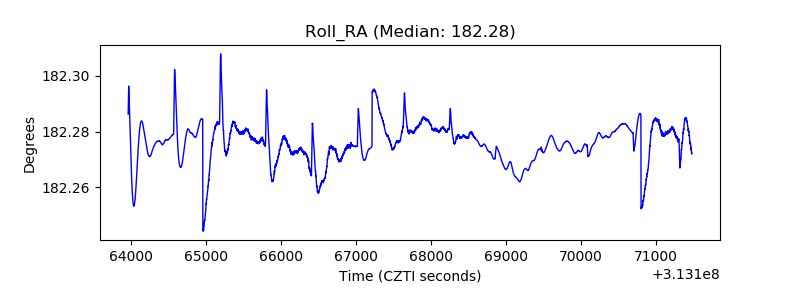 |
| Veto Counter | 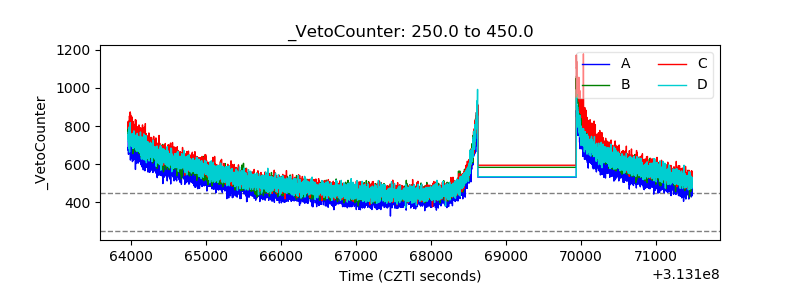 |